
Fig. 1
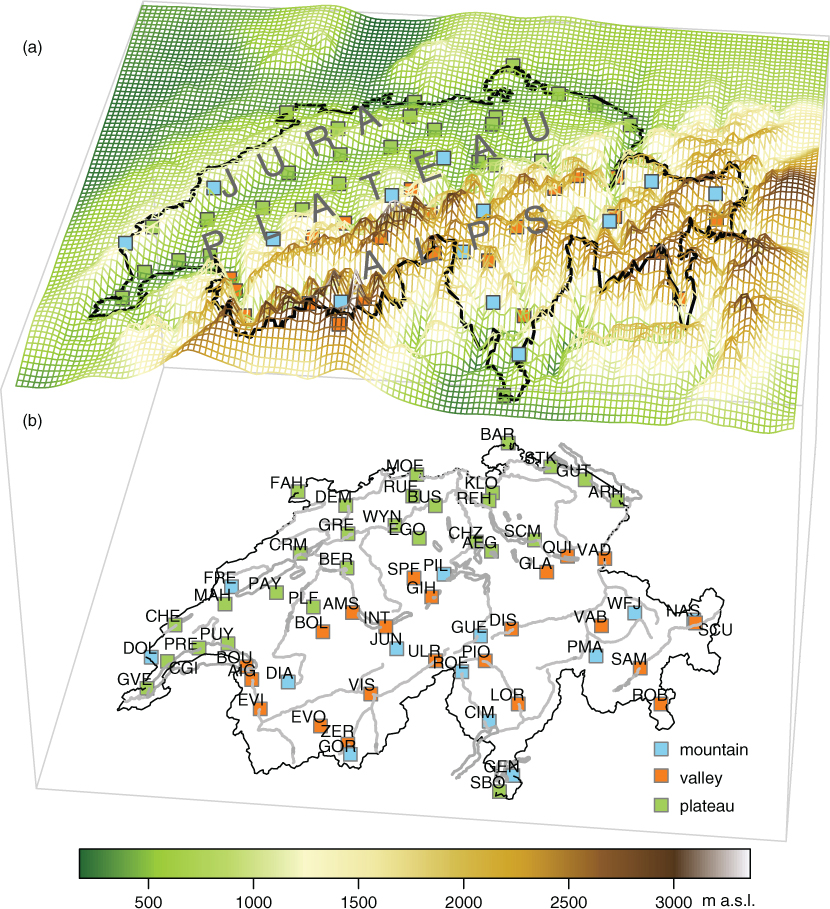
Locations of 63 weather stations from the SMN dataset with measurements of wind and gust speeds in (a) the innermost WRF model domain with a horizontal grid spacing of 3 km. The shade of the facets indicates the 20CR WRF model terrain elevation in m a.s.l. Locations are plotted with their real coordinates and station elevation; differences to the elevation of the corresponding nearest grid point in the 20CR WRF model terrain are plotted in relation to the facets (see also Supplementary Table S2 ). (b) Locations with abbreviated station names within the Swiss river system and with respect to the Swiss topography (coloured boxes). Refer to Supplementary Table S2 for abbreviations.
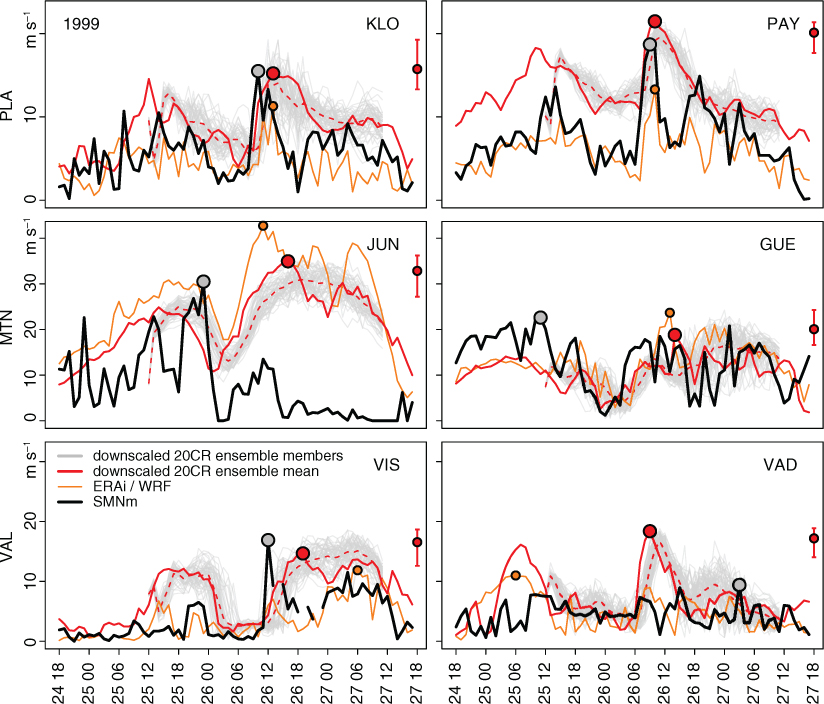
Fig. 2
Temporal evolution of sustained wind during windstorm Lothar between 24 December 1999 (18 CET) and 27 December 1999 (17 CET) at six selected locations, that is at plateau (PLA, top row), mountain (MTN, middle row) and valley (VAL, bottom row) locations. Abbreviations for the specific locations are Kloten KLO, Payerne PAY, Jungfraujoch JUN, Guetsch GUE, Visp VIS, and Vaduz VAD; see Fig. 1 and Supplementary Table S2. Observed sustained wind speeds (SMNm; black line) are compared to simulated sustained wind speed from the downscaled 20CR ensemble mean (red line), the downscaled ensemble members (grey lines), and from the ERAi/WRF configuration (orange line). Dashed red lines mark the average of the ensemble at each time step. Respective maximum values are indicated with filled circles. At the right side of each panel, the range (segments) and the mean (filled circles) of the peak sustained winds in the downscaled 20CR ensemble members are indicated. Note the differing scales of the y-axes (m s−1).
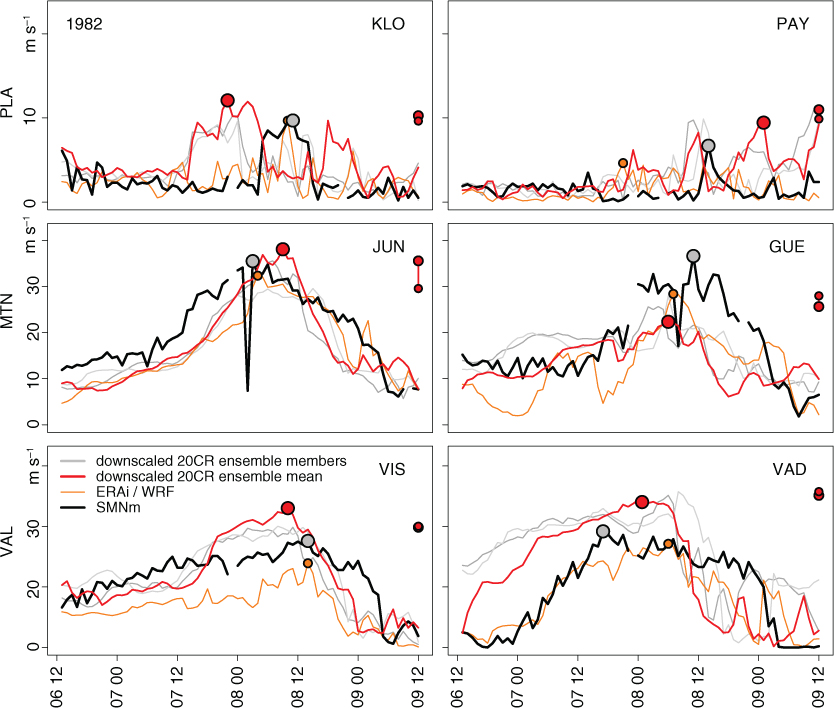
Fig. 3
As in Fig. 2, but for the foehn storm between 06 November 1982 (12 CET) and 09 November 1982 (11 CET) and with simulated sustained wind only from the strongest (dark grey line, larger circle) and weakest (light grey line, smaller circle) 20CR ensemble members.
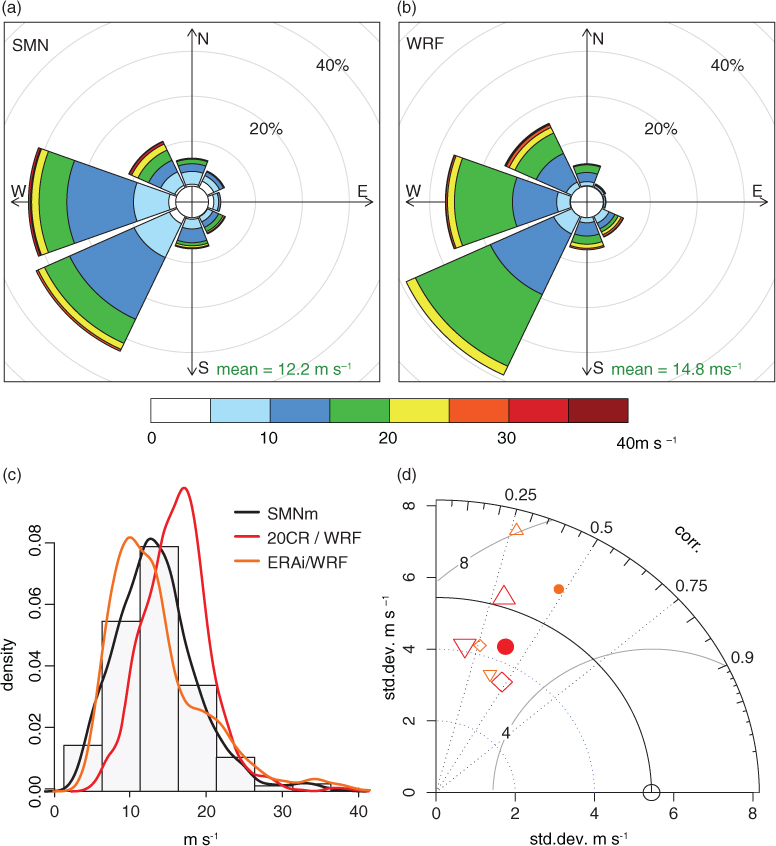
Fig. 4
Statistical properties and relationships between the SMNm, the corresponding peak sustained winds in the 20CR WRF output, and the ERAi/WRF output (see text for details). Wind roses are shown for (a) SMNm and (b) 20CR WRF. (c) Histogram for SMNm (grey bars) and density functions for SMNm (black line), 20CR WRF (red line), and ERAi WRF (orange line). (d) Taylor diagram with SMNm (black circle on x-axis) as reference for all 20CR WRF locations (filled red circle), as well as for 20CR WRF mountain (red upright triangles), valley (downright triangles), and plateau (red diamonds) locations. Analogue symbols in orange show the respective plot positions for ERAi WRF output. Standard deviations of wind speed are indicated on the x- and y-axes, correlation is given by the angle with the x-axis and marked on the marginal arc, and the (centred) RMSD in m s−1 (note difference to non-centred RMSD in Table 1) is indicated in distance arcs from the reference (circle).
Table 1
Performance and skill measures for 20CR WRF output, ERAi WRF output, and four WGPs applied to 20CR WRF outputa
prcBIASBIAScorvar.ratioRMSDSSRMSDcSSc
ALL212.610.40.816.08−0.255.49−0.02MTN10.150.30.817.62−0.177.62−0.17VAL434.020.181.16.51−1.945.12−0.82PLA212.650.470.844.79−0.313.980.1ERAi WRF output/SMNm
prcBIASBIAScorvar.ratioRMSDSSRMSDcSScALL10.180.481.196.14−0.276.14−0.27MTN243.990.271.079.72−0.98.87−0.58VAL−4−0.340.380.944.11−0.184.1−0.17PLA−9−1.170.261.015.26−0.585.13–0.520CR WRF WGPs/SMNx
ALLprcBIASBIAScorvar.ratioRMSDSSRMSDcSScWPD−6−1.490.390.588.740.098.610.12COS−10−2.540.390.729.34−0.038.980.04BRA−15−3.910.440.849.86−0.159.050.03GFC−2−0.520.440.818.910.068.890.06MTNprcBIASBIAScorvar.ratioRMSDSSRMSDcSScWPD−21−6.940.360.6512.06−0.439.860.04COS−22−7.040.310.7812.81−0.6210.7−0.13BRA−26−8.410.350.8513.61−0.8210.7−0.13GFC−16−5.120.400.9511.88−0.3910.72−0.13VALprcBIASBIAScorvar.ratioRMSDSSRMSDcSScWPD102.090.150.728.97−0.388.72−0.30COS20.370.090.879.66−0.69.66−0.60BRA−11−2.280.13110.36−0.8410.11−0.75GFC91.750.170.919.51−0.579.41−0.52PLAprcBIASBIAScorvar.ratioRMSDSSRMSDSSWPD−7−1.760.540.576.410.236.170.29COS−11−2.740.550.746.830.136.250.27BRA−12−3.100.590.866.950.16.220.28GFC−1−0.170.550.806.410.236.410.23
[i] aSimulated peak sustained wind speeds (from 20CR WRF output and from ERAi WRF output) are compared with SMNm in the two uppermost tables by location (MTN is mountain, VAL is valley, PLA is plateau, see also Fig. 1). Simulated peak gusts from the WGPs applied to 20CR WRF are compared with SMNx in the lower three tables. Abbreviations are as follows: prcBIAS is percent bias (%; positive means simulated winds are stronger), BIAS (m s−1) is additive bias, cor is Pearson's correlation coefficient, var.ratio is the ratio between simulated and observed standard deviations, RMSD (m s−1) is the root mean squared difference, SS is the skill score based on MSD (also called Reduction of Variance; see Wilks, 2006). RMSDc and SSc are additive-bias-corrected performance measures and skill scores, respectively. See text for abbreviations of the WGPs.
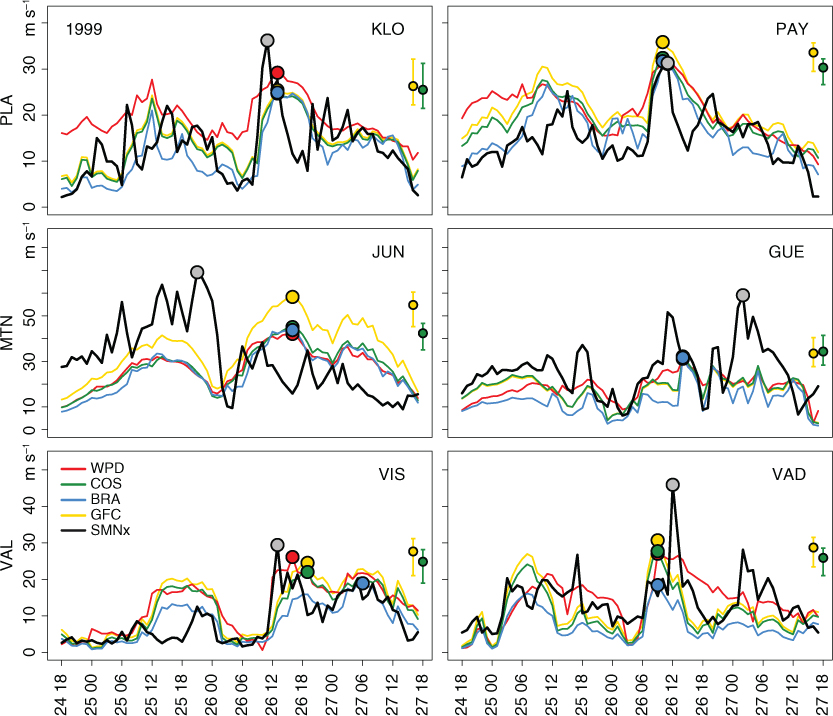
Fig. 5
Observed wind gusts (SMNx; black line) and simulated wind gusts from the downscaled ensemble mean (WPD red line; COS dark green line; BRA blue line; GFC yellow line) for windstorm Lothar between 24 December 1999 (18 CET) and 27 December 1999 (17 CET). The same locations as in Fig. 2 are selected. At the right side of each panel, the range (segments) and the mean (filled circles) of the peak gusts in the downscaled 20CR ensemble members are indicated for the COS and WPD parameterisations. Note the differing scales of the y-axis (m s−1).
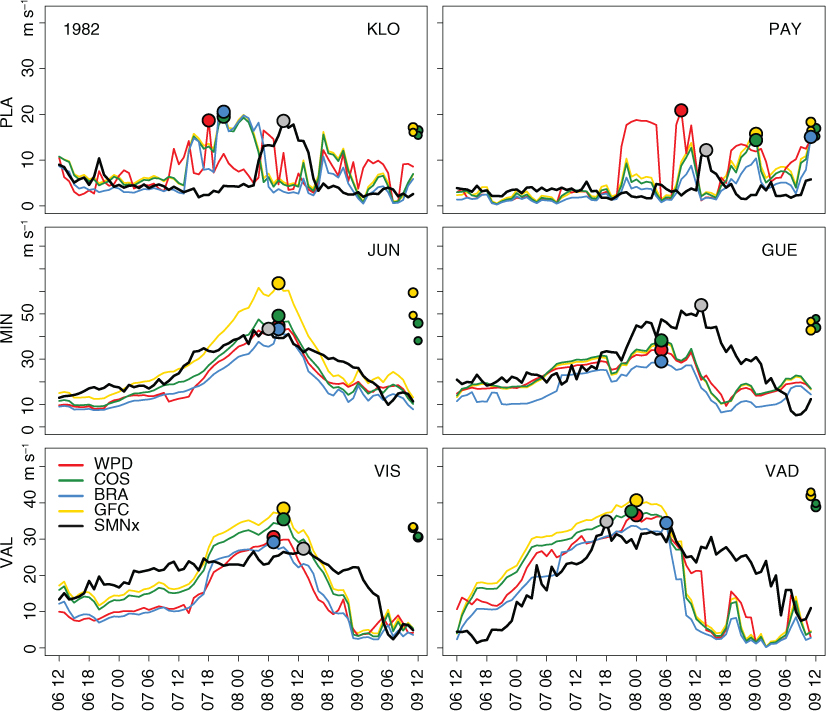
Fig. 6
As in Fig. 5, but for the foehn storm between 06 November 1982 (12 CET) and 09 November 1982 (11 CET) and with simulated peak gusts indicated at the right side of each panel for COS and GFC and from the strongest (larger circle) and weakest (smaller circle) 20CR ensemble member.
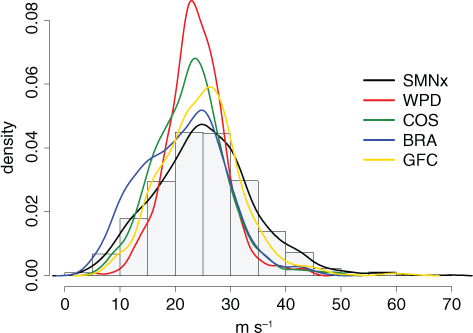
Fig. 7
Histogram of observed wind gusts (SMNx; grey bars) and density functions for SMNx (black line), the wind gust parameterisations WPD (red line), COS (dark green line), BRA (blue line) and GFC (yellow line).
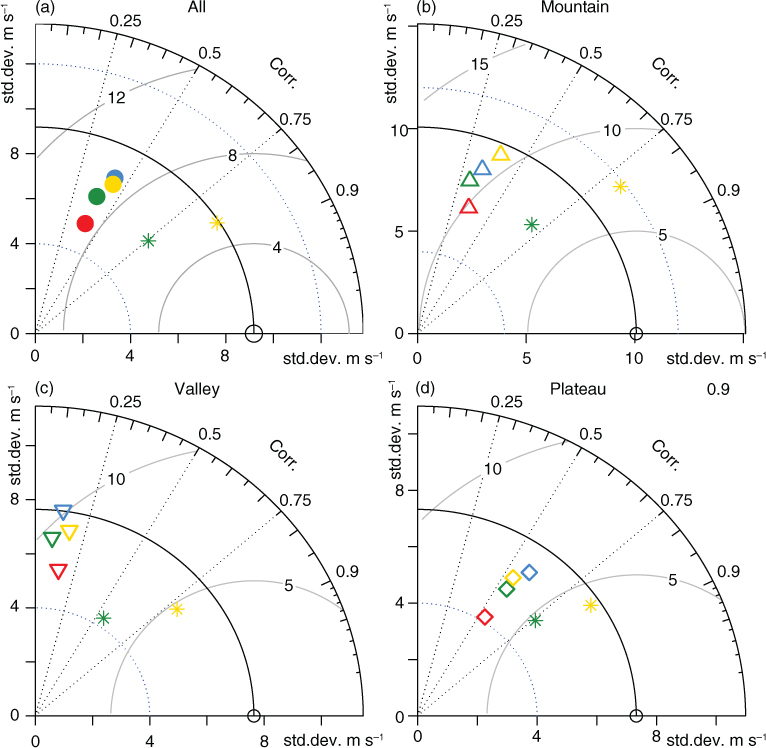
Fig. 8
Taylor diagrams as in Fig. 4, but comparing observed SMNx with simulated peak gusts for the WGPs WPD (red symbols), COS (dark green symbols), BRA (blue symbols), and GFC (yellow symbols). The star symbols indicate parameterisations based on the sustained wind component provided by SMNm, that is, the yellow (dark green) star is the GFC (COS) parameterisation applied to 20CR WRF output.
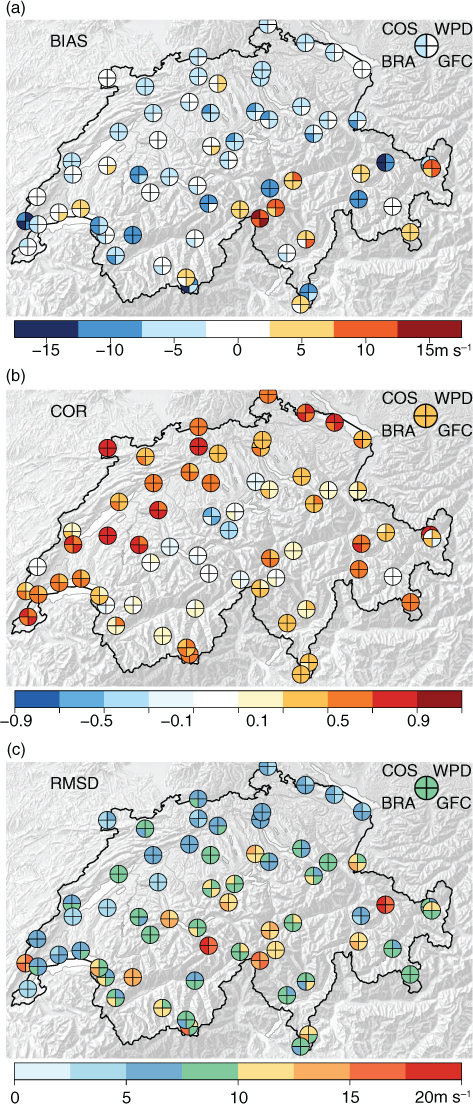
Fig. 9
Maps of (a) additive bias, (b) Pearson's correlation coefficients, and (c) RMSD between simulated and observed peak gust speeds during 14 windstorm events between 1993 and 2011. Performance measures regarding the WPD, COS, BRA, and GFC parameterisation are indicated by colour shade in the upper right, upper left, lower left, and lower right quadrants of the circles. Field averages are given in the upper right corner of the maps.