
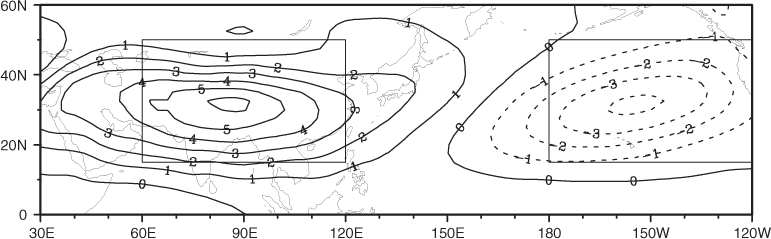
Fig. 1
Climatology of the summer mean upper-tropospheric (500–200 hPa) temperature anomalies from zonal mean (K) for the period 1958–2001 (two boxes represent the regions for Asia and North Pacific, respectively. This was adapted from Fig. 1a of Z07.
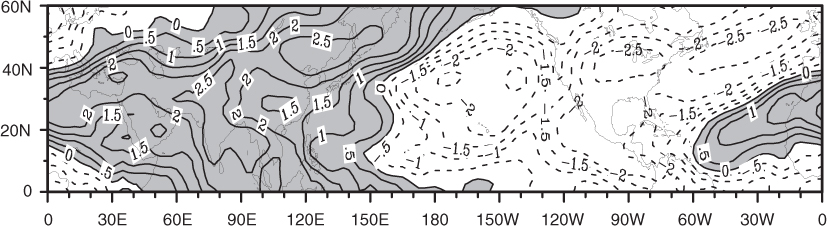
Fig. 2
The spatial pattern (×0.01) of the EOF1 for T′ on the North Hemispheric scale. This was adapted from Fig. 2a of Z07.
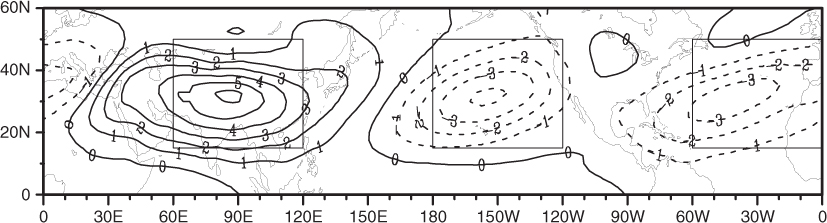
Fig. 3
As in Fig. 1, except for adding the areas for the longitudes of 120°W–0°, in which there was an additional box representing the third action centre area over the North Atlantic Ocean.
{ label needed for table-wrap[@id='T0001'] }
Table 1. The correlation among the respective components of the APA index
AC1−0.780−0.606−0.877PC10.2800.867AtC10.722P–AtC1
Table 2. The correlations between the time series of EOF1 in NHs and the indexes of APO and APA, nAPA as well as their components
NHs EOF10.9300.8810.8030.9050.944
Table 3. As in Table 1, except for the new APA index. An ‘n’ before the name of the terms means the ‘new’ to distinguish from the old one in Table 1
nAC1−0.77−0.86−0.90nPC10.6420.91nAtC10.90nP–AtC1
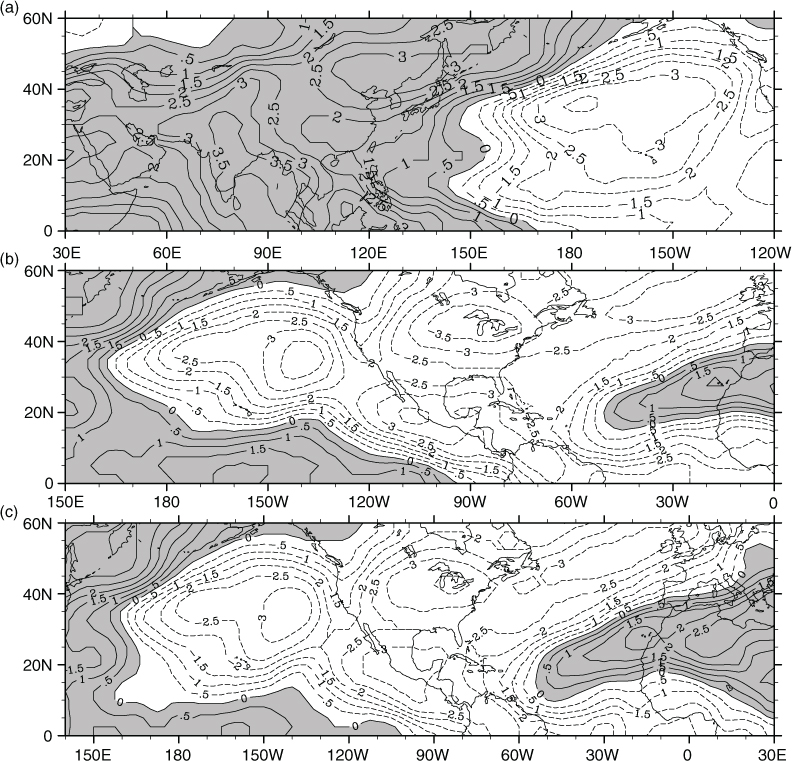
Fig. 4
As in Fig. 2 except for the EOF1 calculated area (a) coinciding with that in Fig. 1, (b) in the Pacific–Atlantic Ocean; (c) extending the Pacific–Atlantic Ocean
{ label needed for table-wrap[@id='T0004'] }
Table 4. The correlation among the time series of EOF1 in the domains of NH, Asian–Pacific, Pacific–Atlantic and extending Pacific–Atlantic
NHs10.9480.8610.962A–P10.6990.842P–At10.957e-P–At1
{ label needed for table-wrap[@id='T0005'] }
Table 5. The correlation between the time series of EOF1 in respective domains and the respective indexes
A–P EOF10.9400.8870.7570.8890.925P–At EOF10.7970.7370.7190.790.834At–A EOF10.8880.8430.8120.8860.918
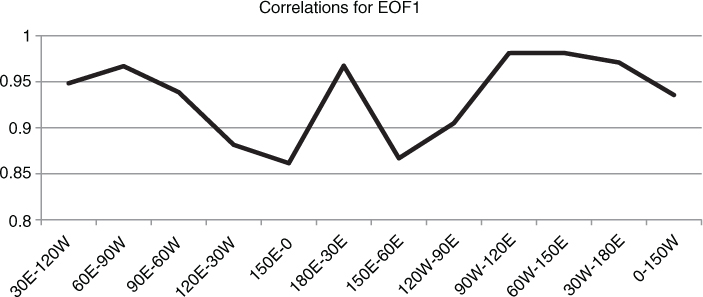
Fig. 5
The evolution of the correlations between time series of the NHs EOF1 and the ones of the respective regional EOF1.
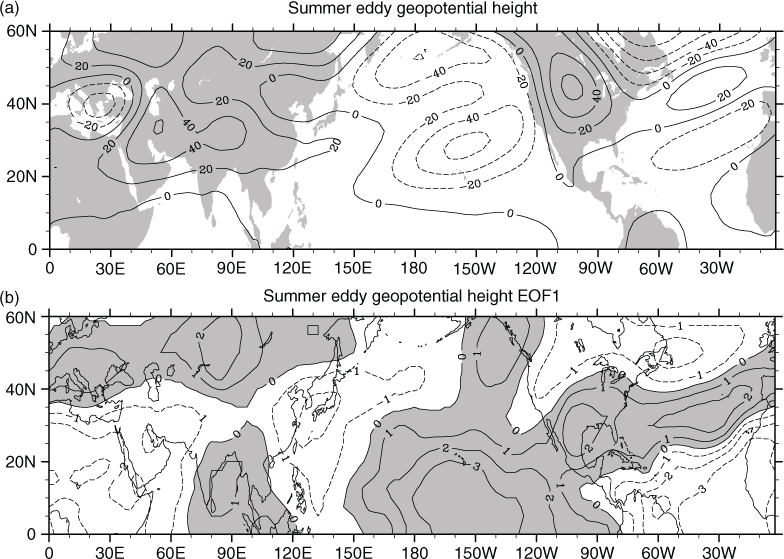
Fig. 6
(a) As in Fig. 3 except for the geopotential height (m); (b) as in Fig. 2 except for the geopotential height (500–200 hPa).
{ label needed for table-wrap[@id='T0006'] }
Table 6. Correlation between the time series of EOF1 for eddy geopotential height from 200 to 500 hPa (NHs H-EOF1) and NHs EOF1, APO index as well as APO index in the geopotential field (H-APO)
NHs H-EOF10.4950.414**0.127
{ label needed for table-wrap[@id='T0007'] }
Table 7. Correlation between AO in the summer and NHs EOF1, NHs H-EOF1 as well as APO index
AO0.135−0.234−0.318*
{ label needed for table-wrap[@id='T0008'] }
Table A1. The acronyms for the pattern names and their associated areas were summarised as follows:
APOAsian–Pacific Oscillation15–50°N, 60–120°E; 15–50°N, 180–120°WAPAAsian–Pacific–Atlantic15–50°N, 60–120°E; 15–50°N, 180–120°W; 15–50°N, 0–60°WACAsian centre15–50°N, 60–120°EPCPacific centre15–50°N, 180–120°WAtCAtlantic centre15–50°N, 0–60°WP–AtCPacific–Atlantic centre15–50°N, 180–120°W;15–50°N, 0–60°WnAPANew APA10–60°N, 70–140°E; 15–50°N, 170°E−120°W;30–60°N, 0–70°WnACNew Asian centre10–60°N, 70–140°EnPCNew Pacific centre15–50°N, 170°E−120°WnAtCNew Atlantic centre30–60°N, 0–70°WnP–AtCNew Pacific–Atlantic centre15–50°N, 170°E−120°W;30–60°N, 0–70°WNHsNorth Hemisphere scale0–60°N, 0°E−0°WA–PArea from Asia to Pacific0–60°N, 30°E−120°WP–AtArea from Pacific to Atlantic0–60°N, 150°E−0°We-P–AtExtended area in Pacific and Atlantic0–60°N, 150°E−30°EH-APOAPO in geopotential height fieldSame as in APO