

Fig. 1
The study region in northern Finland. The green and red dots mark the Sodankylä weather station and Lake Unari observation site, respectively.
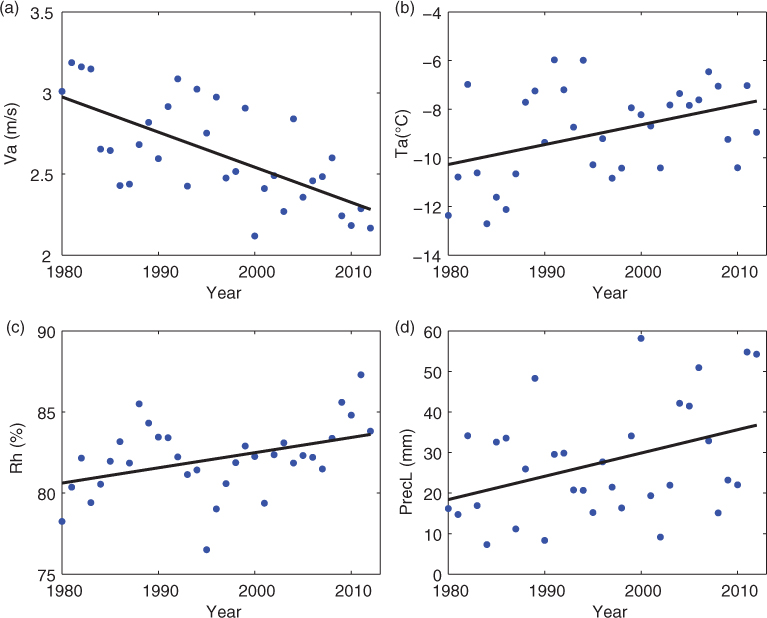
Fig. 2
The inter-annual variations of freezing season mean (blue dots) weather forcing factors of (a) wind speed, (b) air temperature, (c) relative humidity, and (d) liquid precipitation. The linear trends reach a statistical significance (p<0.05).
Table 1. Significance of trends (Mann-Kendall test) of meteorological parameters during the freezing season
T a (°C)1.030.02Rh (%)0.830.01V a (m/s)−0.210.00Cn (%)−0.010.53PrecT (mm)7.300.46PrecL (mm)4.730.05PrecS (mm)−0.050.99HSL (mm)−7.010.70
[i] p: significant probability. A positive slope indicates an increasing trend. Bold numbers: trends reach significance level (p<0.05). Cn: total cloud fraction; HSL: snow depth on land; PrecL: precipitation liquid; PrecS: precipitation solid; PrecT: total precipitation; Rh: relative humidity; T a : air temperatures; V a : wind speed.
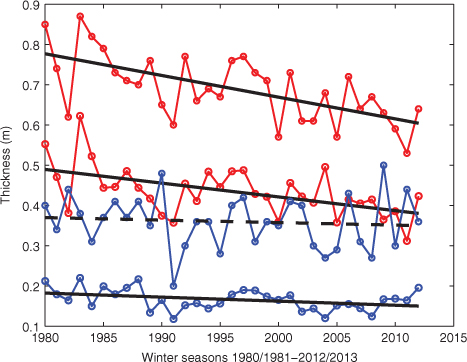
Fig. 3
Observed maximum and average ice (red) and snow (blue) thicknesses in Lake Unari for winter seasons from 1980/1981 to 2012/2013. The black lines are linear trends (solid line: p<0.05; broken line: p>0.05).
Table 2. Significance of trends (Mann-Kendall test) and Theil-Sen's slope calculation for observed and HIGHTSI modelled average and maximum seasonal snow and ice thicknesses
ParametersObservedCalculatedObservedCalculated
Himax (cm)−5.87−5.170.000.01Hiave (cm)−3.21−3.170.000.00Hsmax (cm)−1.06−0.920.430.23Hsave (cm)−0.98−0.520.080.21
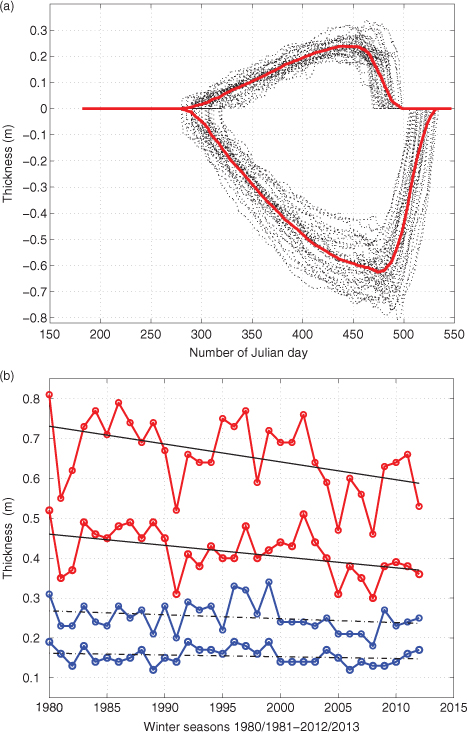
Fig. 4
(a) Time series of modelled snow and ice thickness (black dotted lines) for 33 ice seasons (1980/1981–2012/2013). The red lines are average thicknesses of snow (upper) and ice. (b) Time series of modelled maximum and average ice (red) and snow (blue) thicknesses. The black lines are linear trends (solid line: p<0.05; dashed line: p>0.05).
Table 3. A comparison between observed and simulated maximum and average snow and ice thicknesses for the entire period 1980/1981–2012/2013
Himax (m)0.690.660.510.09Hsmax (m)0.350.250.440.12Hiave (m)0.430.420.550.03Hsave (m)0.170.150.480.06
[i] The correlation coefficient (r) and root mean square error (RMSE) between observed and simulated inter-annual time series are also given. H iave: seasonal average ice thickness; H imax: seasonal maximum ice thickness; H save: seasonal average snow thickness; H smax: seasonal maximum snow thickness.
Table 4. The correlation coefficients between meteorological parameters and modelled columnar, granular and total ice thickness
Granular ice0.110.400.190.700.800.01Columnar ice−0.50−0.24−0.24−0.56−0.58−0.19Total ice−0.580.12−0.13−0.010.08−0.26
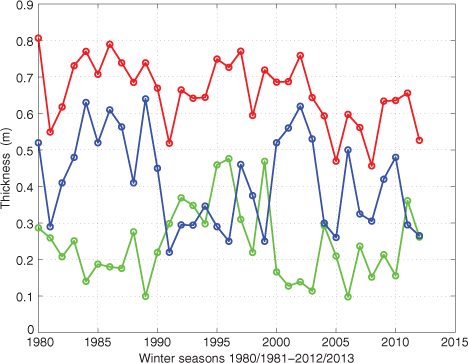
Fig. 5
Time series of the seasonal maximum modelled total (red), columnar (blue) and granular (green) ice thickness.

Fig. 6
The normalised 9-yr Adjacent Average (AAv) smooth values of air temperature and snow precipitation for the freezing season, and seasonal maximum ice thickness and its components (columnar and granular ice).
Table 5. Linear regression equations between weather forcing factors and snow and ice physical parameters
Hsmax (m)Hsmax=0.001·PrecT(FS)−0.01·Ta(ave_FS)−0.003·PrecL(Mar.)+0.030.77Himax (m)Himax=−0.034·Ta(ave_FS)+0.002·PrecT(Feb.)+0.002·PrecS(Jan.)+0.230.58Hsave (m)Hsmax=3.5e−4·PrecT(FS)−0.003·Ta(ave_Nov.)+0.001·PrecS(Dec.)−0.001·Ta(ave_Dec.)+0.040.86Hiave (m)Hiave=−0.03·Ta(ave_FS)−0.002·PrecS(Nov.)+0.001· PrecT(Feb.)+0.04·Va(ave_Jan.)+0.140.73Hgi (m)Hgi=0.002·PrecT(FS)−0.120.63Hci (m)Hci=−0.005·PrecS(Nov.)−0.004·PrecS(Dec.)−0.03·Ta(ave_FS)+0.500.72
[i] In the equations, the forcing variables are presented in an order based on their standardised regression coefficients (the strongest factors first). See the text for definitions of the symbols. ave: average value; FS: freezing season. For precipitation, the value refers to monthly accumulation; H iave: seasonal average ice thickness; H imax: seasonal maximum ice thickness; H save: seasonal average snow thickness; H smax: seasonal maximum snow thickness; H gi: modelled granular ice; H ci: modelled columnar ice.
Table 6. The observed and prognostic snow and ice thicknesses for winter seasons after 2012/2013
HsmaxHsaveHimaxHiave
ObPrognRe. err. (%)ObPrognRe. err. (%)ObPrognRe. err. (%)ObPrognRe. err. (%)
2013/201429290171812555423935102014/2015463034182012605410444092015/201634379141828716016543829
Table 7. The correlation coefficients between large-scale circulation indices and meteorological parameters, snow and ice thickness
AO0.450.500.070.160.280.33−0.030.050.13−0.07−0.14PNA−0.16−0.10−0.090.320.040.05−0.00−0.05−0.120.100.36NAO0.430.440.000.390.350.42−0.060.080.050.080.00PDO0.06−0.51−0.360.15−0.23−0.24−0.040.410.290.150.03
[i] Significant values (p<0.05) are marked as bold. AO: Arctic oscillation; Cn: total cloud fraction; H iave: seasonal average ice thickness; H imax: seasonal maximum ice thickness; H save: seasonal average snow thickness; H smax: seasonal maximum snow thickness; NAO: North Atlantic Oscillation; PDO: Pacific Decadal Oscillation; PNA: Pacific/North American pattern; PrecL: precipitation liquid; PrecS: precipitation solid; PrecT: total precipitation; Rh: relative humidity; T a : air temperatures; V a : wind speed.

Fig. 7
The composite difference (value of thin ice season subtract value of thick ice season) of winter means (DJF) values of 2-m air temperature (a); the large-scale atmospheric circulation pattern of 500 hPa geopotential height averaged over years of thick (b) and thin (c) ice seasons; the mean-sea-level pressure averaged over years of thick (d) and thin (e) ice season. The shaded areas in (a) indicate 95 % confidence level. The violet and blue colours represent positive and negative composite differences, respectively. The seasons of thick lake ice are 1980/1981, 1983/1984, 1984/1985, 1985/1986, 1992/1993, 1997/1998, and those of thin lake ice are 1991/1992, 2000/2001, 2005/2006, 2010/2011, 2011/2012.