
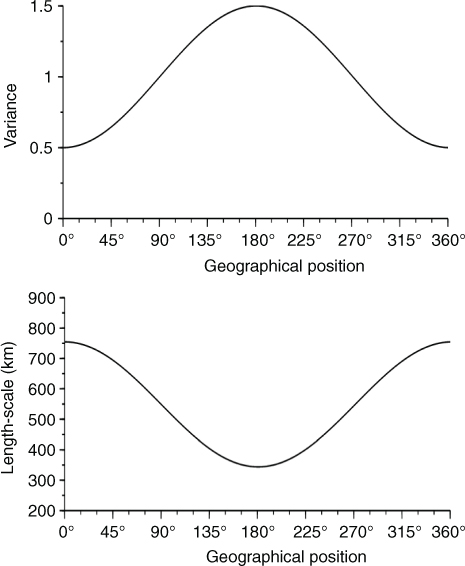
Fig. 1
Background error variance field (top) and length-scale field (bottom).
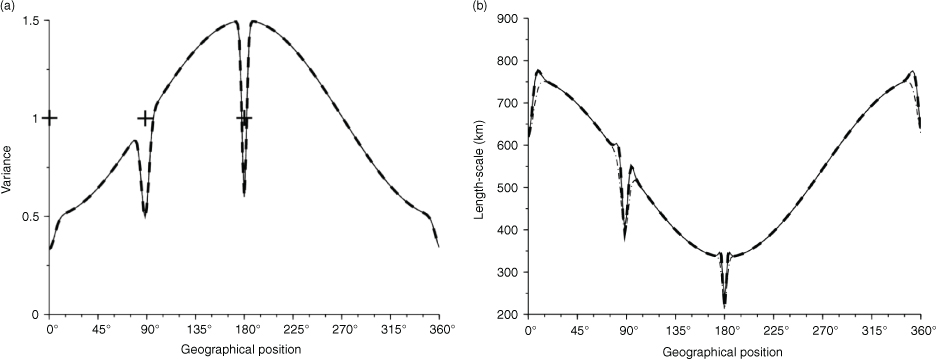
Fig. 2
Illustration of analysis error variance (left panel) and length-scale (right panel) for the assimilation of three observations: 0, 45 and 90, when the background correlation is homogeneous and Gaussian. The Kalman reference (continuous line) is compared with the PKF analysis using the first-order eq. (12) (dash dotted line) and the second-order eq. (13) (dashed line).
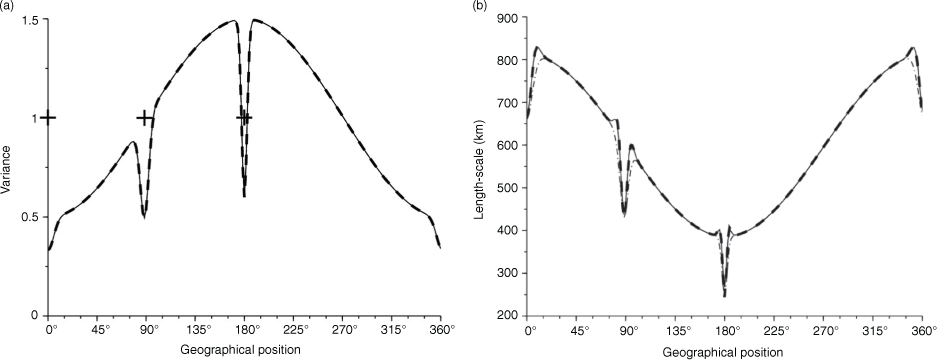
Fig. 3
Similar to Fig. 2 but when the background correlation is homogeneous and SOAR.
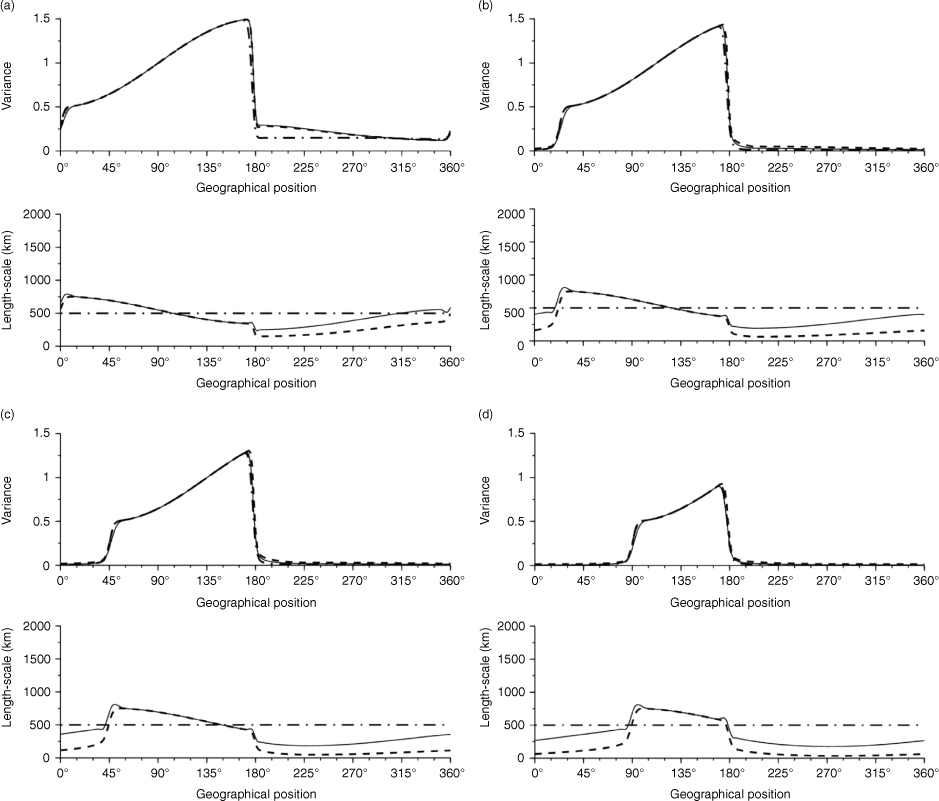
Fig. 4
Diagnosis of the analysis covariance matrix at iterations 1 (a), 15 (b), 30 (c) and 60 (d) in case of a pure advection process. KF time evolution (continuous line), the PKF (dashed line) and the PhKF (dash dotted line).
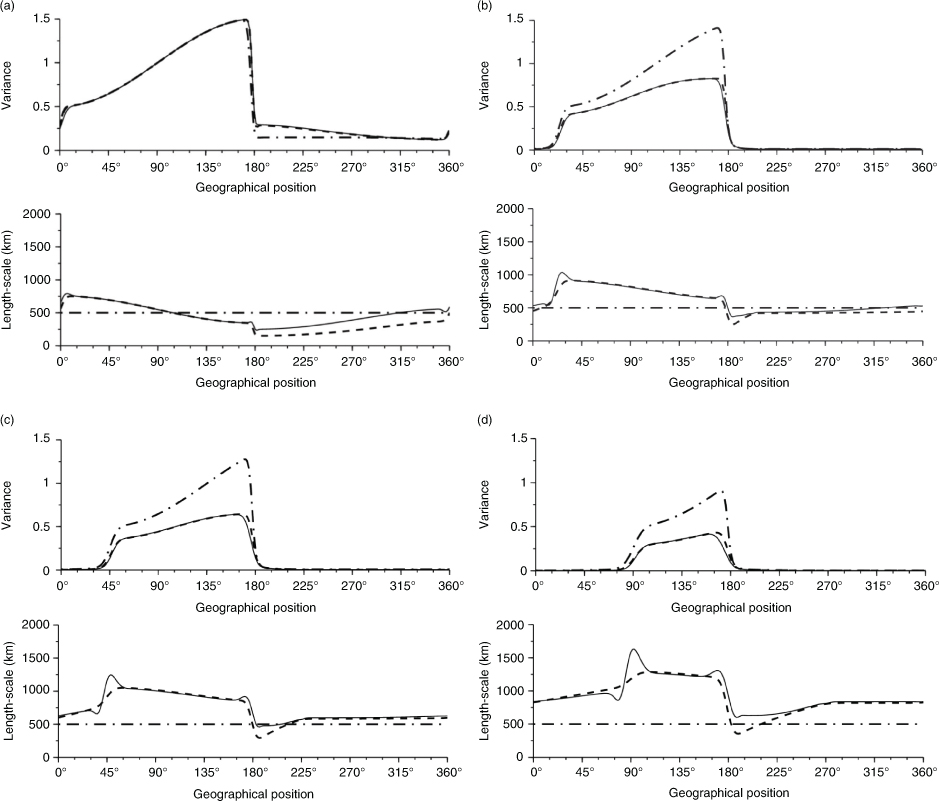
Fig. 5
Diagnosis of the analysis covariance matrix at iterations 1 (a), 15 (b), 30 (c) and 60 (d) in case of an advection–diffusion dynamics. KF time evolution (continuous line), the PKF (dashed line) and the PhKF (dash dotted line).