
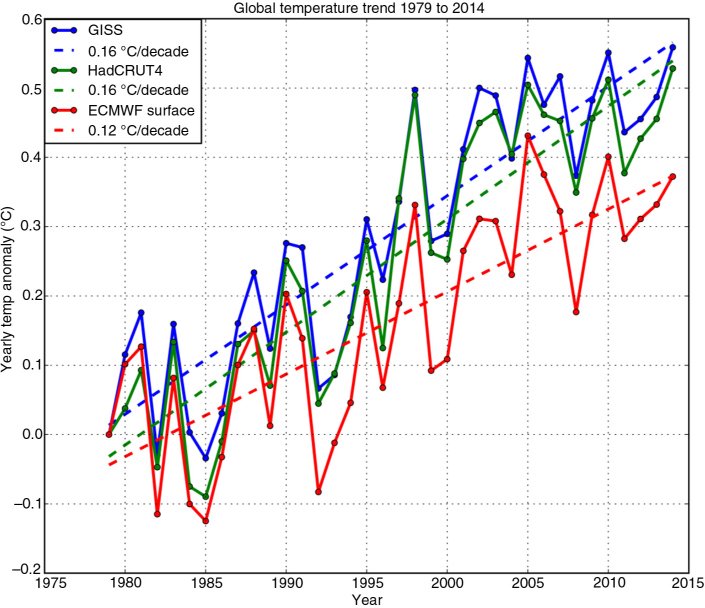
Fig. 1
Global mean surface temperature trends for the period 1979–2013 for ERAI, GISSTEMP and HadCRUT4.
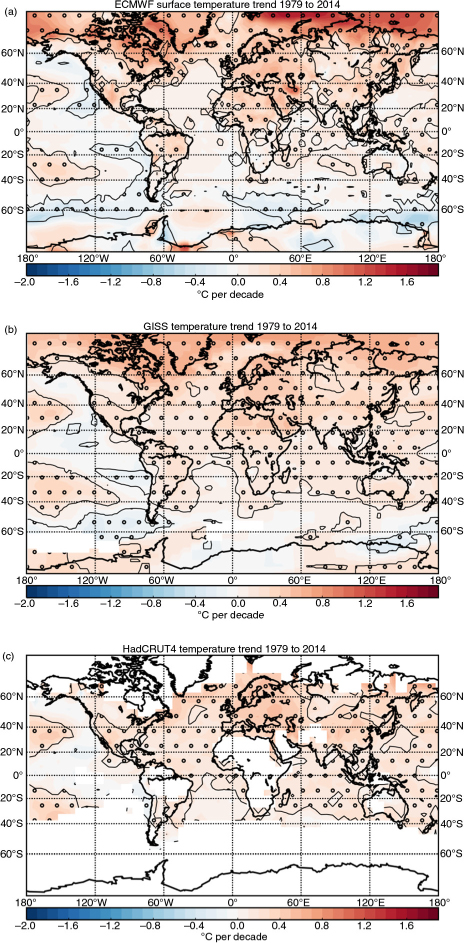
Fig. 2
Surface temperature trends for the period 1979–2013 for (a) ERAI, (b) GISSTEMP and (c) HadCRUT4. Significant trends at the 95 % level are indicated by the open circles.
{ label needed for table-wrap[@id='T0001'] }
Table 1. Surface temperature trends in °C/decade for the period 1979–2014
Glob. land0.26±0.060.25±0.050.27±0.06Glob. ocean0.06±0.020.12±0.020.12±0.02Glob. all0.12±0.030.16±0.030.16±0.03NH land0.33±0.070.31±0.070.31±0.07NH ocean0.14±0.030.18±0.030.16±0.03NH all0.21±0.040.23±0.040.22±0.04
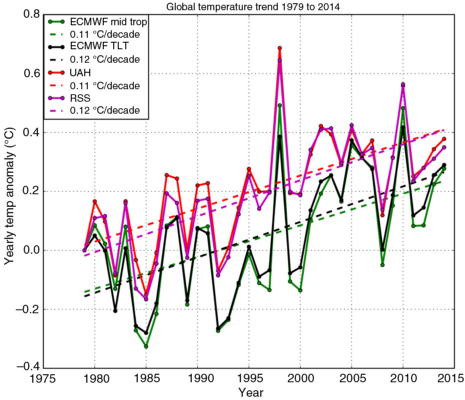
Fig. 3
Global mean upper air temperature trends for the period 1979–2013 for ERAI, UAH and RSS.
{ label needed for table-wrap[@id='T0002'] }
Table 2. Temperature trends in °C/decade for the period 1979–2014
Glob. land0.09±0.060.19±0.060.17±0.06Glob. ocean0.11±0.060.08±0.040.11±0.04Glob. all0.11±0.060.11±0.050.12±0.05NH land0.12±0.070.19±0.060.19±0.07NH ocean0.13±0.060.09±0.050.15±0.05NH all0.13±0.060.13±0.050.16±0.05
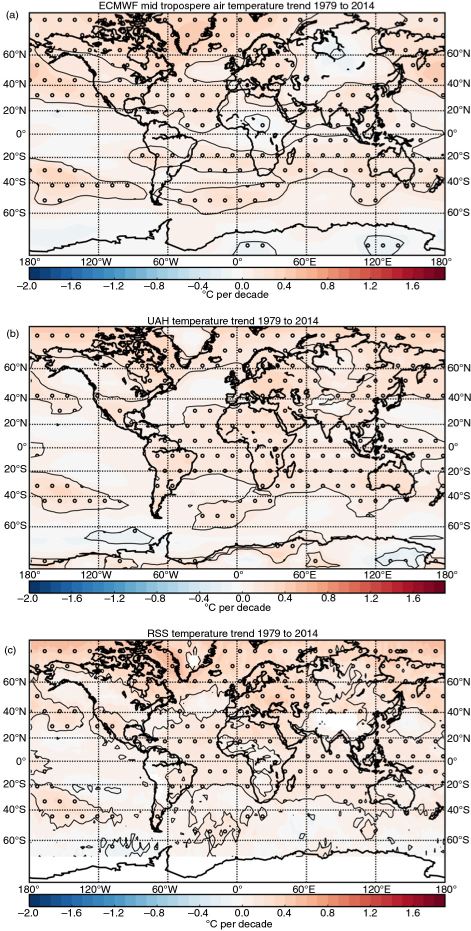
Fig. 4
(a) ERAI temperature trend for the mean temperature of the layer 700–400 hPa, (b) UAH TLT trend and (c) RSS TLT trend. Significant trends at the 95 % levels are indicated by the open circles.
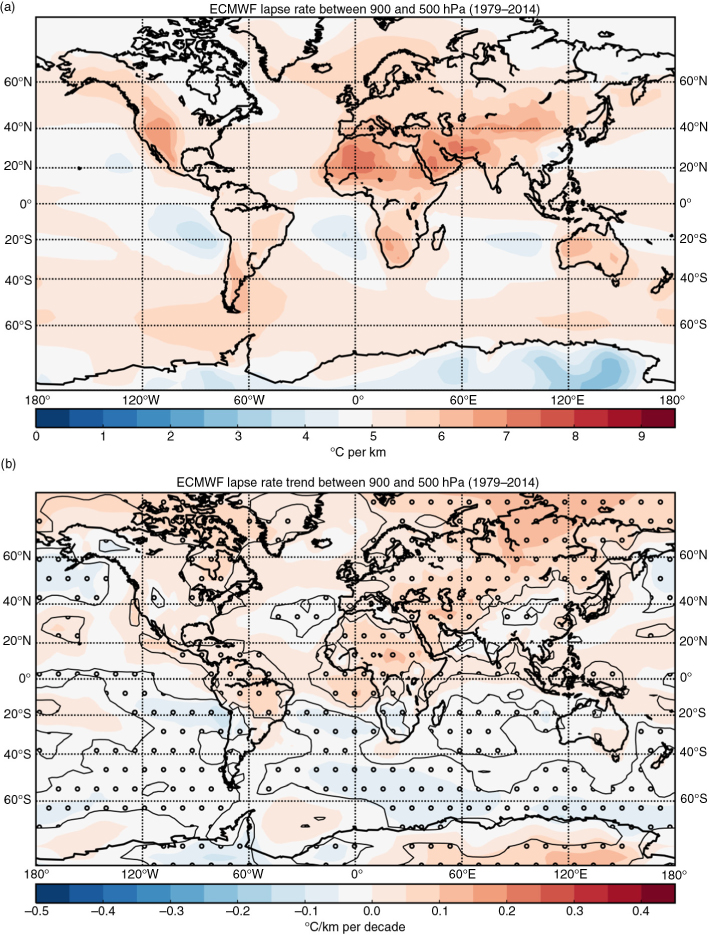
Fig. 5
(a) ERAI mean lapse rate and (b) lapse rate trend between 900 and 500 hPa. Significant trends at the 95 % levels are indicated by the open circles.
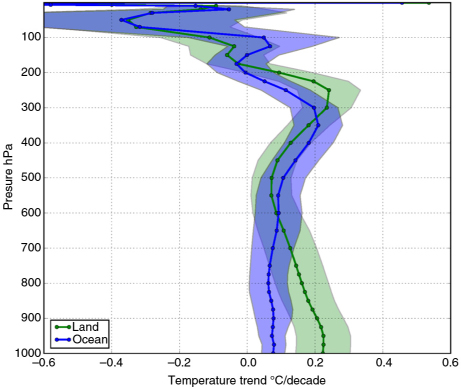
Fig. 6
ERAI global decadal temperature trends for all vertical levels 1000 – 1 hPa. Significant trends at the 95 % level are indicated by shading.
Table 3. The same as Table 2 but where the ERAI layer mean has been replaced by TLT calculated from the ERAI equivalent to a MSU sounder from the real atmosphere
Glob. land0.16±0.060.19±0.060.17±0.06Glob. ocean0.10±0.050.08±0.040.11±0.04Glob. all0.12±0.070.11±0.050.12±0.05NH land0.21±0.070.19±0.060.19±0.07NH ocean0.16±0.060.09±0.050.15±0.05NH all0.18±0.060.13±0.050.16±0.05