
Table 1. Model simulations analysed
ControlControlClim.Fixed20Plus 2Kp2KClim.+2KFixed202×CO2CO2Clim.2×20+2K 2×CO2p2KCO2Clim.+2K2×20

Fig. 1
Global tropical cyclone tracks in 10 yr of (a) observations (1992–2001) and (b) in the model control simulation.
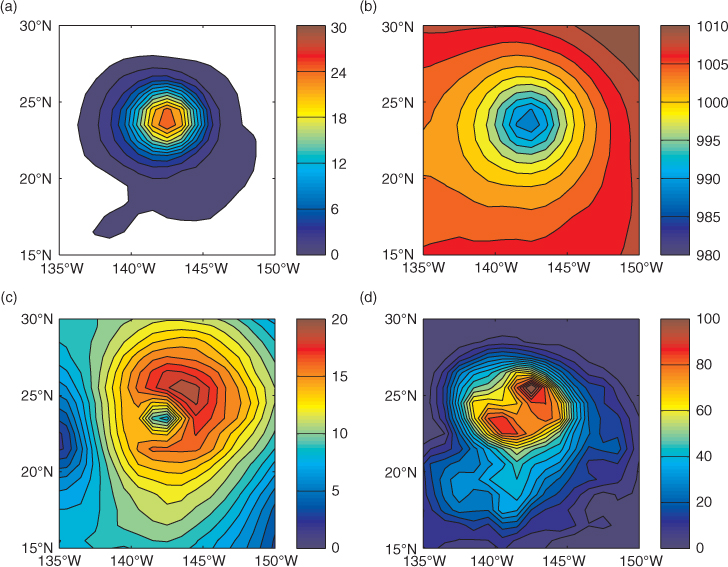
Fig. 2
Structure of a typical GISS model tropical cyclone (a) relative vorticity at 850 hPa ×in s−1, (b) sea level pressure (hPa), (c) daily mean surface wind speed (m/s) and (d) daily mean precipitation (mm/d).
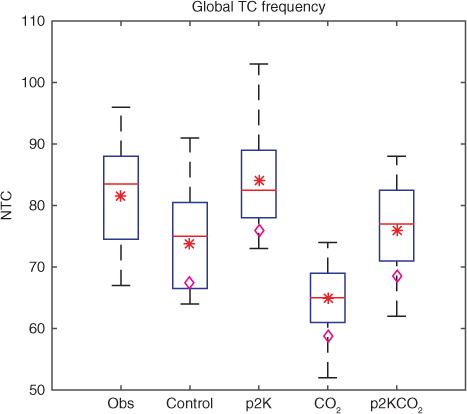
Fig. 3
Global number of tropical cyclones per year (June–July in the Southern Hemisphere basins) in observations (1984–2005), in the four GISS simulations: control, p2K, CO2 and p2KCO2 (as defined in Table 1). The red asterisks (*) indicate the 20-yr mean. The magenta diamonds (⋄) show the 20-yr mean value when the North Indian TCs are only counted during the TC season (April–June and October–December).
Table 2. Statistics of number of tropical cyclones per year for the Northern (Southern) Hemisphere from January to December (July to June) in the control run (20 yr), and observations in the period 1985–2004
LocationMean%SDMean%SD
South Indian5.67.62.110.813.22.5Australian Region6.99.32.88.19.93.1South Pacific6.28.42.45.87.13.5South Atlantic0.20.30.40.10.10.2Southern Hemisphere18.925.65.324.828.94.6North Indian12.316.63.72.73.31.9Western North Pacific28.939.15.025.631.34.0Central North Pacific8.912.02.81.62.01.4Eastern North Pacific2.73.71.515.519.04.2North Atlantic2.24.21.511.914.23.6Northern Hemisphere55.074.48.657.069.76.1Globe73.910010.281.81008.0North Indian*5.88.62.12.73.31.9Northern Hemisphere*48.572.08.157.069.76.1Globe*67.41009.681.81008.0
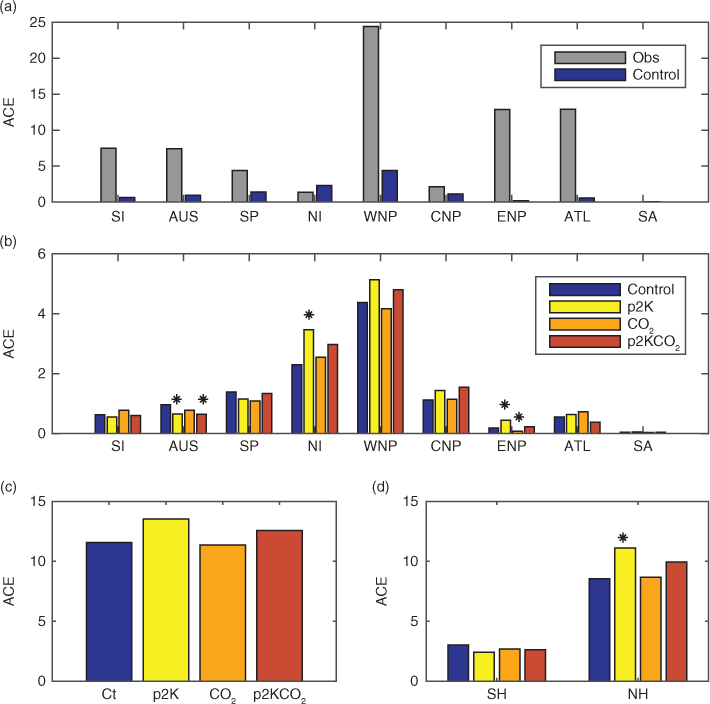
Fig. 4
(a) Mean ACE (accumulated cyclone energy, in (m/s)2) in observations and MACE (modified accumulated cyclone energy) for the control run per year and per basin. Mean MACE (in (m/s)2) in the four GISS simulations: control (Ct), p2K, CO2 and p2KCO2 per year: (b) per basin, (c) in the globe, and (d) per hemisphere. The abbreviations are defined as South Indian (SI), Australian (AUS), South Pacific (SP), North Indian (NI), western North Pacific (WNP), central North Pacific (CNP), eastern North Pacific (ENP), North Atlantic (ATL), South Atlantic (SA), Southern Hemisphere (SH) and Northern Hemisphere (NH). In panels b–d, statistically significant differences of MACE distributions between present and future simulations are marked with an asterisk (*), based on a Kolmogorov–Smirnov test at a 99 % significance level.

Fig. 5
Histogram of the lifetime maximum intensity for maximum wind speed (in m/s, (a)) and minimum surface pressure (in hPa, (c)) in observations (grey bars) and the control simulation (blue bars). The vertical lines show the thresholds separating the tropical depression (TD), tropical storm (TS) and Saffir–Simpson categories 1–5 (C1–C5). TC lifetime maximum intensity [wind speed in m/s (b) and surface pressure in hPa (d)] probability distribution functions, obtained by fitting the data to a generalised extreme value distribution, for the four GISS simulations: control, p2K, CO2 and p2KCO2.
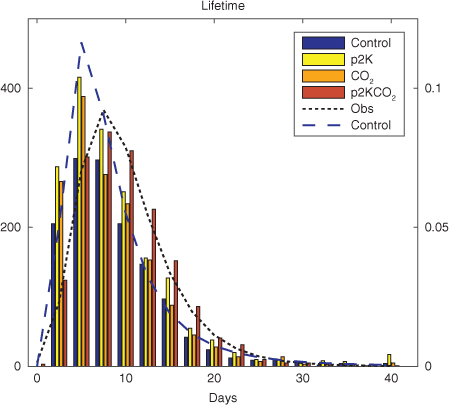
Fig. 6
Histogram of TC lifetime (days) for the four GISS simulations: control, p2K, CO2 and p2KCO2 (bars and left vertical axis). TC lifetime probability distribution functions, obtained by fitting the data to a generalised extreme value distribution, for observations (black dotted line, right vertical axis) and the control simulation (blue dashed line, right vertical axis).
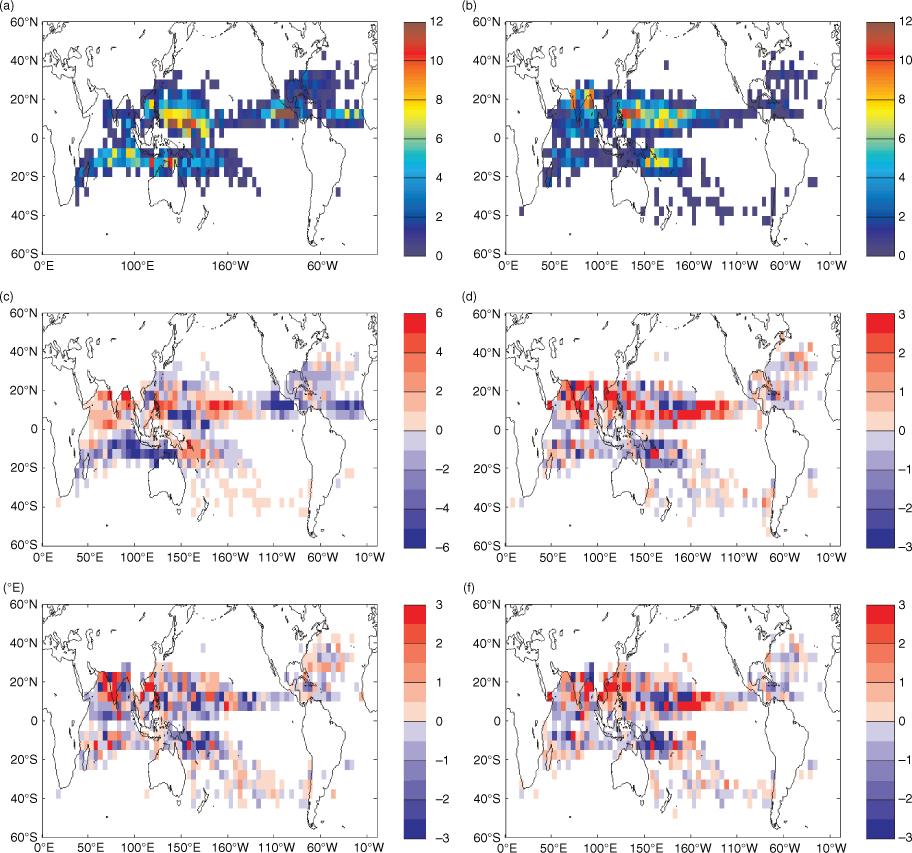
Fig. 7
Track density (mean count of TC passages per grid point) in (a) observations and (b) the control simulation. Track density differences between (c) control and observations, (d) p2K and control, (e) CO2 and control, and (f) p2KCO2 and control.

Fig. 8
Number of tropical cyclones per year in observations and in the four GISS simulations: control, p2K, CO2 and p2KCO2 per basin in (a) South Indian Ocean, (b) Australian Region, (c) South Pacific, (d) North Indian Ocean, (e) western North Pacific, (f) central North Pacific, (g) eastern North Pacific and (h) North Atlantic. The red asterisks indicate the 20-yr mean. The magenta diamonds (⋄) in panel d show the 20-yr mean value when the North Indian TCs are only counted during the TC season (April–June and October–December).
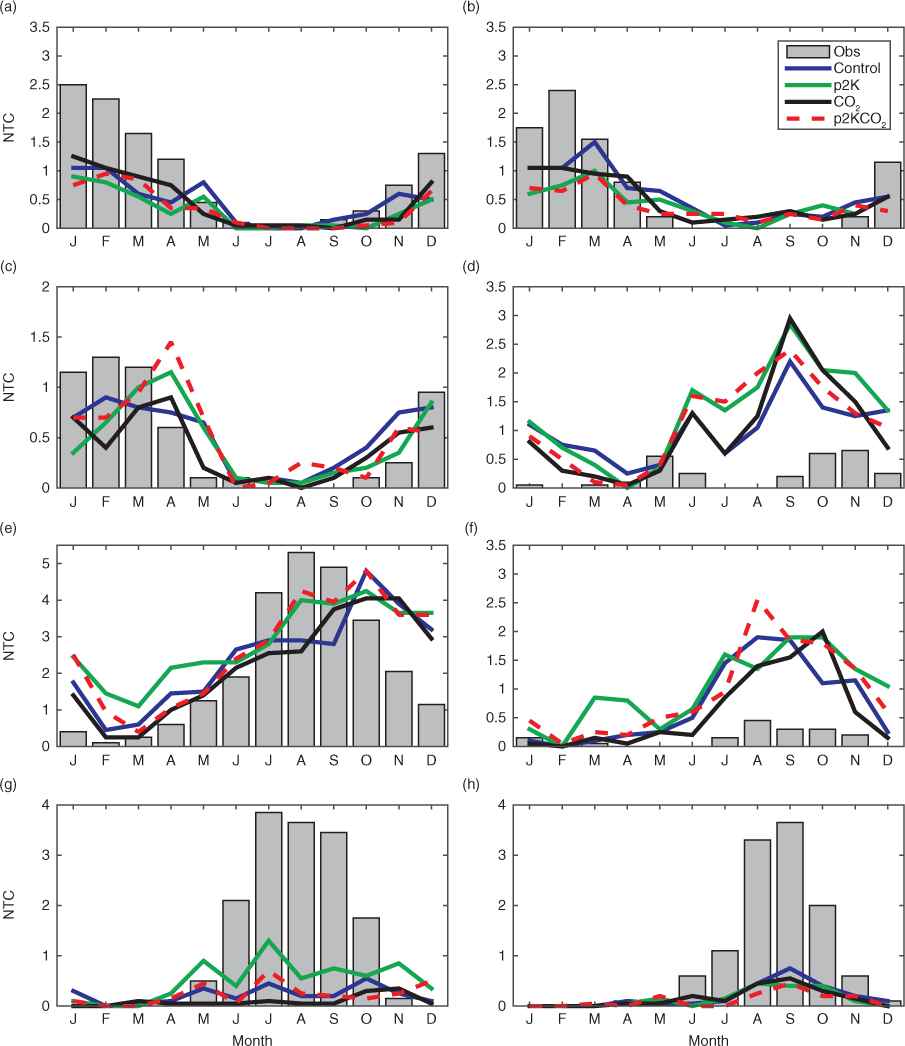
Fig. 9
Mean number of tropical cyclones per month and per basin in observations (1984–2005), in the four GISS simulations: control, p2K, CO2 and p2KCO2 in (a) South Indian Ocean, (b) Australian Region, (c) South Pacific, (d) North Indian Ocean, (e) western North Pacific, (f) central North Pacific, (g) eastern North Pacific and (h) North Atlantic.
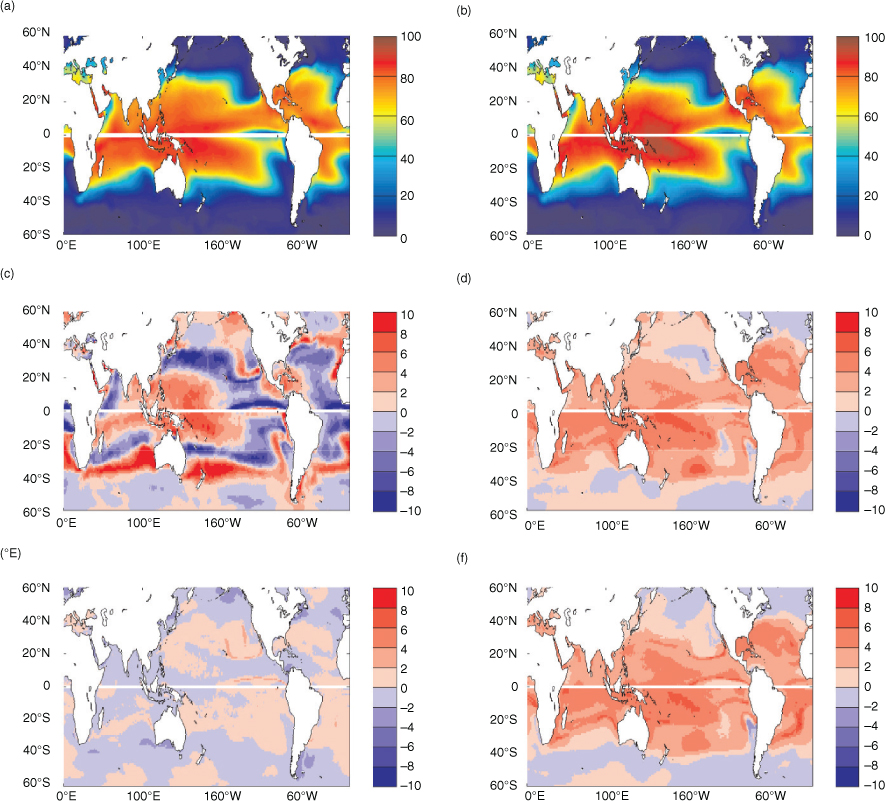
Fig. 10
Potential intensity (m/s) in (a) the ERA-Interim reanalysis and (b) the control simulation. Potential intensity differences between (c) control and ERA-Interim reanalysis, (d) p2K and control, (e) CO2 and control, and (f) p2KCO2 and control. In all panels, August–October (ASO) seasonal means are shown in the Northern Hemisphere and January–March (JFM) means in the Southern Hemisphere.
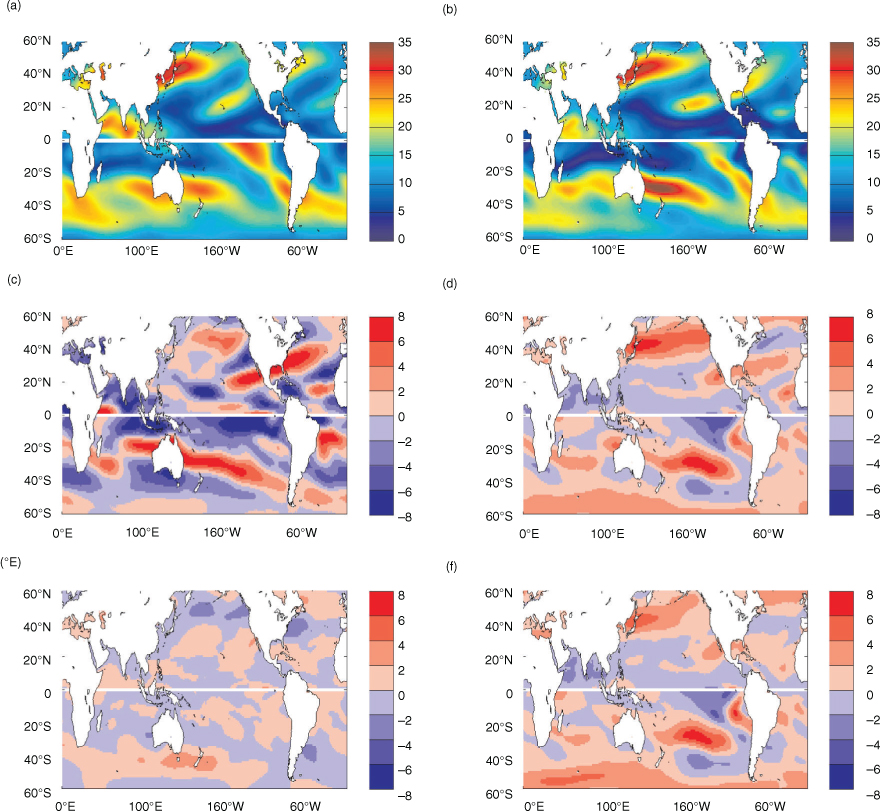
Fig. 11
Magnitude of the climatological mean vertical wind shear (200 hPa minus 850 hPa, in m/s) in (a) the ERA-Interim reanalysis and (b) the control simulation. Vertical winds shear magnitude differences between (c) control and ERA-Interim reanalysis, (d) p2K and control, (e) CO2 and control, and (f) p2KCO2 and control. In all panels, ASO (JFM) is shown in the Northern (Southern) Hemisphere.
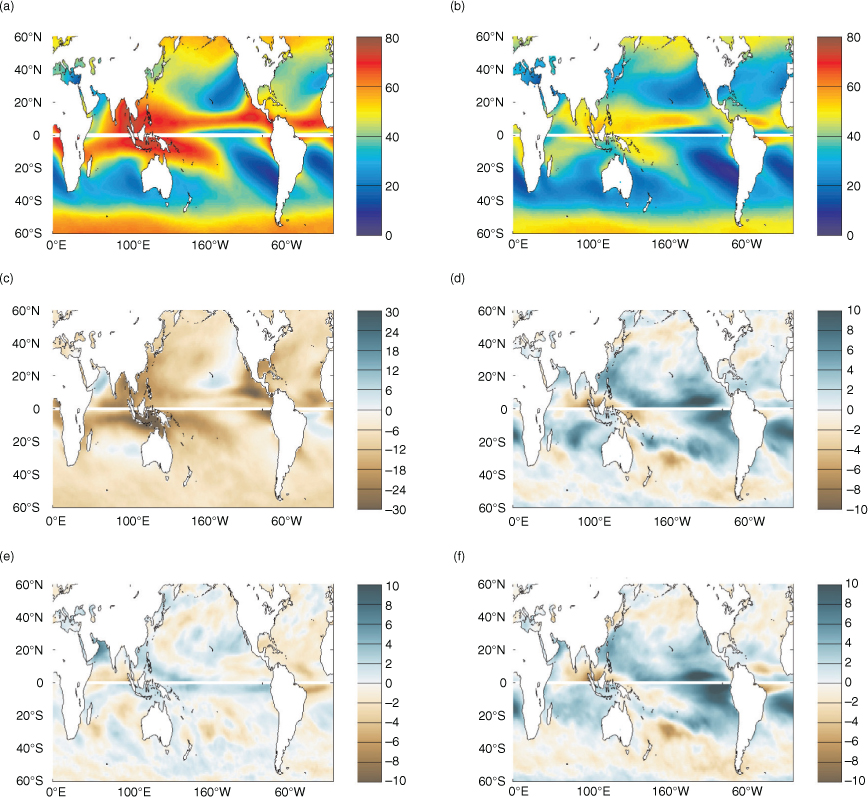
Fig. 12
Climatological mean relative humidity (in%) at 600 hPa in (a) the ERA-Interim reanalysis and (b) the control simulation. Relative humidity 600 hPa differences between (c) control and ERA-Interim reanalysis, (d) p2K and control, (e) CO2 and control, and (f) p2KCO2 and control. In all panels, ASO (JFM) is shown in the Northern (Southern) Hemisphere.
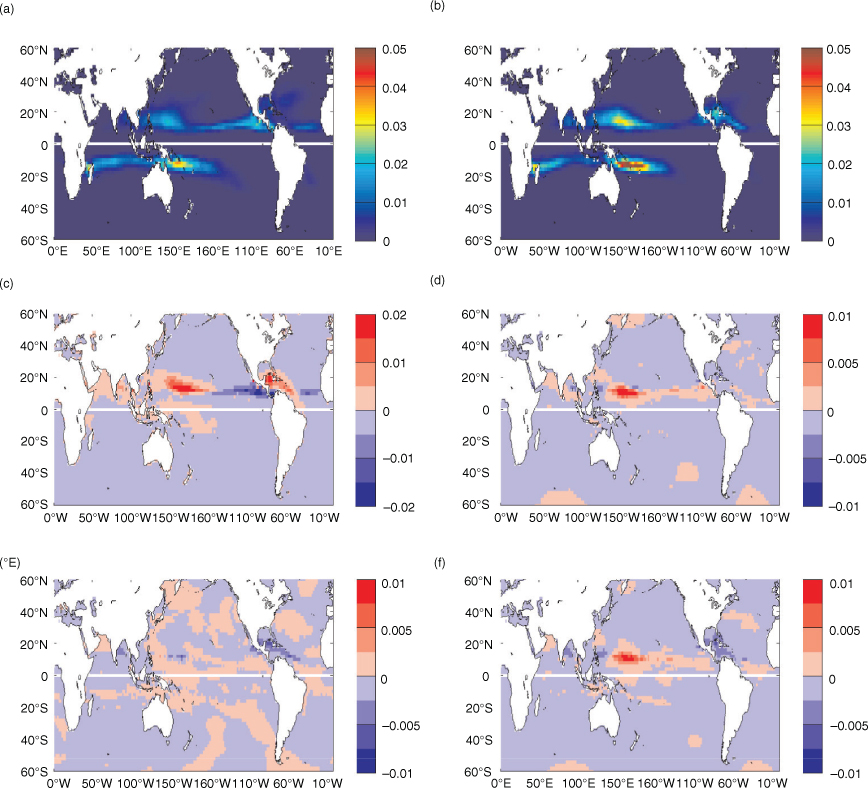
Fig. 13
Climatological mean Tropical Cyclone Genesis Index (TCGI; mean number of TC genesis per year per grid point) in (a) the ERA-Interim reanalysis and (b) the control simulation. TCGI differences between (c) control and ERA-Interim reanalysis, (d) p2K and control, (e) CO2 and control, and (f) p2KCO2 and control. In all panels, ASO (JFM) is shown in the Northern (Southern) Hemisphere. The model TCGI in all simulations has been normalised by the ratio of the integrated value of the annual TCGI in the control and ERA-Interim.