
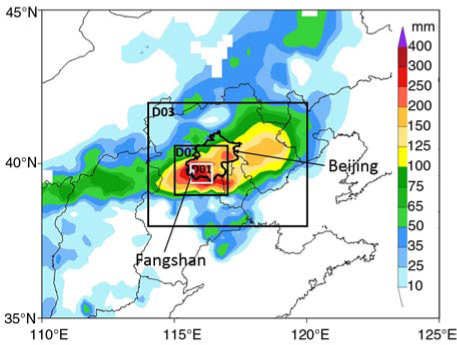
Fig. 1
The distribution of 24-h (from 0000 UTC 21 July to 0000 UTC 22 July 2012) rainfall (shaded, mm) observation. The inner solid boxes (D01, D02 and D03) represent the three increasingly large areas used for the rainfall average.

Fig. 2
The ECMWF analyses at 0000 UTC 21 July 2012 (left panels) and 1200 UTC 21 July 2012 (right panels) of (a, b) 200-hPa wind speed (shaded, m s−1) and geopotential height (contour, every 60 gpm), (c and d) 500-hPa geopotential height (contour, every 40 gpm) and horizontal water vapour flux (shaded, g m−1 Pa−1 s−1) with the thick black line representing the trough axis, (e and f) 850-hPa geopotential height (black contour, every 20 gpm), wind vectors with a speed larger than 10 m s−1 and horizontal water vapour flux (shaded, g m−1 Pa−1 s−1), and (g and h) total column water (tcw) (shaded, kg m−2). The red cross in (e) and (f) represents the location of the low-pressure centre at 850 hPa. The red typhoon symbol represents the location of typhoon Vicente. The black cross in each panel represents the location of the Beijing metropolitan area.
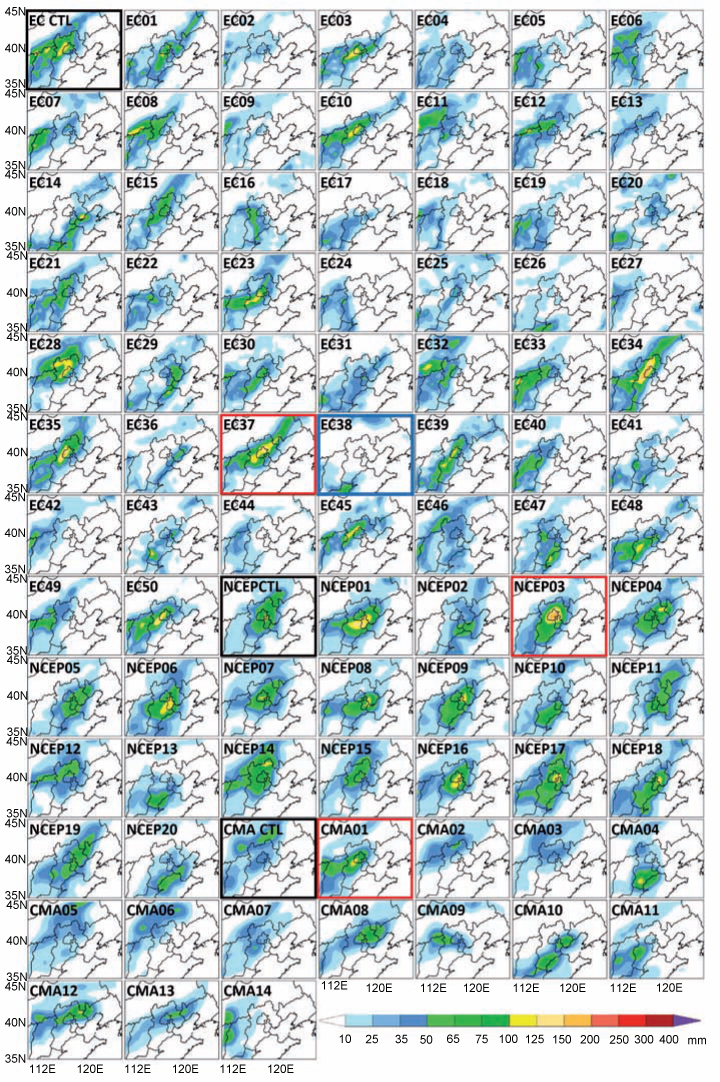
Fig. 3
The distributions of 24-h rainfall control and ensemble forecasts from ECMWF, NCEP and CMA. Three good members (EC37, NCEP03 and CMA01) are marked by red boxes and one bad member (EC38) is marked by a blue box. The deterministic control forecasts of the three centres are marked by black boxes.
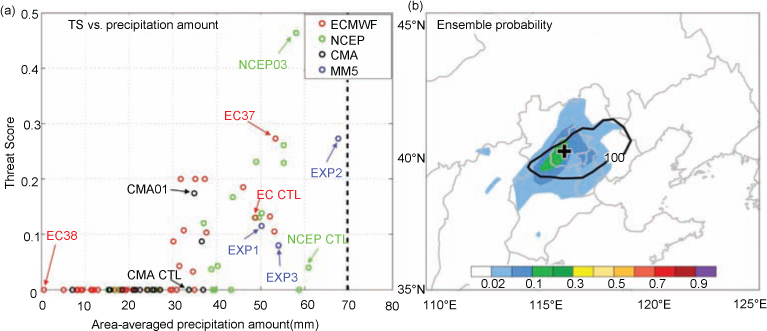
Fig. 4
(a) Domain-averaged rainfall vs. TS scatterplot. The TS was calculated within the D03 (shown in Fig. 1a) at a threshold of 100-mm rainfall in 24 h (0000 UTC 21 July to 0000 UTC 22 July 2012). The corresponding results of the control forecast from each centre and EXP1–3 are also plotted. The dashed black line represents the observed domain-averaged rainfall. (b) The observed (contour) and ensemble probability (shaded) of 100-mm 24-h rainfall. The black cross in (b) represents the location of the Beijing metropolitan area.
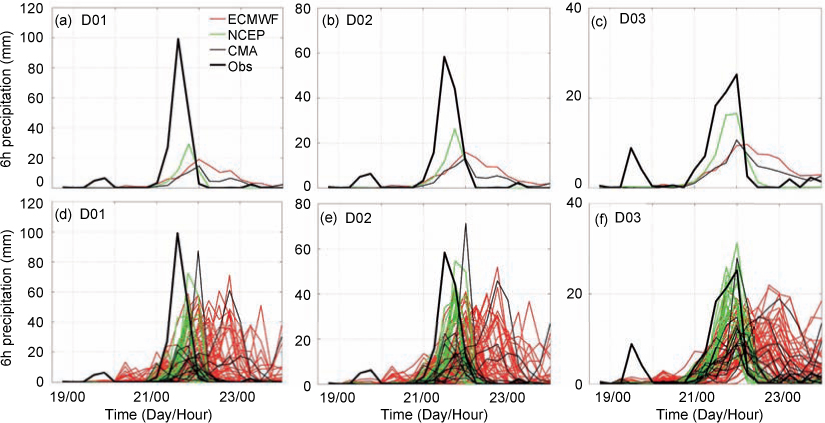
Fig. 5
The evolution of 6-h domain-averaged rainfall forecast over D01 (a and d), D02 (b and e) and D03 (c and f) from the ensemble mean (a–c) and individual ensemble member (d–f) of ECMWF (red), NCEP (green) and CMA (black). The heavy black line in each panel denotes the corresponding observations.
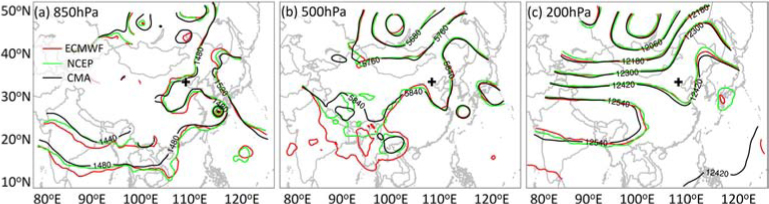
Fig. 6
The ensemble mean of the geopotential height from ECMWF (red), NCEP (green) and CMA (black) at 0000 UTC 18 July 2012 at (a) 850 hPa, (b) 500 hPa and (c) 200 hPa. The black cross in each panel represents the location of the Beijing metropolitan area.
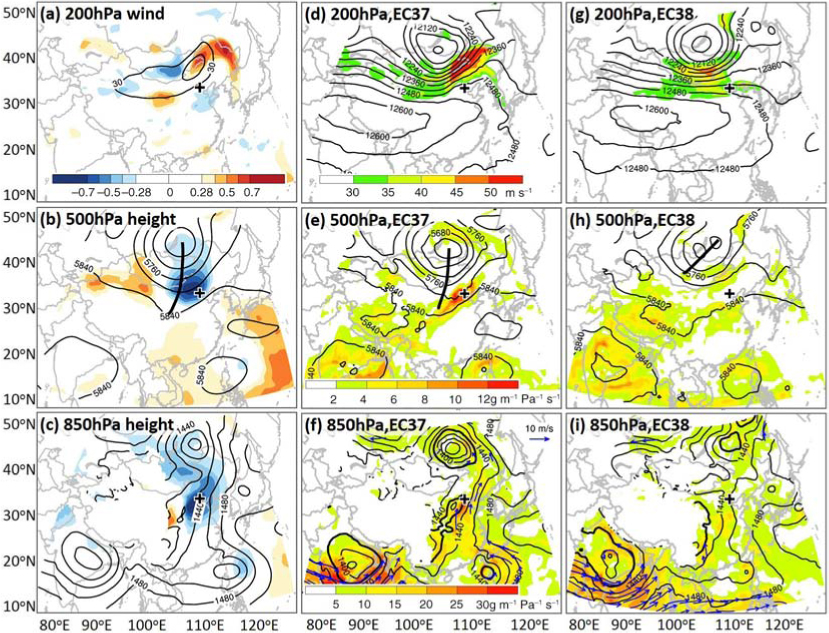
Fig. 7
The correlation coefficient (shaded) between the D03-averaged 24-h rainfall (0000 UTC 21 July to 0000 UTC 22 July 2012) and (a) 200-hPa wind speed, (b) 500-hPa geopotential height and (c) 850-hPa geopotential height at 1200 UTC 21 July 2012. The contours in each panel denote the ensemble mean: (a) 200-hPa wind speed larger than 30 m s−1 (every 10 m s−1), (b) 500-hPa geopotential height (every 40 gpm) and (c) 850-hPa geopotential height (every 20 gpm). Also given are the forecasts of 200-hPa wind speed (shaded, m s−1) and geopotential height (contour, every 60 gpm), 500-hPa geopotential height (contour, every 40 gpm) and horizontal water vapour flux (shaded, g m−1 Pa−1 s−1), and 850-hPa geopotential height (contour, every 20 gpm), horizontal water vapour flux (shaded, g m−1 Pa−1 s−1) and wind vectors with a speed larger than 10 ms−1 at 1200 UTC 21 July 2012 of (d–f) EC37 (good) and (g–i) EC38 (bad). The black cross in each panel represents the location of the Beijing metropolitan area.
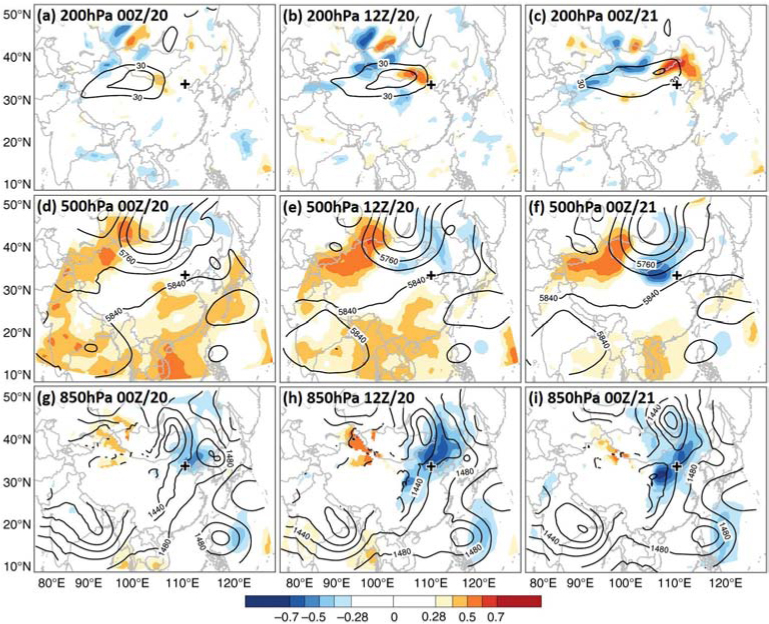
Fig. 8
The correlation coefficient (shaded) between the D03-averaged 24-h rainfall (0000 UTC 21 July to 0000 UTC 22 July 2012) and (a–c) 200-hPa wind speed, (d–f) 500-hPa geopotential height and (g–i) 850-hPa geopotential height at (a, d, g) 0000 UTC 20 July, (b, e, h) 1200 UTC 20 July and (c, f, i) 0000 UTC 21 July 2012. The contours in each panel denote the ensemble mean: (a–c) 200-hPa wind speed larger than 30 m s−1 (every 10 m s−1), (d–f) 500-hPa geopotential height (every 40 gpm) and (g–i) 850-hPa geopotential height (every 20 gpm). The black cross in each panel represents the location of the Beijing metropolitan area.

Fig. 9
The forecasts of (a) 45 ms−1 wind speed at 200 hPa, (b) 5760 gpm at 500 hPa and (c) 1400 gpm at 850 hPa at 1200 UTC 21 July from all ensemble members of ECMWF (red), NCEP (green) and CMA (black). Also shown are 5760 gpm at 500 hPa of the best five and worst five members from (d) ECMWF and (e) NCEP and (f) 1400 gpm at 850 hPa of the best five and worst five members from NCEP. The ‘low’ in (f) denotes the location of the low-level low-pressure system. The black cross in each panel represents the location of the Beijing metropolitan area.
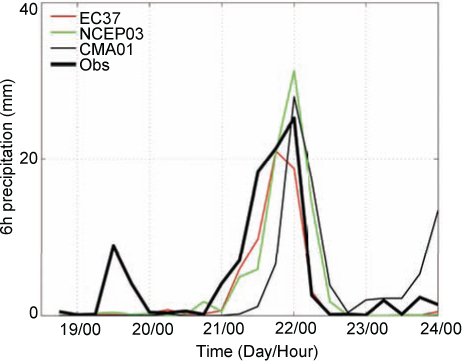
Fig. 10
Same as Fig. 5f but only for the members of EC37, NCEP03 and CMA01 and the observation.
Table 1. The TS and magnitude of 24-h rainfall of good members from ECMWF, NCEP and CMA
NCEP030.4658.05EC370.2753.34CMA010.1734.83
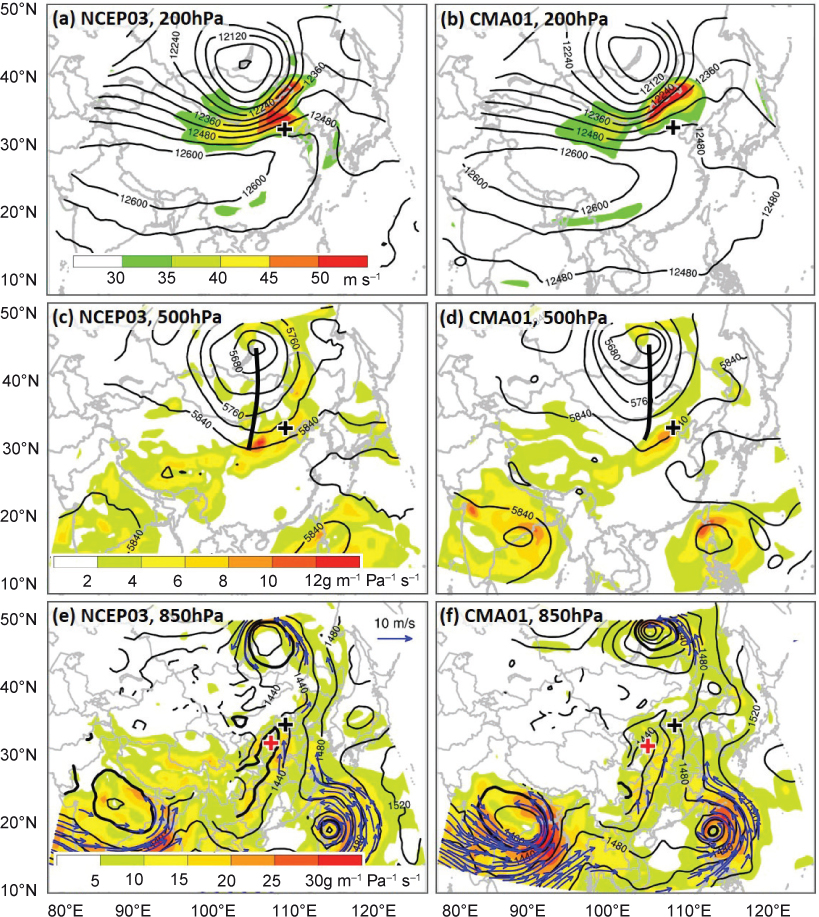
Fig. 11
The forecasts from good members of NCEP03 (left panels) and CMA01 (right panels) at 1200 UTC July 2012, corresponding to forecast hour 84, of (a and b) 200-hPa wind speed (shaded, m s−1) and geopotential height (contour, every 60 gpm), (c and d) 500-hPa geopotential height (contour, every 40 gpm) and horizontal water vapour flux (shaded, g m−1 Pa−1 s−1) with the thick black line representing the trough axis, and (e and f) 850-hPa geopotential height (black contour, every 20 gpm), horizontal water vapour flux (shaded, g m−1 Pa−1 s−1) and wind vectors with a speed larger than 10 m s−1. The red cross in (e) and (f) represents the location of the low-pressure centre. The black cross in each panel represents the location of the Beijing metropolitan area.

Fig. 12
The forecasts of CAPE (shaded, J kg−1), geopotential height at 500 hPa (black contour, every 40 gpm), as well as 1420 gpm (blue contour), wind vectors with their speed larger than 12 m s−1 and divergence at 850 hPa (red contour, s−1) from (a) EC37 (the good member) and (b) EC38 (the bad member). The solid line represents divergence and the dashed line represents convergence. The black cross represents the location of the Beijing metropolitan area.
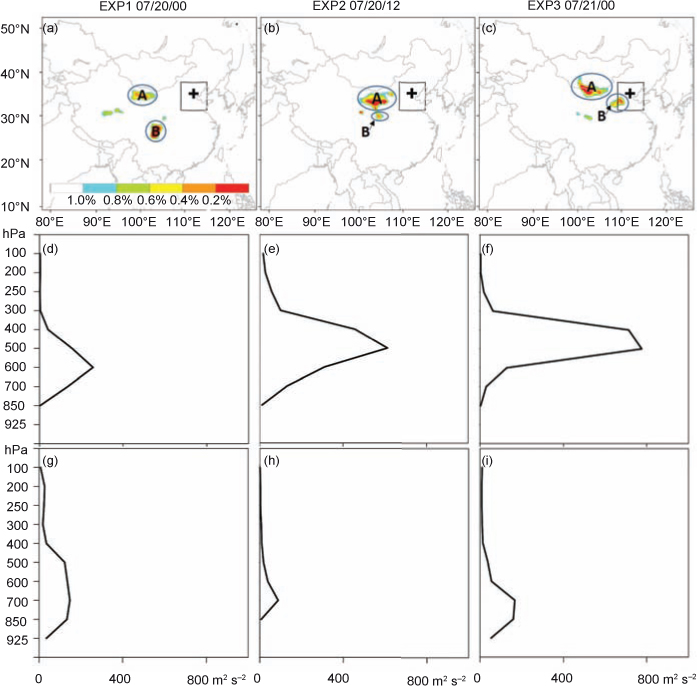
Fig. 13
The targeted area (TDE′, shaded) identified by the CNOP method for (a) EXP1, (b) EXP2 and (c) EXP3. The inner box in (a–c) denotes the verification area. The black cross in (a–c) represents the location of the Beijing metropolitan area. Also shown were the vertical distributions of the horizontal integrated TDE′ in the corresponding area A (d–f) and B (g–i).

Fig. 14
24-h accumulated rainfall (shaded, mm) from 000 UTC 21 July to 0000 UTC 22 July forecasted by (a) EXP1, (b) EXP2 and (c) EXP3. The inner box denotes the verification area.
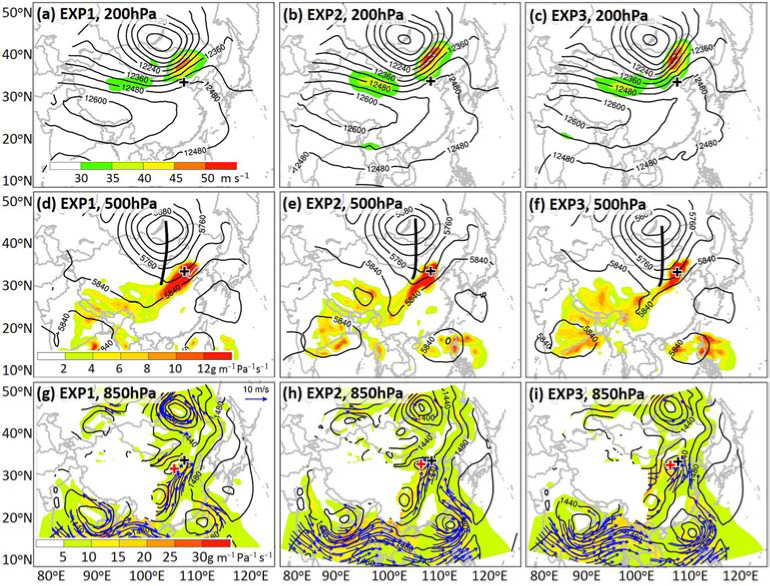
Fig. 15
The forecasts of EXP1 (left panels), EXP2 (middle panels) and EXP3 (right panels) at 1200 UTC July 2012 of (a and b) 200-hPa wind speed (shaded, m s−1) and geopotential height (contour, every 60 gpm), (c and d) 500-hPa geopotential height (contour, every 40 gpm) and horizontal water vapour flux (shaded, g m−1 Pa−1 s−1) with the thick black line representing the trough axis, and (e and f) 850-hPa geopotential height (black contour, every 20 gpm), horizontal water vapour flux (shaded, g m−1 Pa−1 s−1), and wind vectors with a speed larger than 10 m s−1. The red crosses in (g–i) represent the location of the low-pressure centre. The black cross in each panel represents the location of the Beijing metropolitan area.
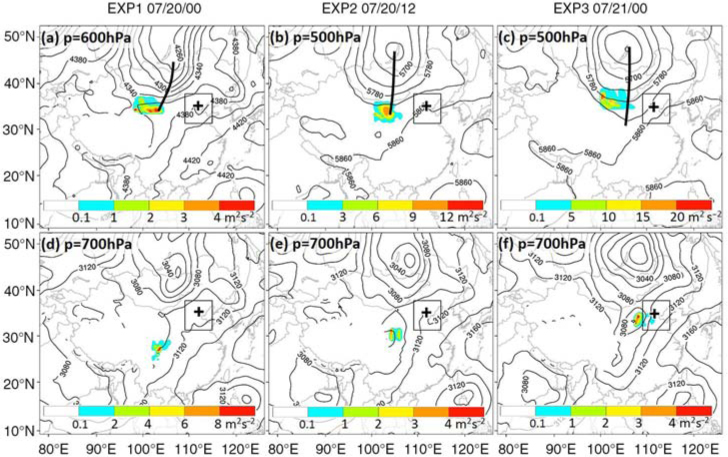
Fig. 16
The targeted area (TDE′, shaded, m2 s−2) identified by CNOP at (a) 600 hPa and (d) 700 hPa for EXP1, (b) 500 hPa and (e) 700 hPa for EXP2, and (c) 500 hPa and (f) 700 hPa for EXP3 and the geopotential height (contour, gpm) at the corresponding levels at their respective observation times. The thick black line represents the trough axis. The inner box in each panel denotes the verification area. The black cross represents the location of the Beijing metropolitan area.