
Table 1. Summary of the experiments G1 and G2 performed for the evaluation of Mescan precipitation analysis system over the French territory
G1– ALADIN forecasts at 5.5 km (native forecasts)σo=5 mm, σb=13 mm, and L=35 km– Downscaled ALADIN forecasts from 9.5 to 5.5 kmidemG2– AROME forecasts at 2.5 km (native forecasts)idem– Downscaled ARPEGE forecasts from 10 to 2.5 kmidemEURO4M re-analyses– Downscaled HIRLAM forecasts from 22 to 5.5 kmidem
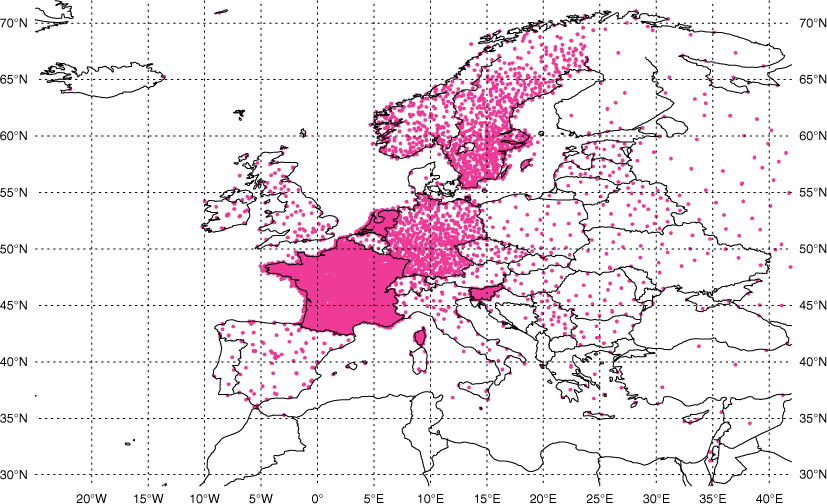
Fig. 1
EURO4M re-analysis domain and the spatial distribution of the 24-h precipitation observation network.
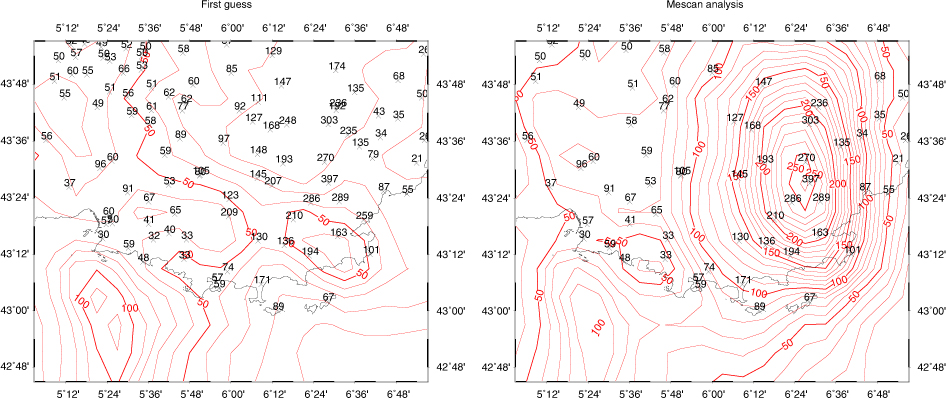
Fig. 2
Maps of 24-h accumulated precipitation over the south-eastern France, valid at 0600 UTC 16 June 2010, for background (left panel) and Mescan analysis (right panel) with overlapped observations. Isohyets every 10 mm/24 h drawn for the background and analysis fields. Units mm/24 h.
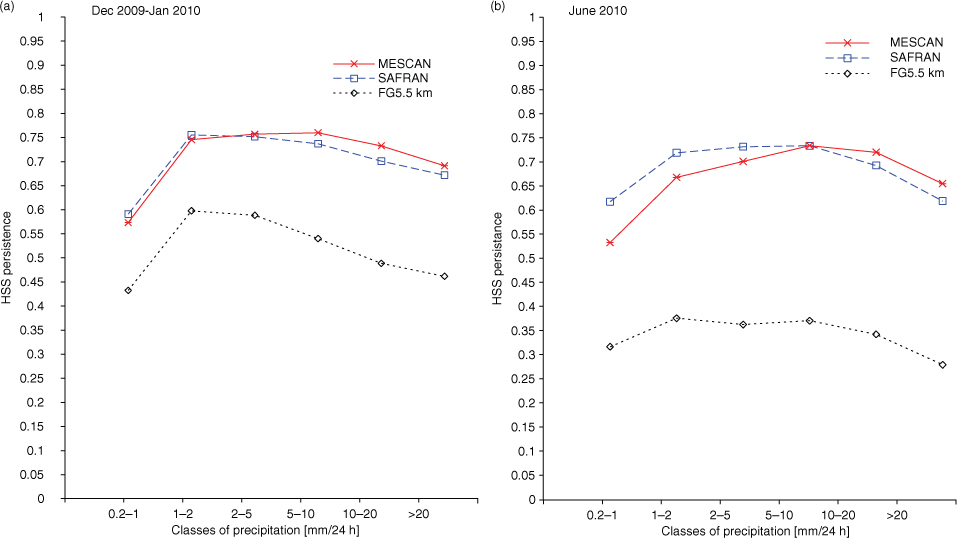
Fig. 3
Monthly Heidke Skill Score against persistence computed as a function of classes of precipitation for (a) December 2009–January 2010, and (b) June 2010. Background (black dotted line), SAFRAN (blue dashed line) and Mescan (red solid line), respectively.
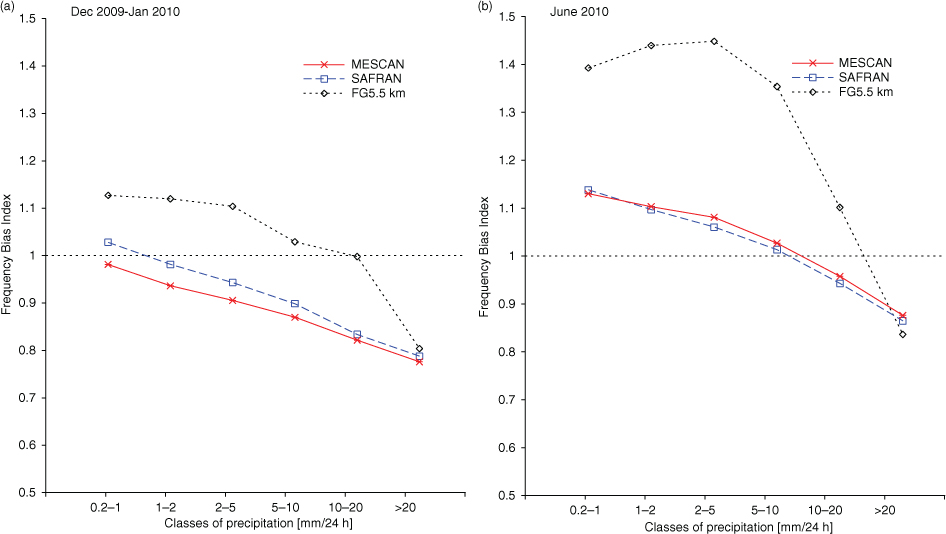
Fig. 4
Monthly Frequency Bias Index computed as a function of classes of precipitation for (a) December 2009–January 2010, and (b) June 2010. Background (black dotted line), SAFRAN (blue dashed line) and Mescan (red solid line), respectively.
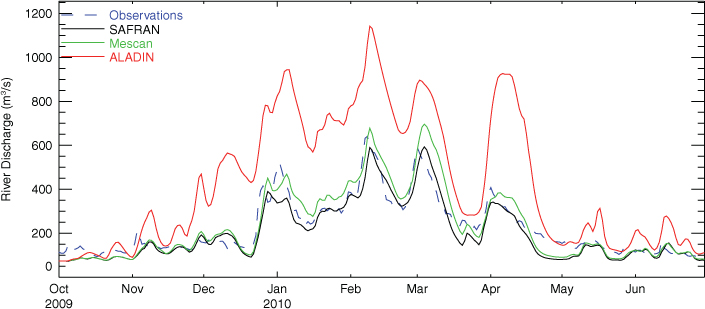
Fig. 5
Comparison of the time series (October 2009–June 2010) of daily river discharge for the Seine River at Paris-Austerlitz hydrological station.
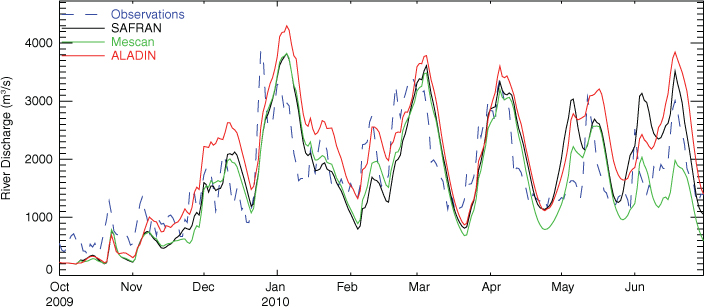
Fig. 6
Comparison of the time series (October 2009–June 2010) of daily river discharge for the Rhône River at Beaucaire hydrological station.
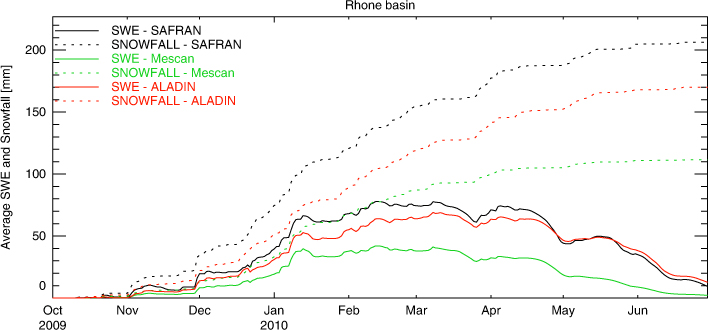
Fig. 7
Comparison of the average accumulated snow water equivalent and snowfall over the Rhône River watershed for the period October 2009–June 2010.
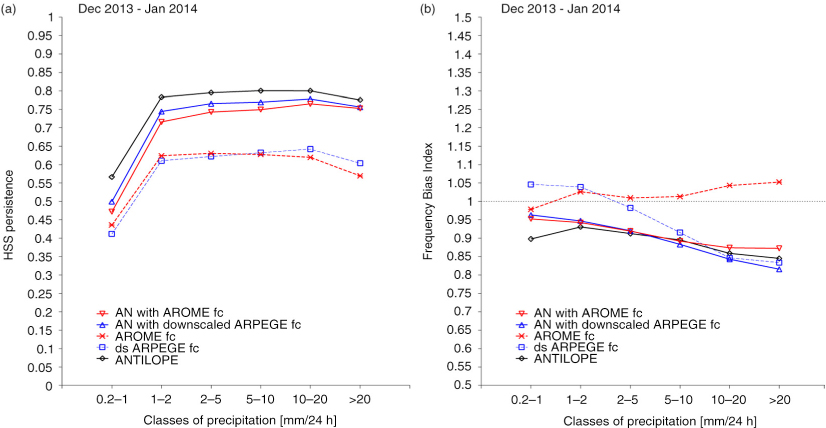
Fig. 8
(a) HSS against persistence and (b) FBI as a function of classes of 24-h accumulated precipitation for December 2013–January 2014 for background fields from AROME forecasts (red dashed line) and downscaled ARPEGE forecasts (blue dashed line), ANTILOPE analyses (black solid line), analyses with AROME background (red solid line), analyses with downscaled ARPEGE forecast (blue solid line), respectively.
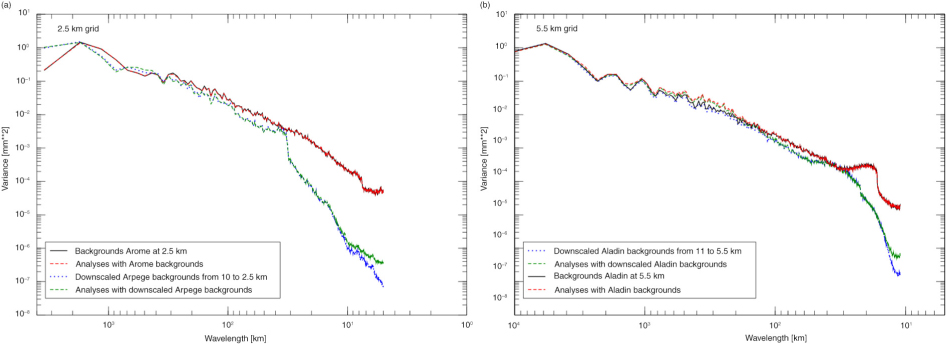
Fig. 9
The variance spectra of the monthly mean 24-h total accumulated precipitation as a function of wavelength computed on (a) AROME-France domain at 2.5 km grid (for January 2014), and (b) a domain for running ALADIN model at 5.5 km grid covering Europe (for December 2009). The blue dotted lines stand for the downscaled forecast fields, the green dashed lines for the analyses performed with downscaled fields, the black solid lines for native forecasts at 2.5 km (5.5 km) grid and the red dashed lines correspond to the analyses performed with backgrounds from native forecasts. Note that the scales of the abscissa differ in (a) and (b).
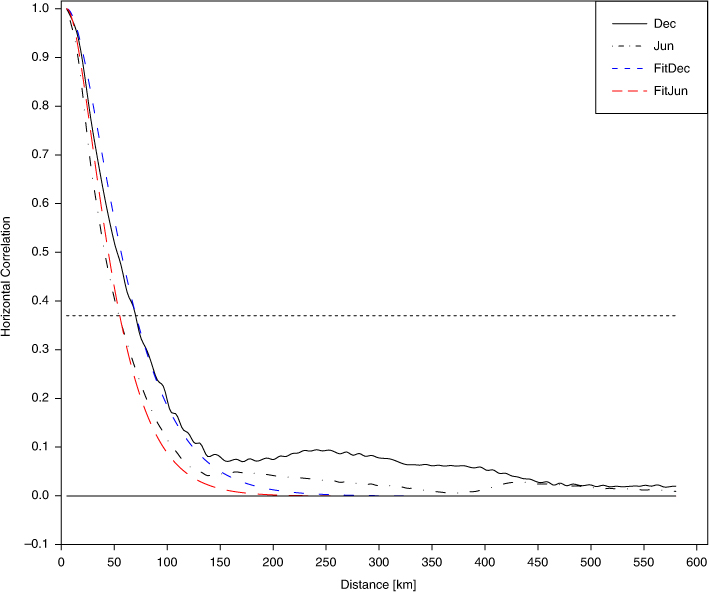
Fig. 10
Horizontal correlation lengths for precipitation determined in ALADIN-France domain with the ‘NMC method’ for December 2009 (black solid line) and June (black dashed-dotted line). The best fit for December (blue short-dashed line) and for June (red long-dashed line) are derived with L=32 km and L=24 km respectively. The horizontal dotted line depicts c−1.
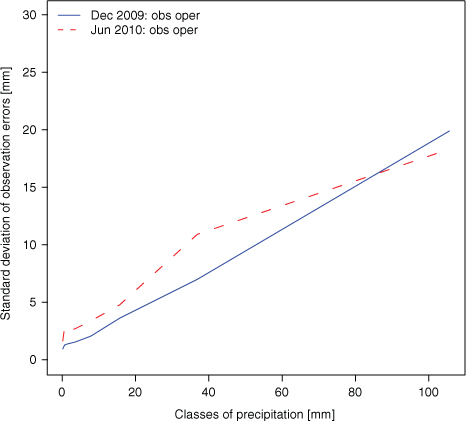
Fig. 11
Standard deviation of observation errors as a function of classes of 24-h accumulated precipitation amount in the observation space for December 2009 (blue solid line) and for June 2010 (red dashed line).
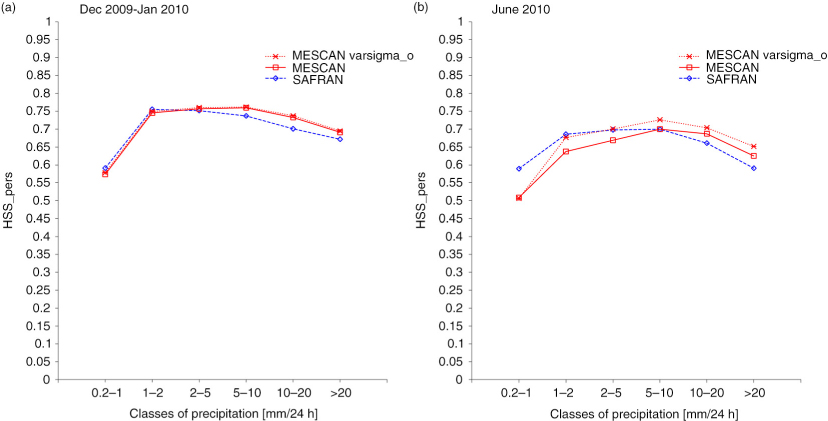
Fig. 12
Monthly Heidke Skill Score against persistence computed as a function of classes of precipitation for (a) December 2009–January 2010, and (b) June 2010. SAFRAN (blue dashed line), Mescan (red solid line) with constant σ o , and Mescan with variable σ o (red dotted line), respectively.
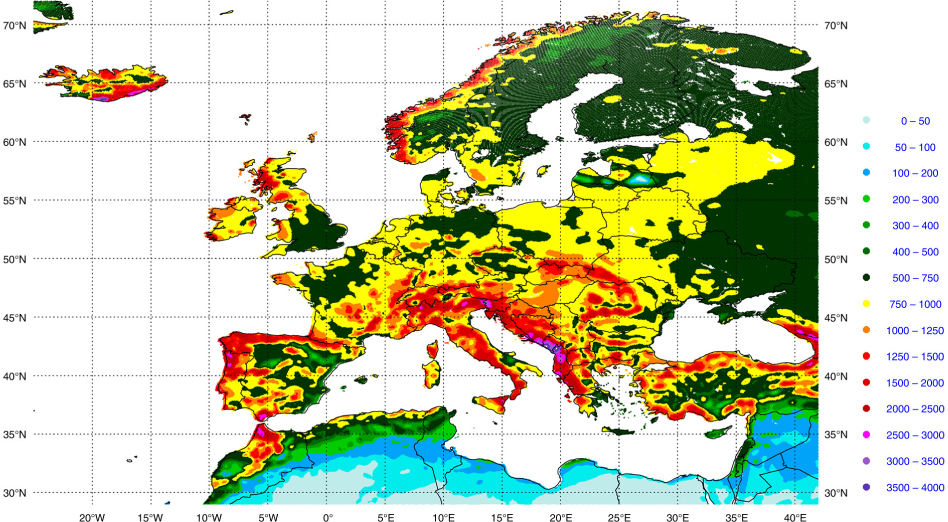
Fig. 13
Map of annual precipitation amount from 24-h precipitation analyses for the year 2010. Units mm/year.
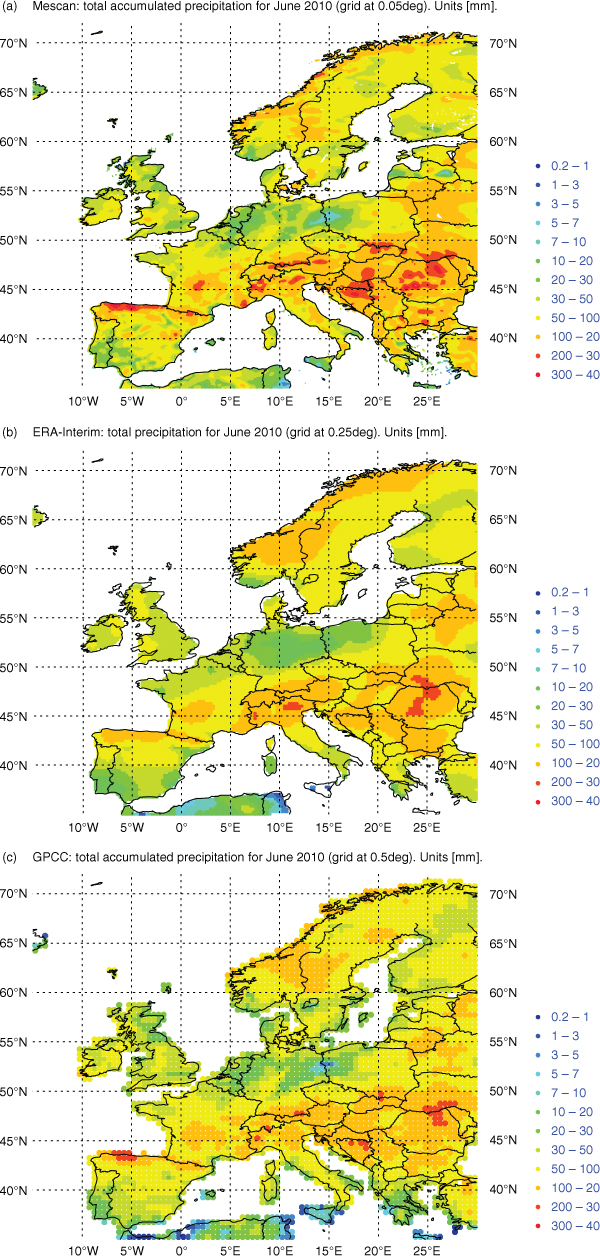
Fig. 14
Maps of the monthly 24-h accumulated precipitation for June 2010 for Mescan (left panel) at 5.5 km, ERA-Interim at 25 km (middle panel) and GPCC (right panel) at 50 km grid spacing, respectively. Units mm/month.
4D-VarFour-dimensional variational data assimilationALADINAire Limitée Adaptation Dynamique Développement InternationalANTILOPEANalyse par spaTIaLisation hOraire des PrEcipitationsAROMEApplication of Research to Operations at MesoscaleARPEGEAction de Recherche Petite Echelle Grande EchelleleECA&DEuropean Climate Assessment and DatasetECMWFThe European Centre for Medium-Range Weather ForecastsEUMETNETA group of European National Meteorological ServicesEURO4MEuropean Reanalysis and Observations for MonitoringFG5.5First Guess at 5.5 km gridFBIFrequency Bias IndexGPCCGlobal Precipitation Climatology CentreGTSGlobal Telecommunication SystemHIRLAMHigh Resolution Local Area ModellingHSSHeidke Skill ScoreISBAInteraction Sol–Biosphère–AtmosphéreJMAJapan Meteorological AgencyMODCOUMODélisation COUpléeNCEPNational Centers for Environmental PredictionNCARNational Center for Atmospheric ResearchNMCNational Meteorological Center now called NCEPOPERAOperational Programme for the Exchange of Weather Radar InformationSAFRANSystème d'Analyse Fournissant des Renseignements Atmosphériques à la NeigeSMHISwedish Meteorological and Hydrological InstituteSWESnow Water Equivalent