
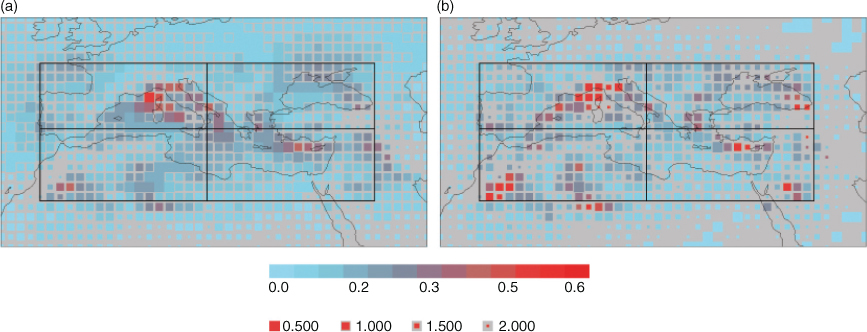
Fig. 1
Cyclone tracks and cyclogenesis in the Mediterranean region. (a) Track density according to the multi-methods mean. Colours represent the probability (%) that a cyclone track crosses each 1.5°×1.5° cell of the domain in the 6-hourly field (values according to the label bar below the panels). (b) Probability (%) that cyclogenesis occurs in each cell in the 6-hourly field. In both panels, only cyclones whose track crosses the Mediterranean region are considered. The filled fraction of each cell corresponds to the level of agreement (given by the normalised standard deviation) among methods as annotated below the panels. The large rectangle denotes the Mediterranean region with its subdivision in four sectors.
Table 1. List of cyclone detecting and tracking methods used in this study with code number in the IMILAST dataset, used variable, adopted metric for cyclone intensity and main bibliographic reference for the description of each method
M02MSLPMSLP minMurray and Simmonds (1991), Pinto et al. (2005)M06MSLP, VORT, thermal and wind fields at 1 km altitudeMSLP min1997), Hewson and Titley (2010) M07Vorticity 850 hPaZ850 max rel vorticityFlaounas et al. (2014)M08MSLPMSLP min2006)M09MSLPMSLP min1995), Wang et al. (2006)M10MSLPMSLP min1991), Simmonds et al. (2008)M12MSLPMSLP min2002), Rudeva and Gulev (2007)M14Z850Z850 max amplitudeKew et al. (2010)M15Z1000Z1000 min1997), Raible et al. (2008)M16MSLPMSLP min2002), Reale and Lionello (2013)M18Vorticity 850 hPa, MSLPMSLP min1994, Sinclair (1997)M20MSLPMSLP min2006)M21Vorticity 850 hPaZ850 max rel vorticity2009)M22MSLPMSLP min2005), Akperov et al. (2007)
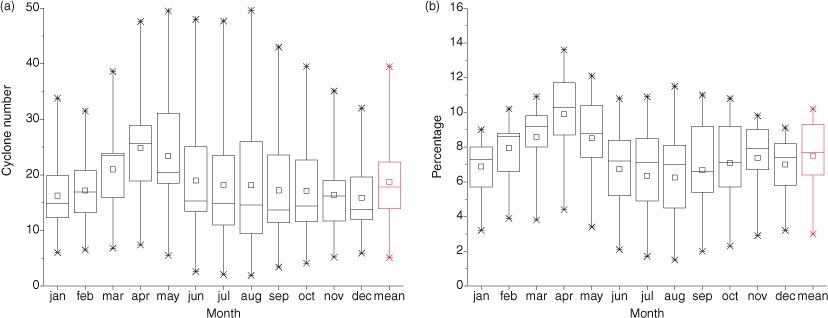
Fig. 2
Inter-monthly variation of (a) total number of Mediterranean cyclones and (b) relative frequency of NH cyclones crossing the Mediterranean region illustrated by box plots. Both panels show the annual cycle (calendar months on the x-axis) and the monthly mean value in red. The minimum and maximum values among CDTMs are denoted with×–. The upper and lower limits of the boxes correspond to 25th and 75th percentiles. The central bar denotes the median and the square the MCDTMmean.
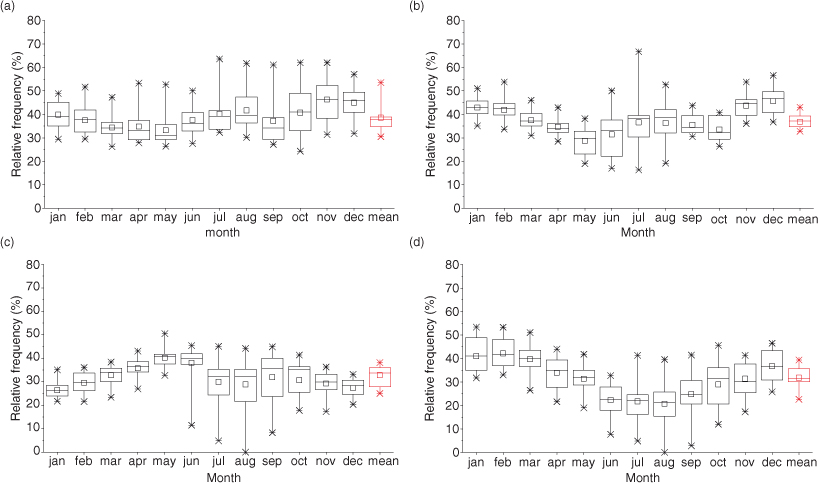
Fig. 3
Relative frequency of cyclones in the four sectors (Fig. 1) illustrated by box plots: (a) NW, (b) NE, (c) SW, (d) SE. Panels show the annual cycle (calendar months on the x-axis) and the annual average (the rightmost value marked in red). Values represent the percentage of cyclones crossing each sector with respect to the total number crossing the MR. The minimum and maximum values among CDTMs are denoted with×–. The upper and lower limits of the boxes correspond to the 25th and 75th percentiles. The central bar denotes the median and the square the MCDTMmean.
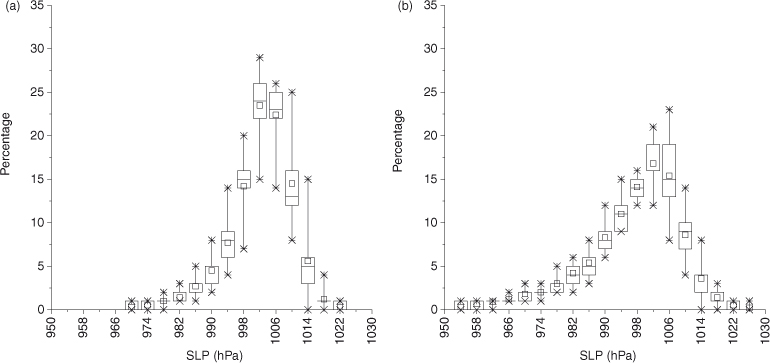
Fig. 4
Relative frequency (%) of cyclones as function of their lifetime MSLP minimum considering 4 hPa wide bins and covering the range from 930 to 1030 hPa illustrated by box plots: (a) Mediterranean cyclones and (b) the NH cyclones. The minimum and maximum values among CDTMs are denoted with×–, the upper and lower limits correspond to 25th and 75th percentiles, and the central bar denotes the median and the square the MCDTMmean.
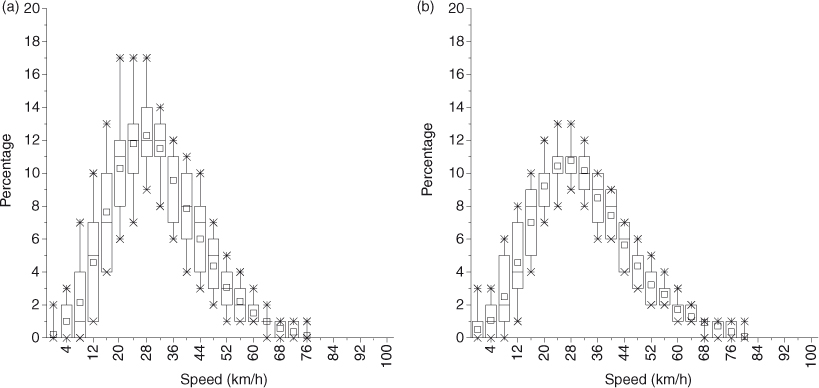
Fig. 5
Same as Fig. 4 except it shows the relative frequency (%) of cyclones as function of their average speed in 4 km/h wide bins covering the range from 0 to 100 km/hour.
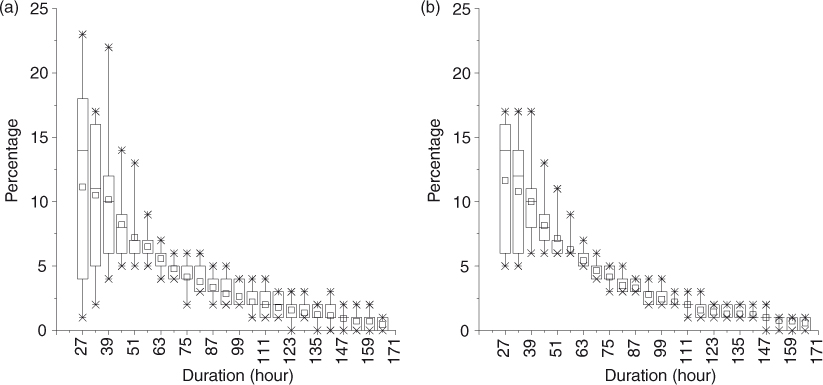
Fig. 6
Same as Fig. 4 except it shows the relative frequency (%) of cyclones as function of their duration in 6-hour wide bins covering the range from 24 to 174 hours.
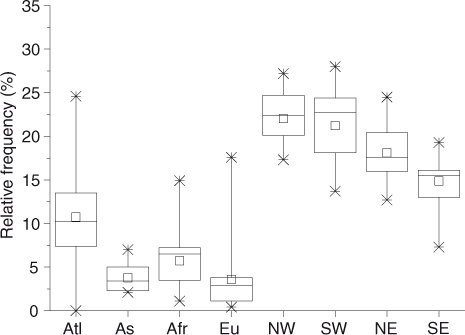
Fig. 7
Relative frequency (%) of cyclogenesis occurring in the four sectors marked in Fig. 1 (NW, NE, SW, SE) and outside of the MR: Atlantic (Atl), Asia (As), Africa(Afr), Europe (Eu). The minimum and maximum values among CDTMs are denoted with×–, the upper and lower limits correspond to 25th and 75th percentiles, and the central bar denotes the median and the square the MCDTMmean.
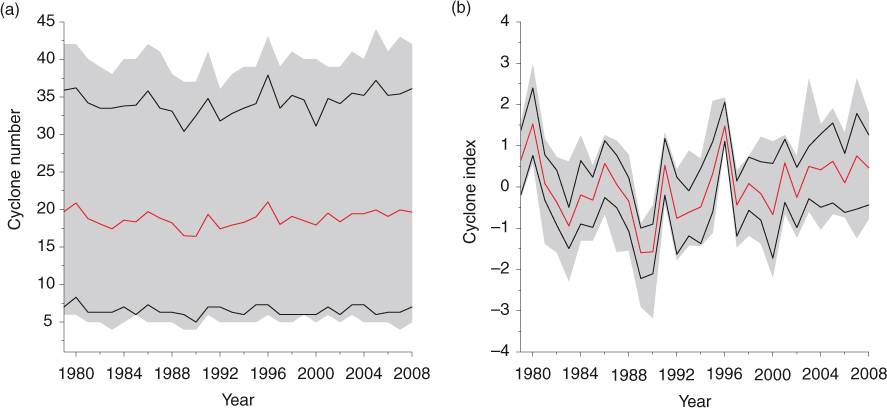
Fig. 8
(a) Time series of total annual cyclone number and (b) normalised cyclone number index (see text for details). The central red line shows the MTCMmean, the lower and upper black lines show the 10th and 90th percentiles of the CDTM results, and the whole grey area corresponds to the spread of all data.
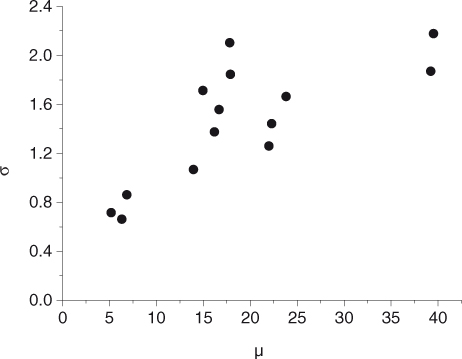
Fig. 9
Standard deviation σ (y-axis) as function of the mean monthly number µ (x-axis) for annual number of cyclones crossing the MR for the 14 CDTMs considered in this study.
Table 2. Method (first column), the mean monthly number of cyclones crossing the MR (µ, second column) and its standard deviation (σ, third column) as used for the computation of the cyclone index (Fig. 8b)
M0217.82.112M0639.21.95M076.30.710M0816.71.69M0939.52.26M105.20.714M1222.31.46M1414.01.18M1515.01.711M1622.01.36M1817.91.810M2023.81.77M216.90.913M2216.21.48
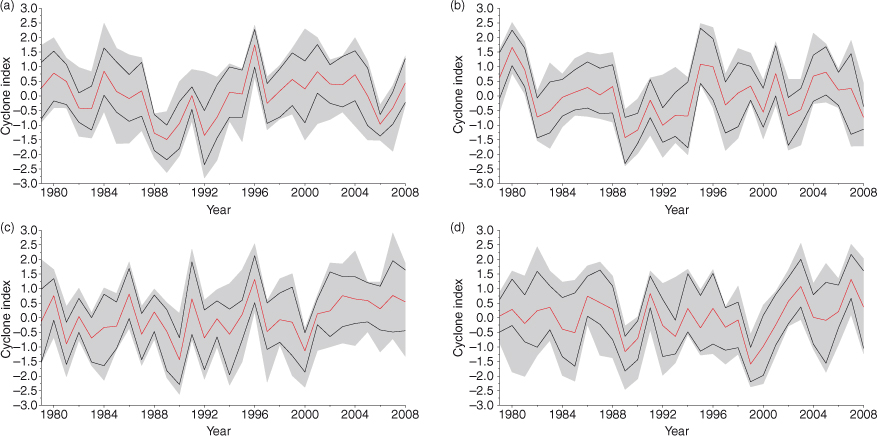
Fig. 10
Time series of cyclone number index for the four sectors of the Mediterranean region. (a) NW, (b) NE, (c) SW and (d) SW. The central red line shows the MTCMmean, the lower and upper black lines show the 10th and 90th percentiles of the CDTM results, and the whole grey area corresponds to the spread of the data.
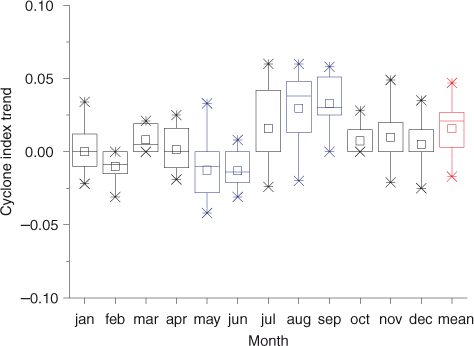
Fig. 11
Annual cycle of trends of cyclone number index. The red symbol on the right of the panels denotes the trend of the mean monthly cyclone number. Blue symbols (May, June, August, September) denote months where at least 25 % of CDTMs present statistically significant trends with the same sign.
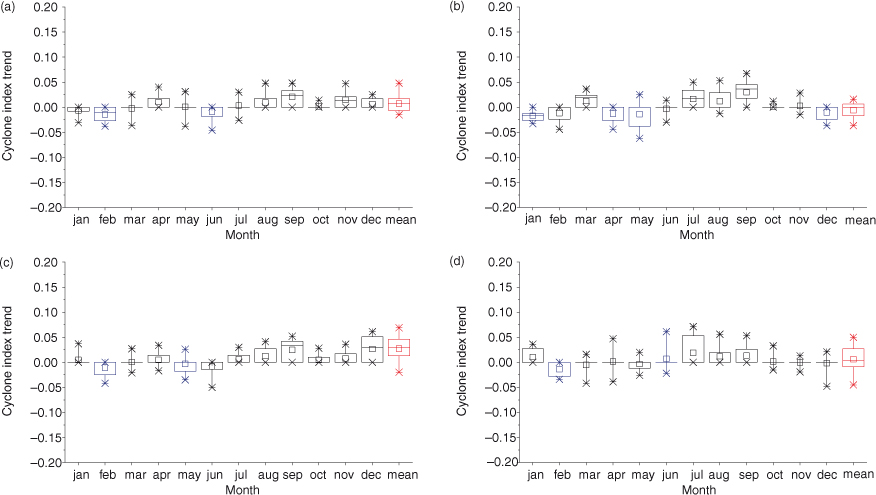
Fig. 12
Trends of the cyclone number index for the four sectors of the Mediterranean region. (a) NW, (b) NE, (c) SW, (d) SW. The red symbol on the right of the panels denotes the trend of the mean monthly cyclone number. Blue symbols denote months where at least 25% of CDTMs present statistically significant trends with the same sign.
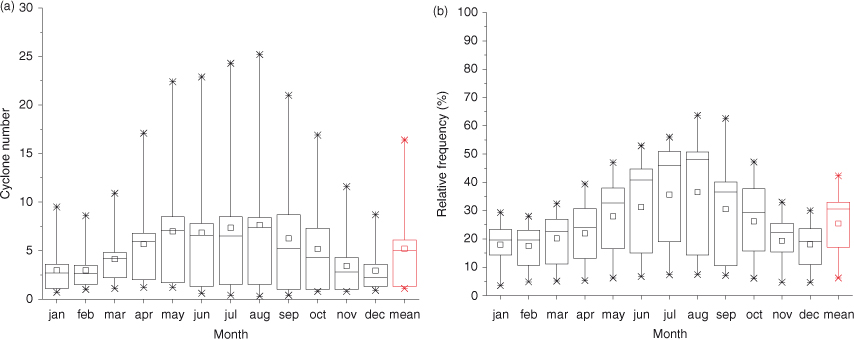
Fig. 13
Inter-monthly variation of total number and relative frequency of ‘weak’ cyclones in the Mediterranean region: (a) annual cycle of the number of ‘weak’ cyclones crossing the Mediterranean region and (b) annual cycle of the percentage of ‘weak’ cyclones with respect to the total number of Mediterranean cyclones. Both panels show the annual cycle (calendar months on the x-axis) and its mean annual value in red on the right of the panels. In the panels, the minimum and maximum values among CDTMs are denoted with×–, the upper and lower limits of the boxes correspond to 25th and 75th percentiles, and the central bar denotes the median and the square the MCDTMmean.
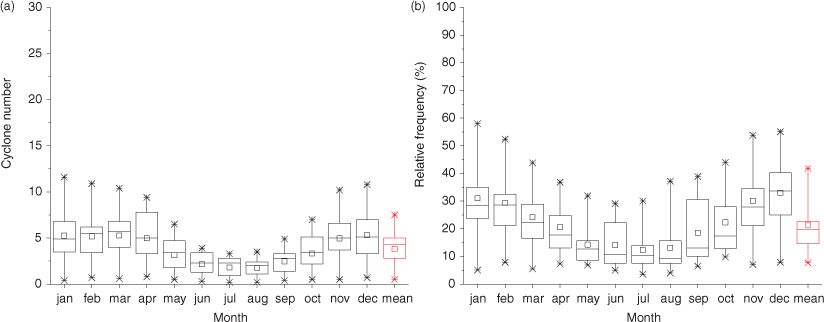
Fig. 14
Same as Fig. 13 except it shows ‘strong’ cyclones.
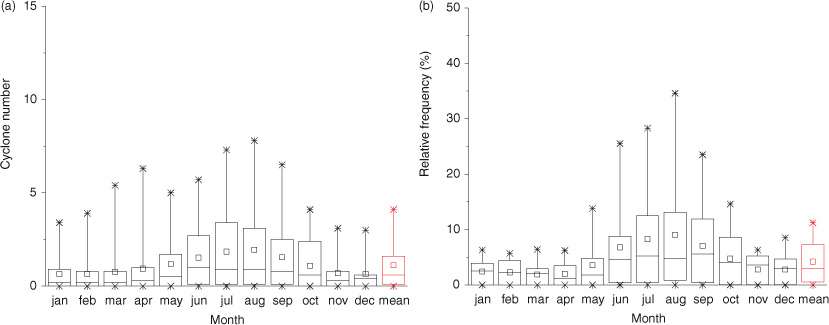
Fig. 15
Same as Fig. 13 except it shows ‘slow’ cyclones.
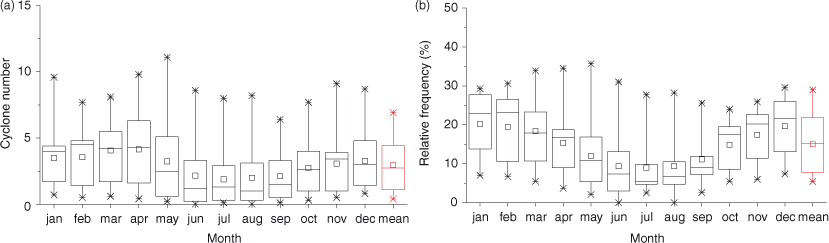
Fig. 16
Same as Fig. 13 except it shows ‘fast’ cyclones.
Table 3. Values of the ratio R [eq. (1)] between interannual variability of the MCDTMmean and its uncertainty
All cyclones: number0.01All cyclones: index1.15Weak cyclones: index0.18Strong cyclones: index1.17Slow cyclones: index0.17Fast cyclones: index0.46All but weak and slow cyclones: index1.40
[i] First line considers the actual number of cyclones. Following lines consider the index compute for different groups: all cyclones (second line) and for the four groups (‘weak’, ‘strong’, ‘slow’, ‘fast’ in lines 3–6) described in Section 4. The last line considers the index computed excluding ‘weak’ and ‘slow’ cyclones.
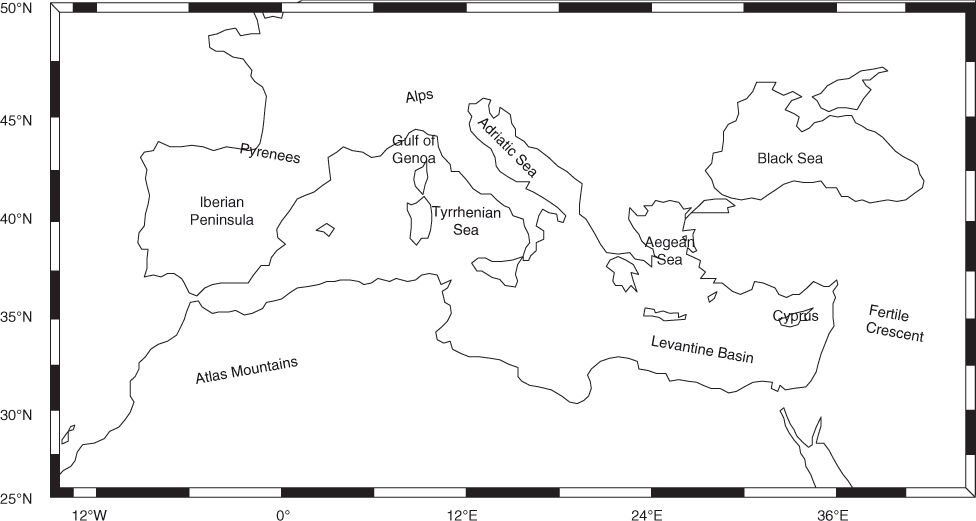
Fig. A.1.
Geography of the Mediterranean region with geographical names used in this article.
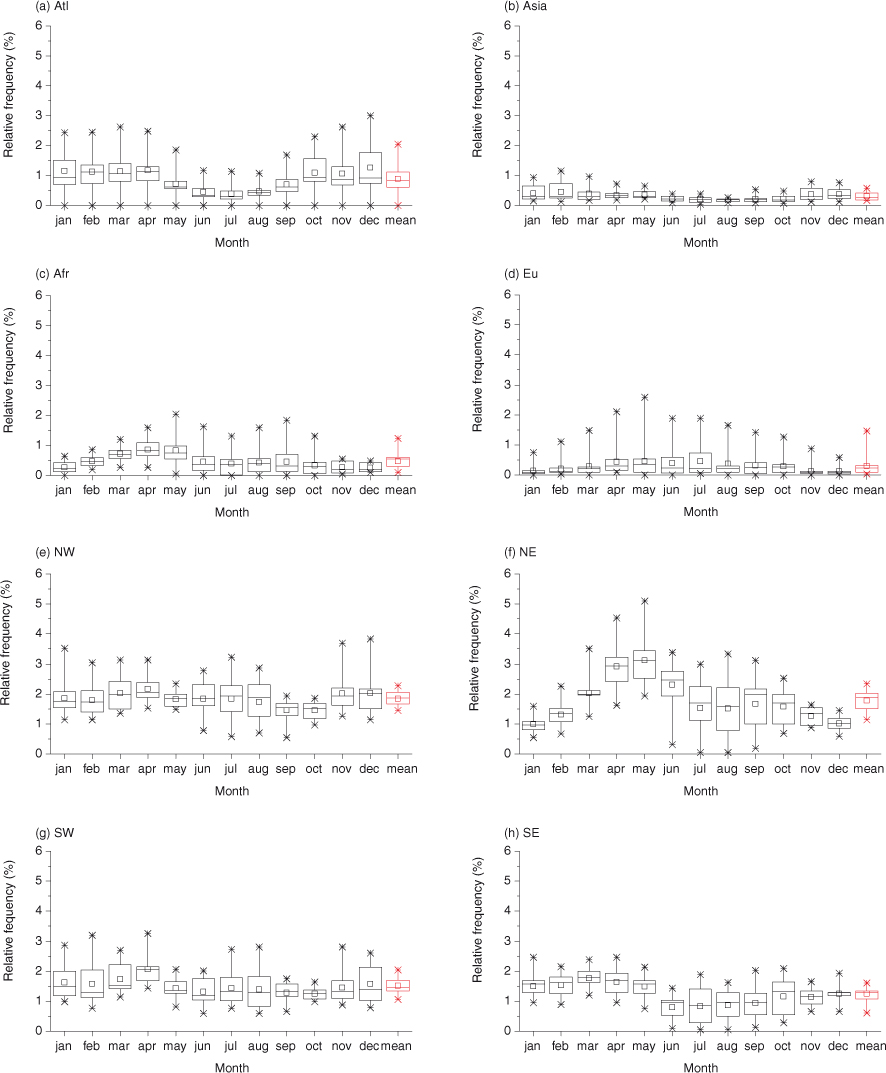
Fig. A.2.
Annual cycle of relative frequency (%) of cyclones entering the MR from adjacent areas [(a) Atlantic, (b) Asia, (c) Africa, (d) Europe], and of cyclogenesis in the four sectors of the MR [(e) NW, (f) NE, (h) SW, (g) SE]. Values represent percentage with respect to the total annual average number of cyclones crossing the MR.
{ label needed for table-wrap[@id='T0004'] }
Table A.1. Results of the track-by-track comparison among CDTMs considering cyclones in the MR
M025910042775060634850604944496749M066638100645048623544484037386148M071781631007377506659746966655572M084259487110078685551576343606962M098555467675100796672737854737785M101278665772811005948646556624871M126649357162606710057545247516558M142969486259755269100466246575652M154561467760707657611005647566754M165748397065716958715610046586771M186045347251496846625145100446443M205547396360706155615457441006468M211969595566755267526866666010068M223960477065837265616173536764100
[i] The upper-right triangle of the matrix (red shading) shows the total number of cyclones (second row, grey marked) and the nominal percentage agreement (relative to the lower number of tracks produced by the two methods) when both methods detect a track at a similar place and time. The lower-left part of the matrix (blue shading) shows the number of cyclones (second column, grey marked) and the agreement when ‘weak and slow’ cyclones are excluded. Light and dark shading denote agreement larger than 50 % and 70 %, respectively.