
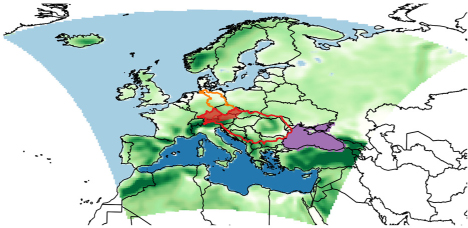
Fig. 1
Model domain, river catchments and regions where surface fluxes are switched off for the sensitivity experiments. Green: land areas (LANDOFF) with orography; dark blue: Mediterranean Sea (MEDOFF); purple: Black Sea (BLSEAOFF); light blue: North Atlantic Ocean (NAOFF). Red contour: Danube catchment; red shaded: Upper Danube catchment; orange contour: Elbe catchment.
Table 1. Summary of the analysed CCLM simulations
20 May 2013ControlYes052000 CTRL23 May 2013ControlYes052300 CTRL26 May 2013ControlYes052600 CTRL26 May 2013ControlNo052600 NoSN CTRL23 May 2013Sensitivity
no evaporation from the Mediterranean SeaYes052300 MEDOFF23 May 2013Sensitivity
no evaporation from the Black SeaYes052300 BLSEAOFF23 May 2013Sensitivity
no evaporation from the North Atlantic OceanYes052300 NAOFF23 May 2013Sensitivity
no evaporation from the continental areaYes052300 LANDOFF23 May 2013Sensitivity
evaporation decreased by 50 % in the continental areaYes052300 LANDOFF 50 %
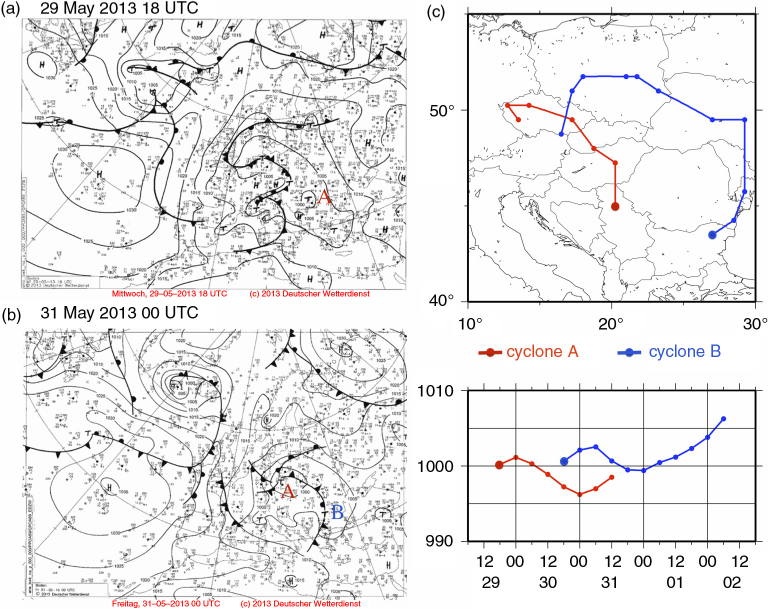
Fig. 2
Surface analyses from the German Weather Service (Deutsche Wetterdienst DWD, left) and cyclone tracks identified in ERA-Interim (right). (a) Surface analysis of DWD at 29 May 2013 18 UTC, and (b) at 31 May 2013 00 UTC. (c) Tracks and core pressure evolution of cyclone A and B.
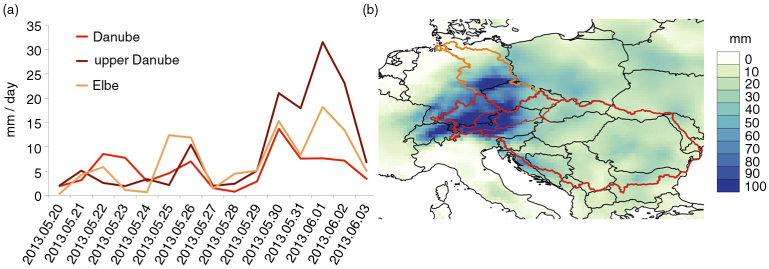
Fig. 3
Spatiotemporal distribution of the precipitation in E-OBS. (a) Time series of spatial mean daily precipitation totals [mm/day] in the Danube, the upper Danube and the Elbe catchment. (b) Four-day (30.05.2013–02.06.2013) accumulated precipitation [mm].
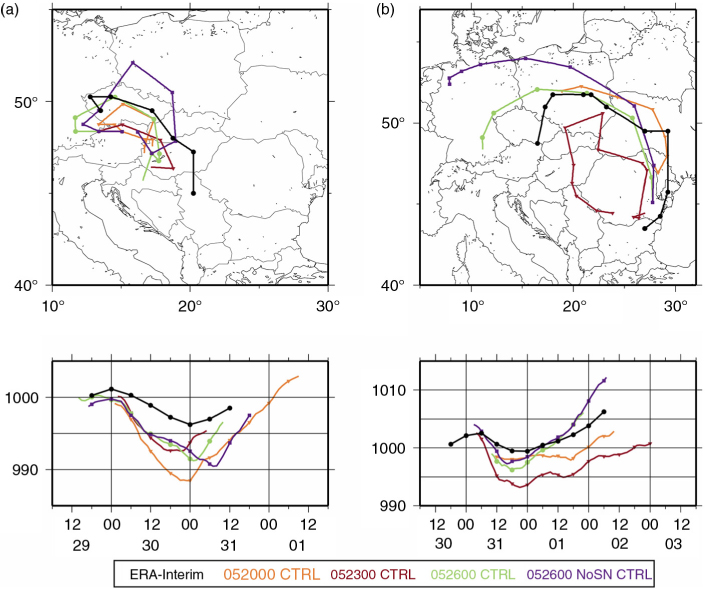
Fig. 4
Cyclone tracks and core pressure evolution in ERA-Interim reanalysis and in the CCLM control simulations; (a) cyclone A, (b) cyclone B.
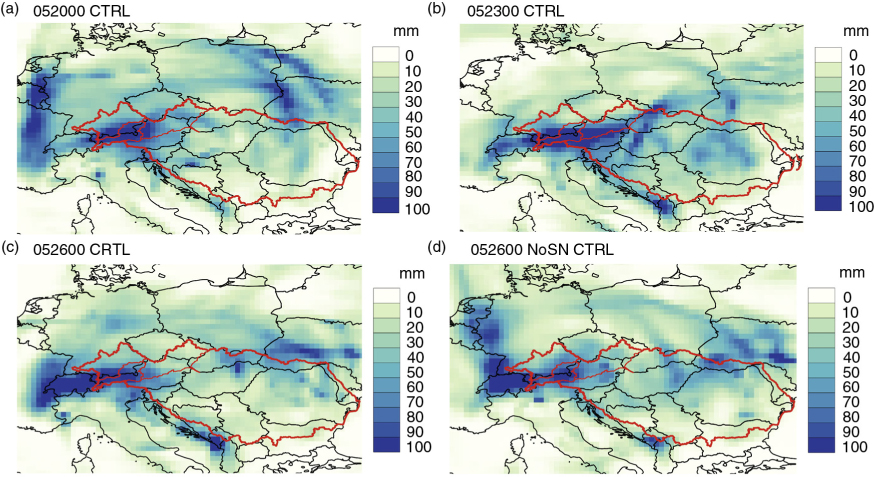
Fig. 5
Spatial distribution of 4-d (30.05.2013–02.06.2013) accumulated precipitation [mm] in the CCLM control simulations.
Table 2. The correlation and RMSE of daily total precipitation per river basin in the CCLM control simulations compared to E-OBS
CorrelationRMSECorrelationRMSECorrelationRMSE
052000 CTRL0.6913000.486490.17609052300 CTRL0.8210700.784650.29683052600 CTRL0.7412680.457570.62538052600 noSN CTRL0.8011290.338590.43636
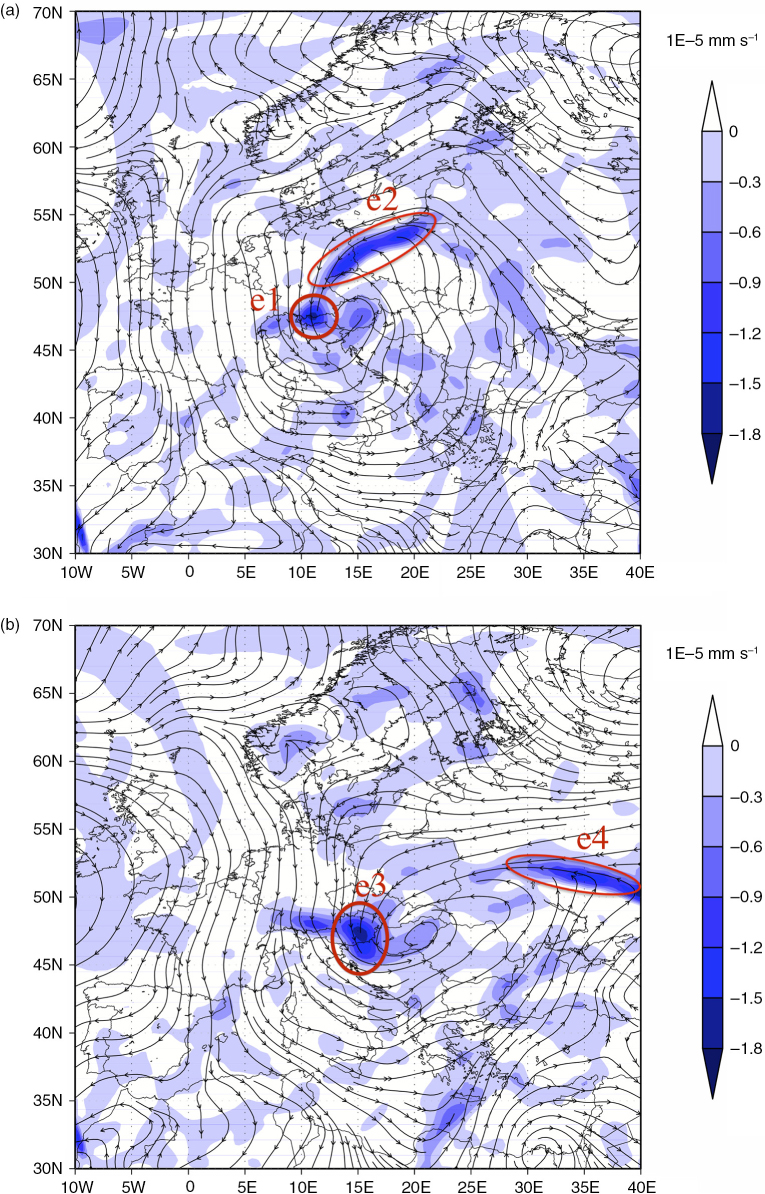
Fig. 6
Streamlines of vertically integrated (from surface up to 700 hPa) moisture flux (arrows) and moisture flux divergence (convergence: divQ<0) [mm s−1] (blue shading) in the 052300 CTRL simulation at (a) 31.05.2013 04UTC and (b) 02.06.2013 00UTC. Red ellipses in (a) and (b) denote moisture flux convergence zones (e1,e2,e3,e4).
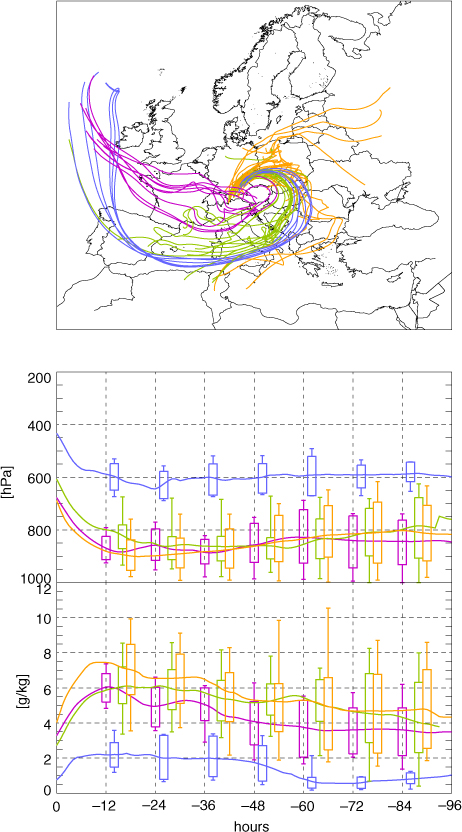
Fig. 7
Four-day backward trajectories starting from 31.05.2013 04UTC in the 052300 CTRL simulation (clustered based on spatial origin and humidity amount, see text for details). The lower two diagrams show the vertical level and specific humidity values of the cluster means, respectively. The box whisker plot shows the minimum, maximum, 25th and 75th percentile values of the clusters. The clusters are: North Atlantic, upper levels, dry (blue); North Atlantic, low levels (magenta); Mediterranean (green); Continental (orange).
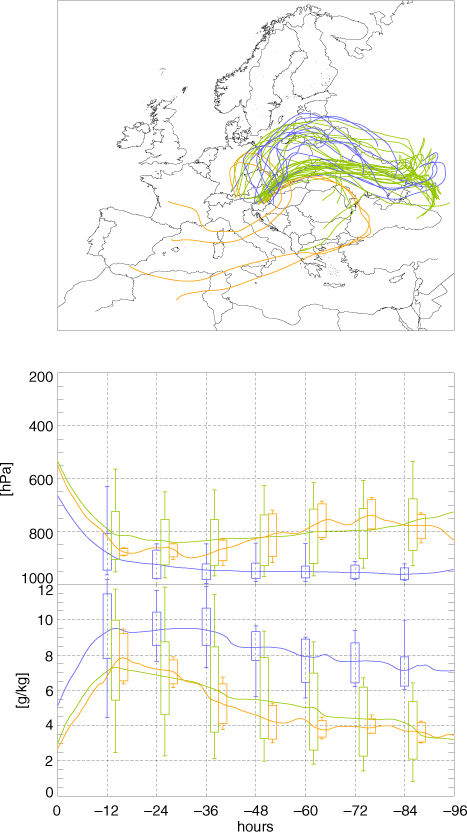
Fig. 8
Same as Fig. 7, but the starting date is 02.06.2013 00UTC and the clusters are: Mediterranean (orange); Continental, very moist, near surface (blue); Continental, less moist, higher (green).
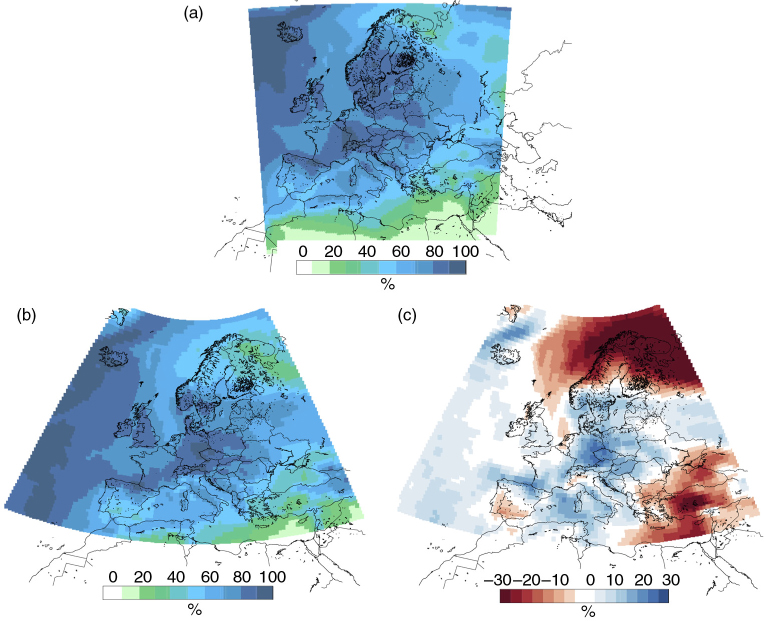
Fig. 9
Mean relative humidity at 925 hPa prior and during the event (27.05.2013–02.06.2013) (a) in 052300 CTRL simulation (b) in ERA-Interim. (c) The difference of (b) from ERA-Interim climatological (1979–2013) mean relative humidity in May.
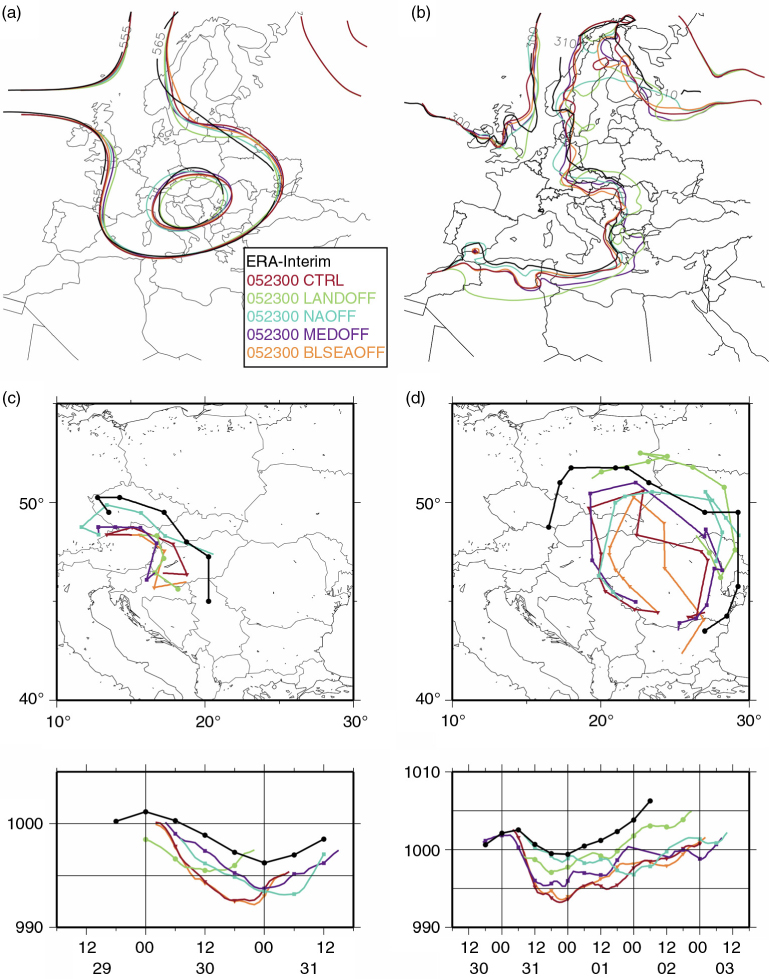
Fig. 10
Spaghetti diagram of mean (a) 500 hPa geopotential levels [555 and 565 gpdm] (b) 850 hPa equivalent potential temperature levels [300 and 310 K] between 30.05.2013 and 02.06.2013. Cyclone tracks for (c) cyclone A and (d) cyclone B in the CCLM sensitivity and control (052300 CTRL) simulations and ERA-Interim.
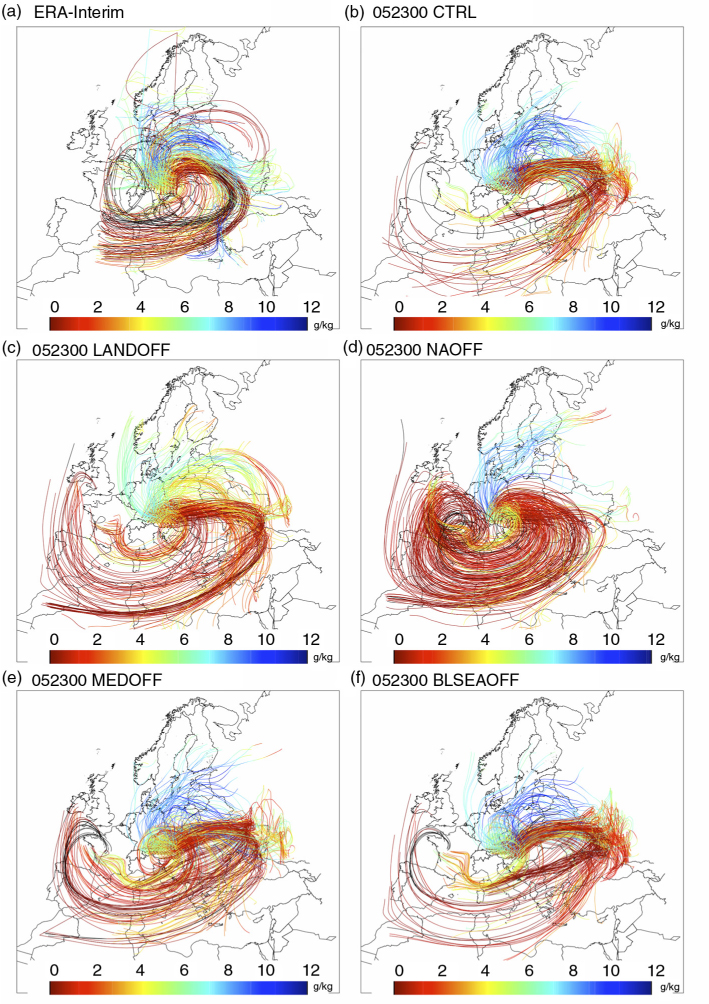
Fig. 11
Four-day backward trajectories starting from 02.06.2013 00 UTC in (a) ERA-Interim (b) 052300 CTRL, and (c–f) in the sensitivity simulations (MEDOFF, LANDOFF, NAOFF, BLSEAOFF). Colours denote the specific humidity along the trajectories [g/kg].
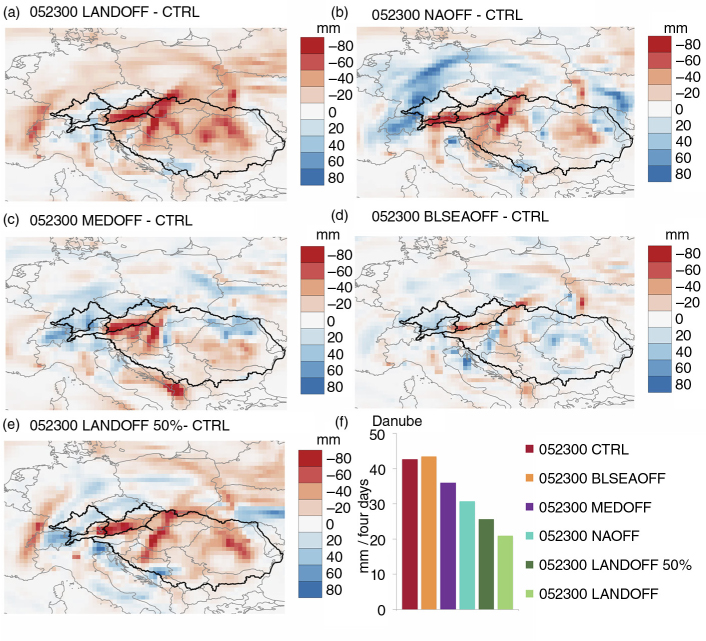
Fig. 12
(a–d) Four-day (30.05.2013–02.06.2013) accumulated precipitation differences [mm] between the sensitivity simulations and the control simulation (053200 CTRL). (e) Same as (a–d) but for additional LANDOFF 50 % sensitivity experiment. (f) Four-day (30.05.2013–02.06.2013) accumulated precipitation mean in the Danube basin in the control and in the sensitivity simulations.
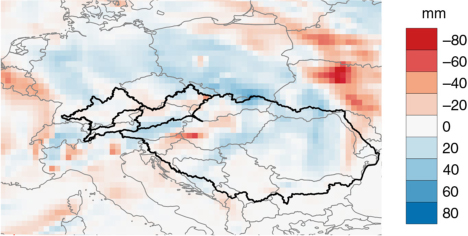
Fig. 13
Difference of accumulated precipitation prior to the event (23.05.2013–29.05.2013) between NAOFF and the control simulation.