
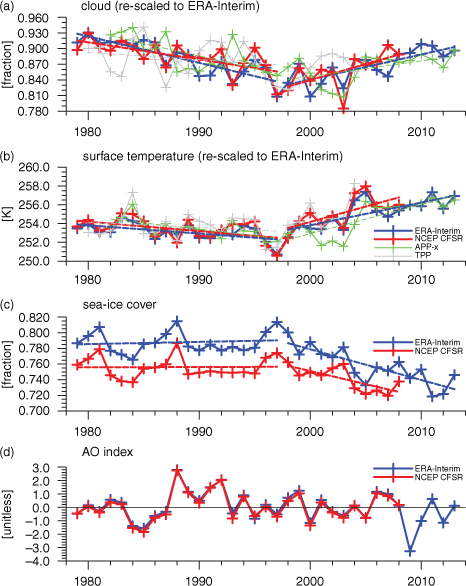
Fig. 1
Time series of (a) cloud amount, (b) surface temperature, (c) sea ice cover over the Arctic Ocean (north of 67°N) and (d) Arctic Oscillation (AO) index in winter (December through February) from ERA-Interim, NCEP CFSR, APP-x and TPP datasets. Long-term trends are denoted with dashed lines. The time series of cloud amount, surface temperature and sea ice cover are re-scaled to adopt the mean and standard deviation of ERA-Interim for comparison.
{ label needed for table-wrap[@id='T0001'] }
Table 1. Winter (December to February) mean, standard deviation and trends of total cloud fraction over the Arctic Ocean (north of 67°N) in each dataset
Mean (%)Standard deviation (%)Whole period in each data20th Century21st Century
ERA-Interim87.563.28−1.02 *
(1979/1980–2013/2014)−5.08 **
(1979/1980–1997/1998)4.80 **
(1998/1999–2013/2014)NCEP CFSR81.852.32−1.29 **
(1979/1980–2008/2009)−2.32 **
(1979/1980–1997/1998)4.33 **
(1998/1999–2008/2009)APP-x74.077.12−3.07 **
(1982/1983–2013/2014)−10.54 **
(1982/1983–1997/1998)6.43 **
(1998/1999–2013/2014)TPP72.467.46−2.86
(1980/1981–2004/2005)−3.07
(1980/1981–1997/1998)18.92 *
(1998/1999–2004/2005)
{ label needed for table-wrap[@id='T0002'] }
Table 2. Same as Table 1 except for surface temperature
Mean (K)Standard deviation (K)Whole period20th Century21st Century
ERA-Interim254.041.580.96 **
(1979/1980–2013/2014)−0.88 **
(1979/1980–1997/1998)2.42 **
(1998/1999–2013/2014)NCEP CFSR253.071.200.55 **
(1979/1980–2008/2009)−0.76 **
(1979/1980–1997/1998)2.48 **
(1998/1999–2008/2009)APP-x252.502.171.06 **
(1982/1983–2013/2014)−1.88 **
(1982/1983–1997/1998)4.27 **
(1998/1999–2013/2014)TPP248.650.96−0.35
(1980/1981–2004/2005)−0.33
(1980/1981–1997/1998)2.76
(1998/1999–2004/2005)
Table 3. Correlation coefficients among datasets used in this study
E-CE-AE-TC-AC-TA-TE-CE-AE-TC-AC-TA-TE-CE-AC-A
Corr.0.820.550.230.450.30−0.030.830.450.220.160.32−0.020.620.410.58 Whole period (detrended) (1982–2004) L20C (detrended) (1982–1997)E21C (detrended) (1998–2008)
E-CE-AE-TC-AC-TA-TE-CE-AE-TC-AC-TA-TE-CE-AC-ACorr.0.74−0.090.16−0.160.23−0.310.77−0.300.27−0.400.26−0.050.440.310.47
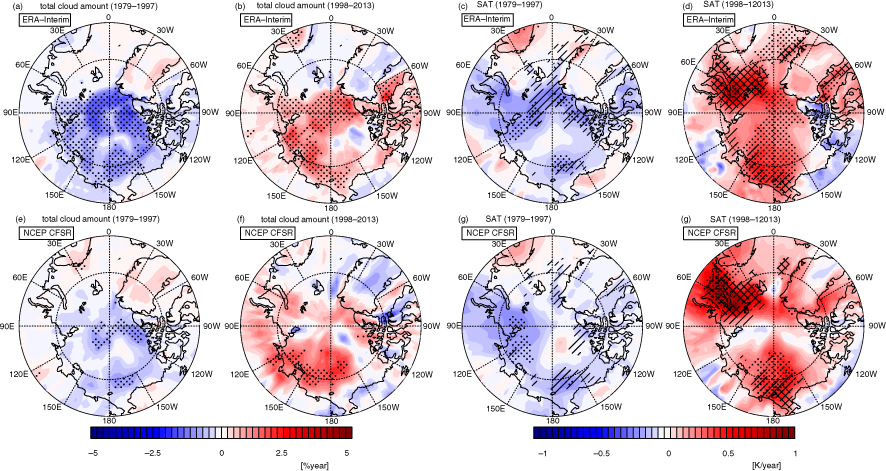
Fig. 2
Trends in wintertime (a, b, e, f) total cloud amount and (c, d, g, h) surface air temperature during the late 20th century (1979–1997) and early 21st century (1998–present) from the ERA-Interim and NCEP CFSR. Stippled region indicates trends significant at the 95 % confidence level. Oblique and cross-checked regions in SAT plots indicate regions of increased (decreased) sea ice cover above (below) 0.2 % year−1 and 0.5 % year−1, respectively.
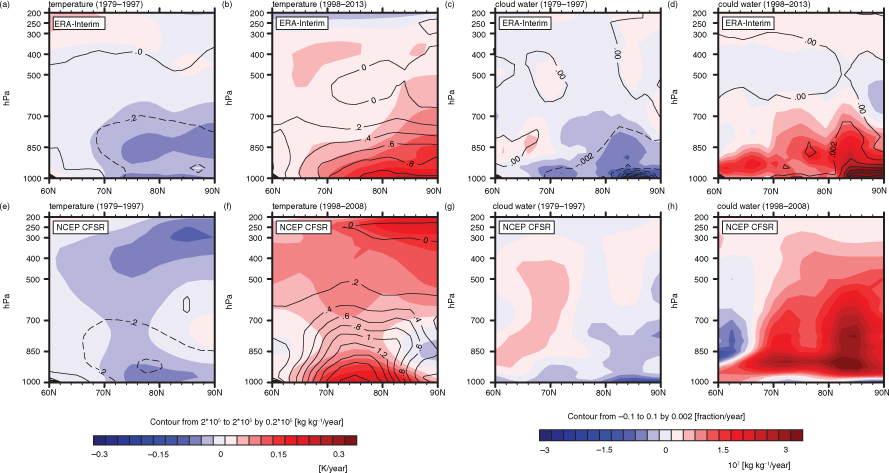
Fig. 3
Trends in zonal-averaged (a, b, e, f) wintertime temperature (shading) and specific humidity (contour), (c, d, g, h) cloud water content (shading) and (c, d) fractional cloud cover (contour) during the late 20th century (1979–1997) and early 21st century (1998–present) from the ERA-Interim and NCEP CFSR. Dashed contour lines indicate negative values.
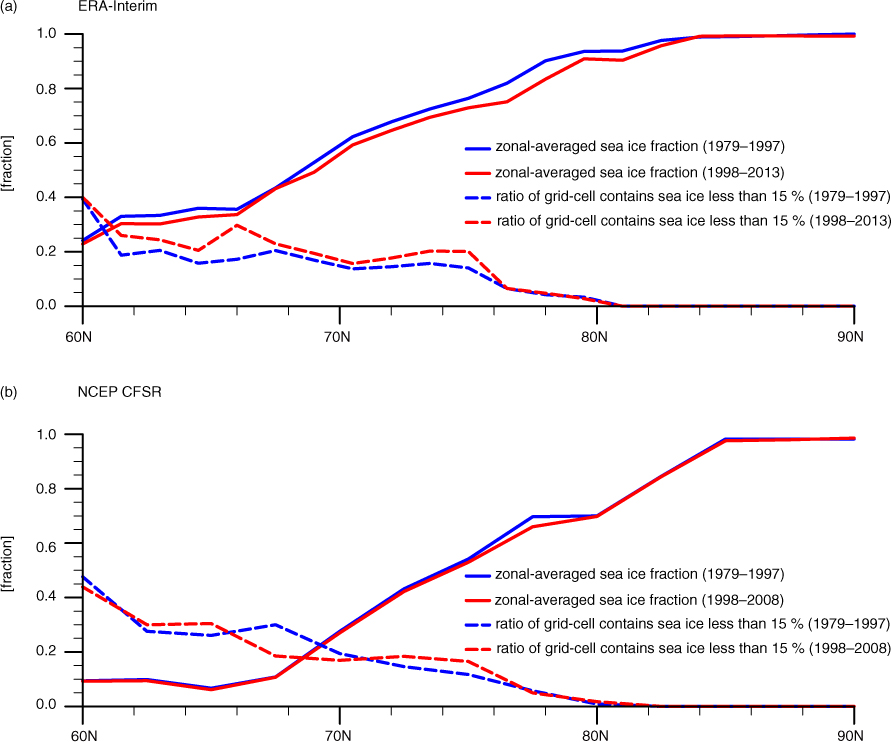
Fig. 4
Wintertime zonal-averaged sea ice cover and ratio of grid cell contains grid-cell that contains sea ice fraction less than 0.15 to grid-cell that contains sea ice in same latitude during the late 20th century (1979–1997) and early 21st century (1998–present) from (a) ERA-Interim and (b) NCEP CFSR.
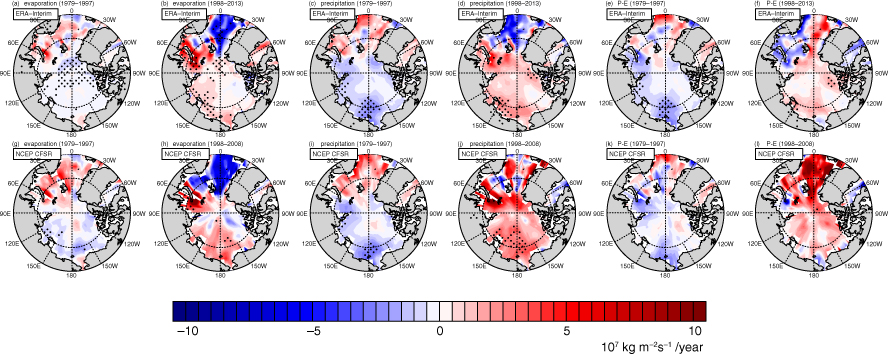
Fig. 5
Trends in wintertime (a, b, g, h) evaporation, (c, d, i, j) precipitation and (e, f, k, l) their difference (precipitation minus evaporation) during the late 20th century (1979–1997) and early 21st century (1998–present) from the ERA-Interim and NCEP CFSR. Stippled region indicates trends significant at the 95 % confidence level.
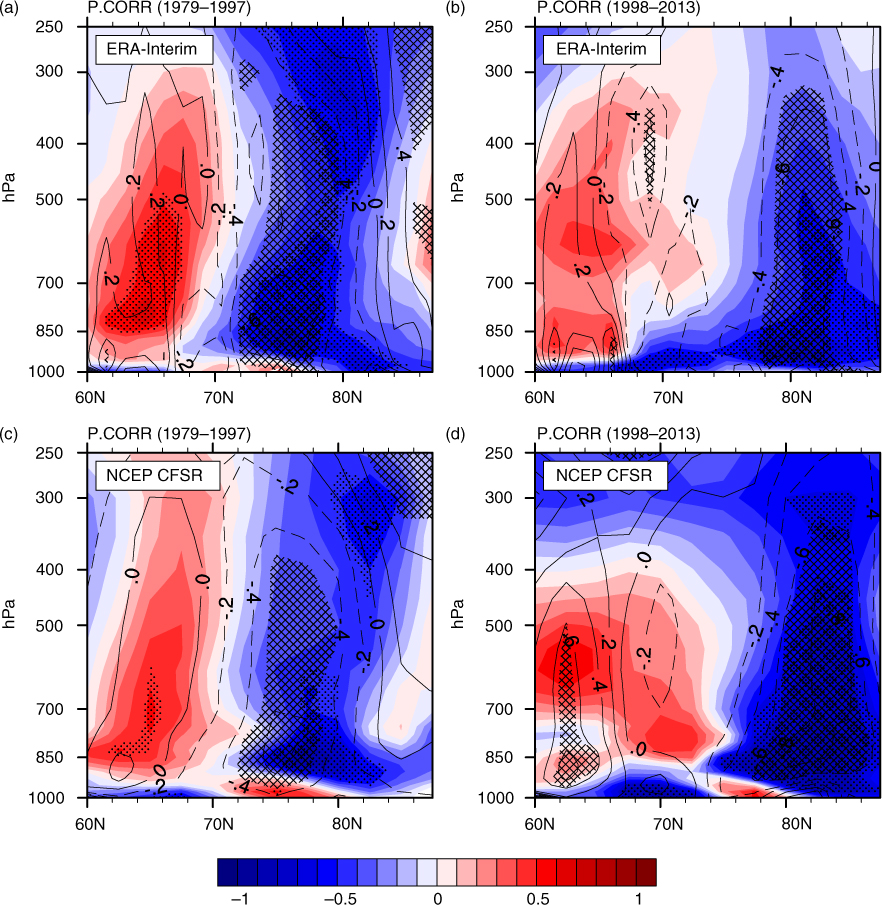
Fig. 6
Partial correlations of sea ice cover averaged over the Arctic Ocean (north of 67°N) with zonal averaged cloud water content (shading) and mean upward moisture transport (contour) independent of the Arctic Oscillation (AO) index during the late 20th century and the early 21st century from the ERA-Interim and NCEP CFSR. Stippled (cross-checked) regions indicate that values with shading (contour) are significant at the 95 % confidence level. Dashed contour lines indicate negative values.
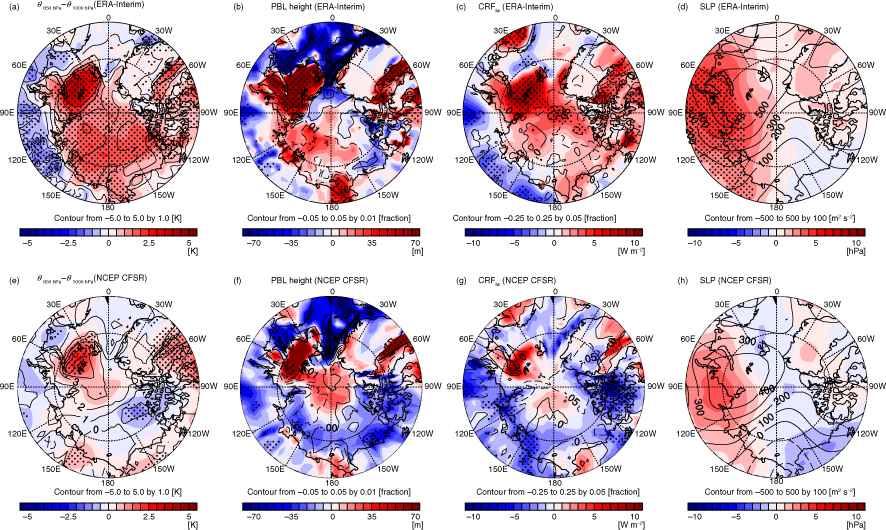
Fig. 7
Differences in (a, e) 850 hPa thickness (shading) and surface air temperature (contour), (b, f) planetary boundary layer (PBL) height (shading) and sea ice fraction (contour), (c, g) longwave cloud radiative forcing (shading) and cloud amount (contour), and (d, h) sea level pressure (shading) and 500 hPa geopotential height (contour) between averages for the early 21st century and the late 20th century. Stippled region indicates differences in shading values significant at the 95 % confidence level. Dashed contour lines indicate negative values.
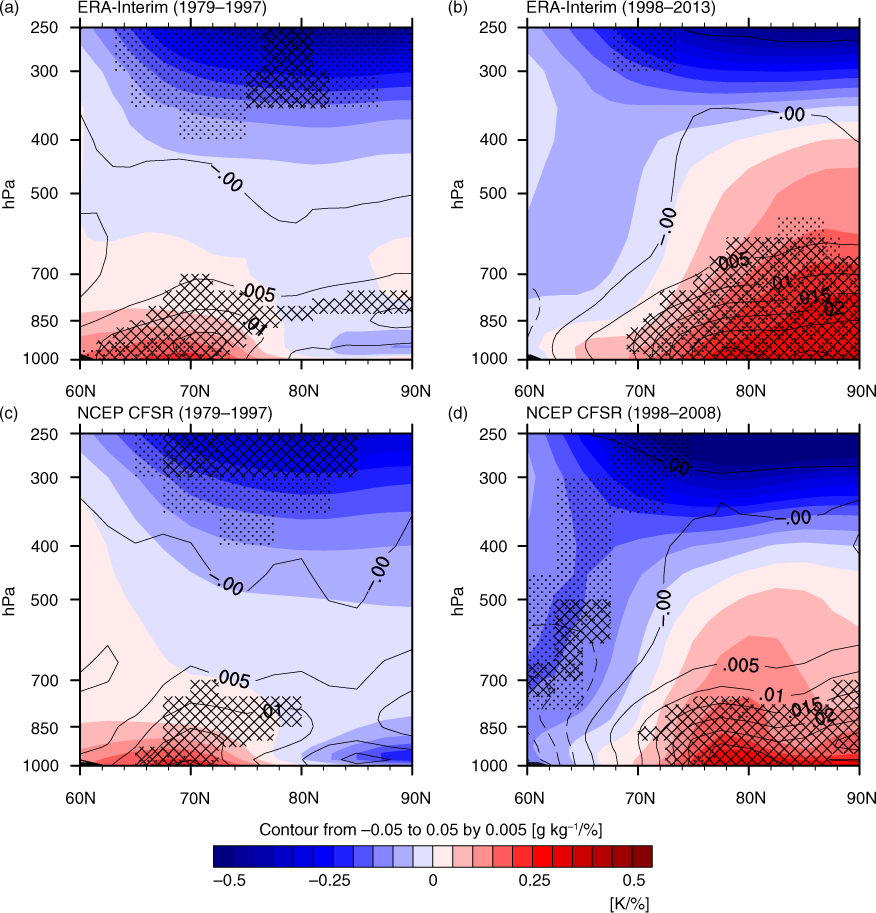
Fig. 8
Regression of winter low-level cloud amount averaged over the Arctic Ocean (north of 67°N) onto zonally averaged temperature (shading) and specific humidity (contour) during the late 20th century (1979–1997) and early 21st century (1998–present) from the ERA-Interim and NCEP CFSR. Trends are removed from the raw data before calculating the regression coefficients. Stippled and cross-checked regions indicate regression significant at the 95 % confidence level. Dashed contour lines indicate negative values.
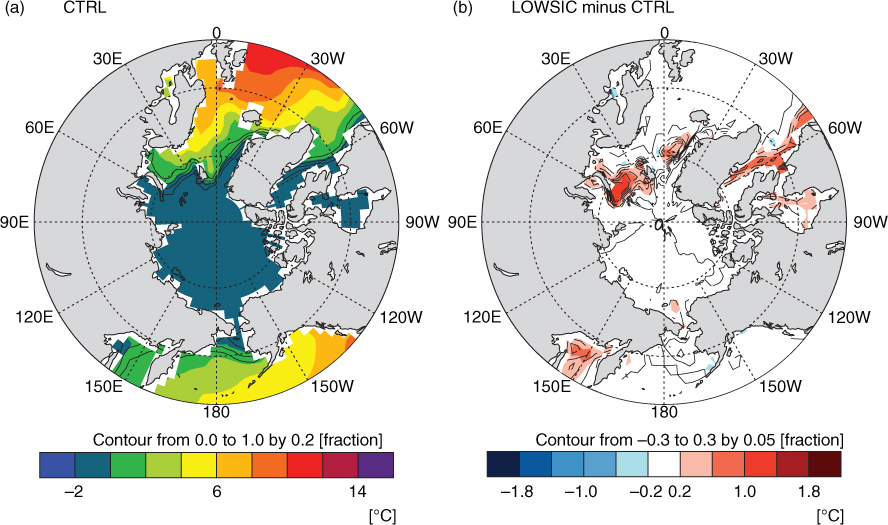
Fig. 9
Winter mean sea surface temperature (shading) and sea ice concentration (contour) boundary conditions for (a) the baseline experiment (CTRL) experiment and (b) differences from the sensitivity experiment (LOWSIC) (LOWSIC minus CTRL). Dashed contour lines indicate negative values.
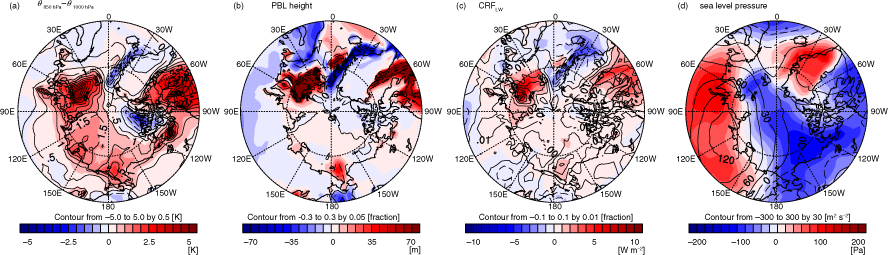
Fig. 10
Changes in (a) surface air temperature (contour) and 850 hPa atmospheric thickness (shading), (b) sea ice cover (contour) and planetary boundary layer height (shading), (c) total cloud amount (contour) and longwave cloud radiative forcing (shading), and (d) 500 hPa geopotential (contour) and sea level pressure (shading) from the sensitivity experiment (LOWSIC) compared with the baseline experiment (CTRL). Dashed contour lines indicate negative values.
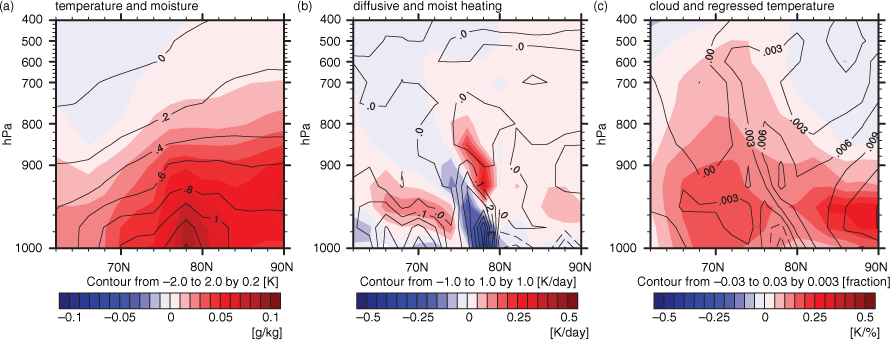
Fig. 11
Changes in (a) zonal-averaged temperature (contour) and specific humidity (shading), (b) heating by diffusion (contour) and moistening processes (shading), and (c) cloud amount (contour) and regressed temperature of low-level cloud amount over the Arctic (shading) from the sensitivity experiment (LOWSIC) experiment compared with the baseline experiment (CTRL). Dashed contour lines indicate negative values.
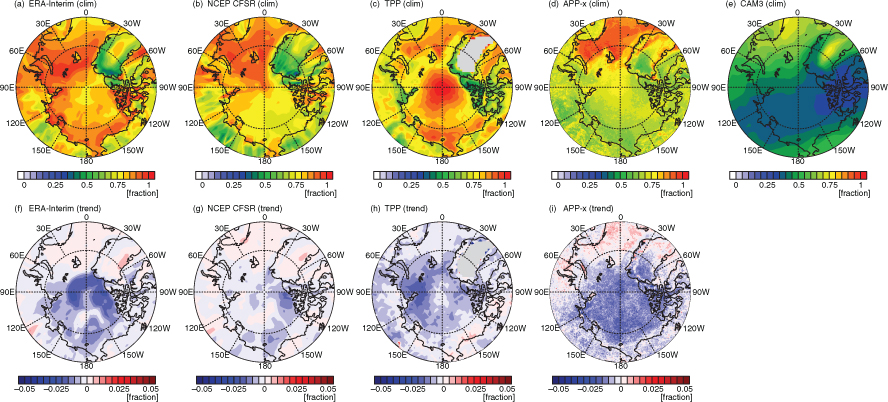
Fig. 12
(a, b, c, d, e) Wintertime total cloud amount averaged over period of 1982–1997 from ERA-Interim, NCEP CFSR, TPP, APP-x and CAM3 baseline experiment, and (f, g, h, i) their trends during the same period except for CAM3 baseline experiment.
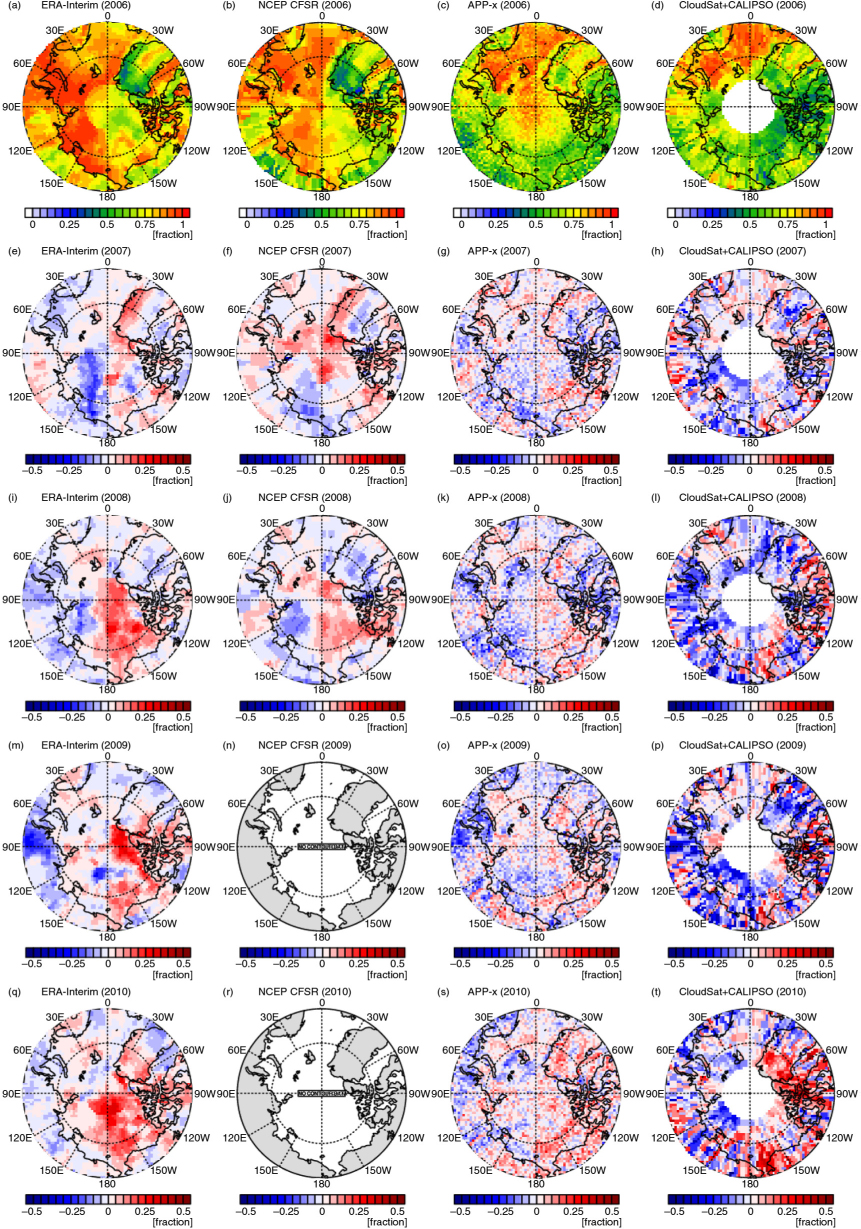
Fig. 13
(a, b, c, d) Total cloud amount averaged over winter (December through February) of 2006 from ERA-Interim, NCEP CFSR, APP-x, and CloudSat + CALIPSO, and differences for winter of (e, f, g, h) 2007, (i, j, k, l) 2008, (m, n, o, p) 2009 and (q, r, s, t) 2010 against 2006 from each dataset.
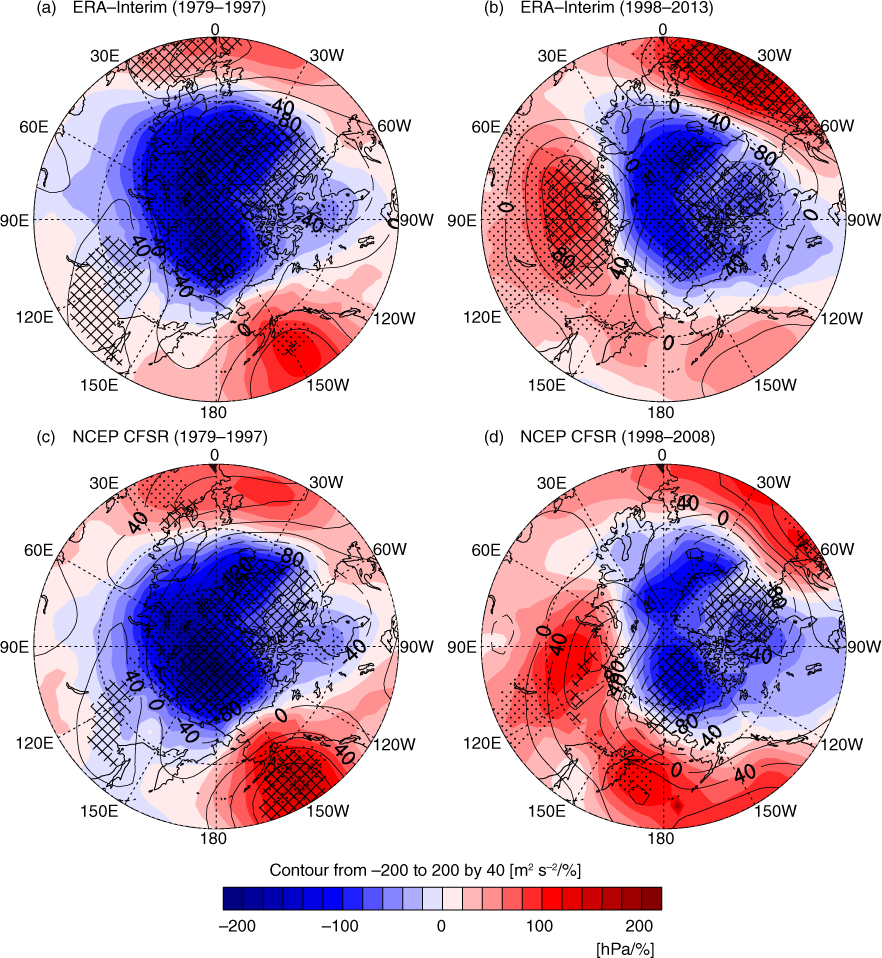
Fig. 14
Regression of winter low-level cloud amount averaged over the Arctic Ocean (north of 67°N) showing mean sea level pressure (shading) and geopotential at 500 hPa (contour) during the late 20th century (1979–1997) and the early 21st century (1998–present) from the ERA-Interim and NCEP CFSR. Linear trends are removed before calculating regression coefficients. Stippled and cross-checked regions indicate regressions significant at the 95 % confidence level. Dashed contour lines indicate negative values.