
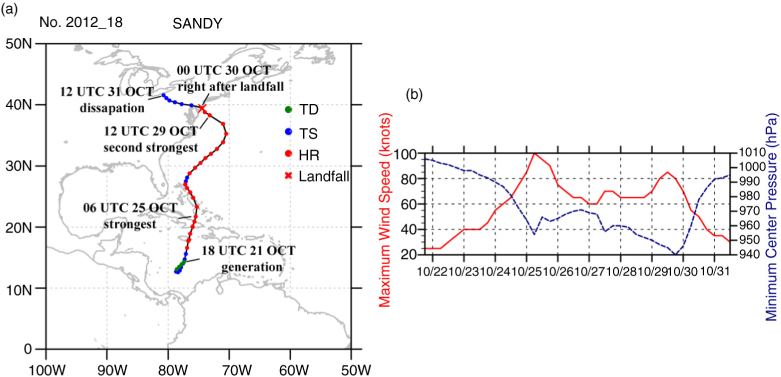
Fig. 1
(a) Best track and (b) intensity evolution indicated by maximum wind speed (red solid line, knots) and minimum central pressure (blue dashed line, hPa) of Hurricane Sandy with 6-hour interval from 1800 UTC 21 October to 1200 UTC 31 October 2012. It formed at 1800 UTC 21 October with the strongest wind speed at 0600 UTC 25 October, the second peak at 1200 UTC 27 October and the third peak at 1200 UTC 29 October, landfall near 0000 UTC 30 October, and dissipation at 1200 UTC 31 October 2012. Sandy was classified as tropical depression (TD), tropical storm (TS) and hurricane (HR) during its lifetime.
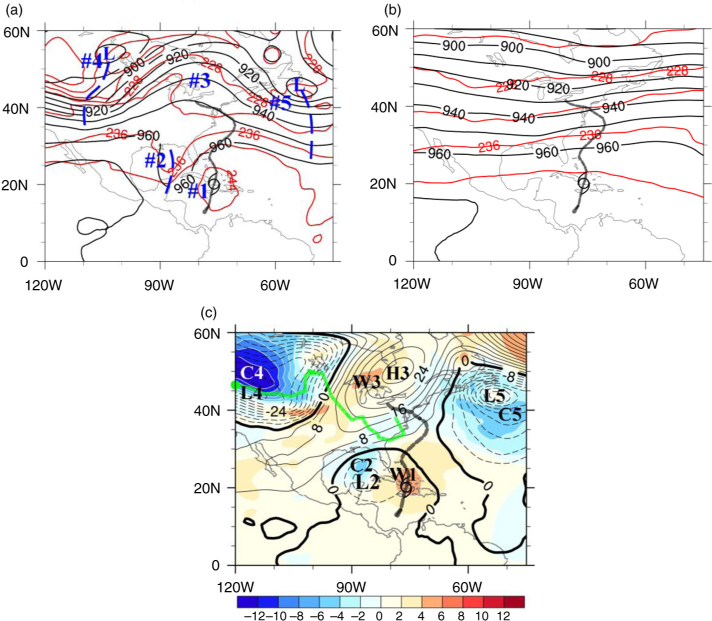
Fig. 2
(a) Total height (black line, 10×10 gpm interval) and total temperature (red line, 4 K interval), (b) climatic height (black line, 10×10 gpm interval) and climatic temperature (red line, 4 K interval) and (c) height anomaly (thin solid and dashed black lines, 4×10 gpm interval) and temperature anomaly (shading with while line, 2 K interval) at 300 hPa at 0600 UTC 25 October 2012. The grey dashed line with the symbol ‘' is the best track of Sandy. The thick green line in (c) is the low centre track of anomalous vortex L4 with the current location (green spot). In (a), the heavy dashed-blue lines indicate three troughs (#2, #4 and #5) while a ridge and the tropical cyclones (TC) are indicated by #3 and #1, respectively. In (c), letters ‘H’ and ‘L’ indicate the positive and negative centres of height anomalies, and ‘W’ and ‘C’ are the warm and cold centres of temperature anomalies.
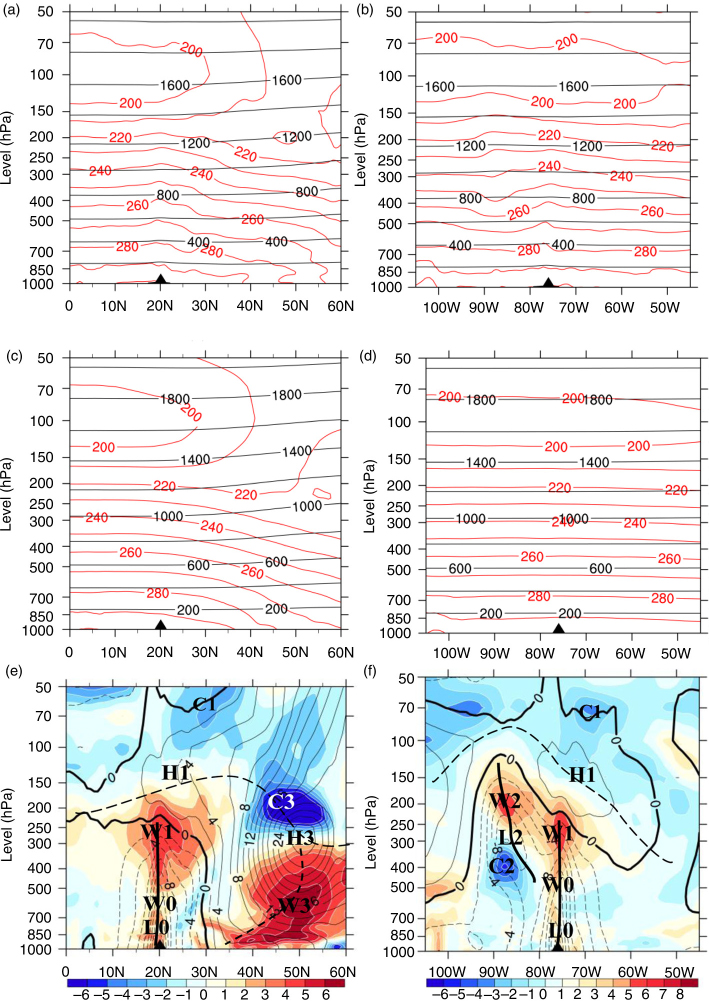
Fig. 3
Vertical-latitude cross sections of (a) total height (black line, 200×10 gpm interval) and total temperature (red line, 10 K interval), (c) climatic height (black line, 200×10 gpm interval), and climatic temperature (red line, 10 K interval) and (e) height anomalies (solid black line for positive and dashed black line for negative, 2×10 gpm interval) and temperature anomalies (red shading for positive and blue shading for negative with white line, 1 K interval), along 75.75°W longitude at 0600 UTC 25 October 2012. In (e), the dotted line indicates the axis of negative height anomalies, and the long-dashed line indicates the axis of positive height anomalies, while letters ‘H’ and ‘L’ denote positive and negative centres of height anomalies, and letters ‘W’ and ‘C’ denote positive and negative centres of temperature anomalies. Symbol ‘’ indicates the current position of Sandy. Panels (b), (d) and (f) are, respectively, the same as (a), (c) and (e), but for vertical-longitude cross sections along 20.25°N.
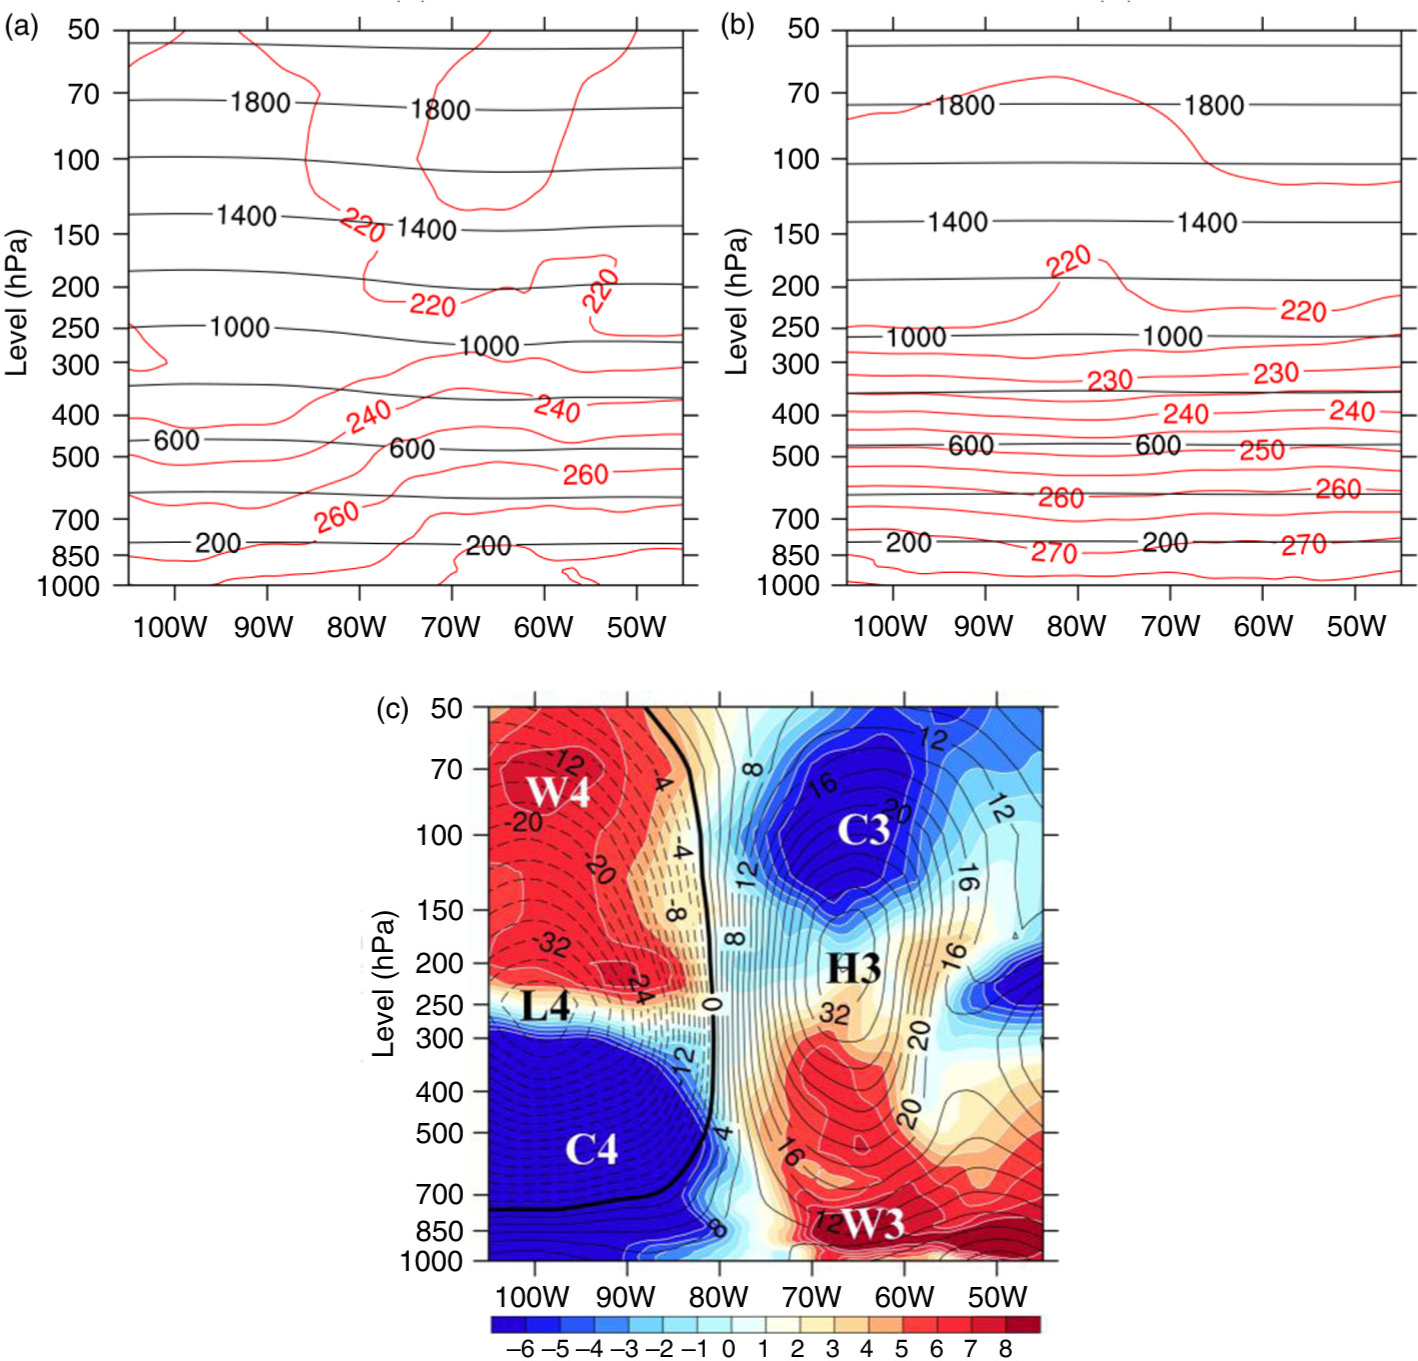
Fig. 4
Same as Fig. 3b, d and f but along 50°N at 1800 UTC 27 October 2012.
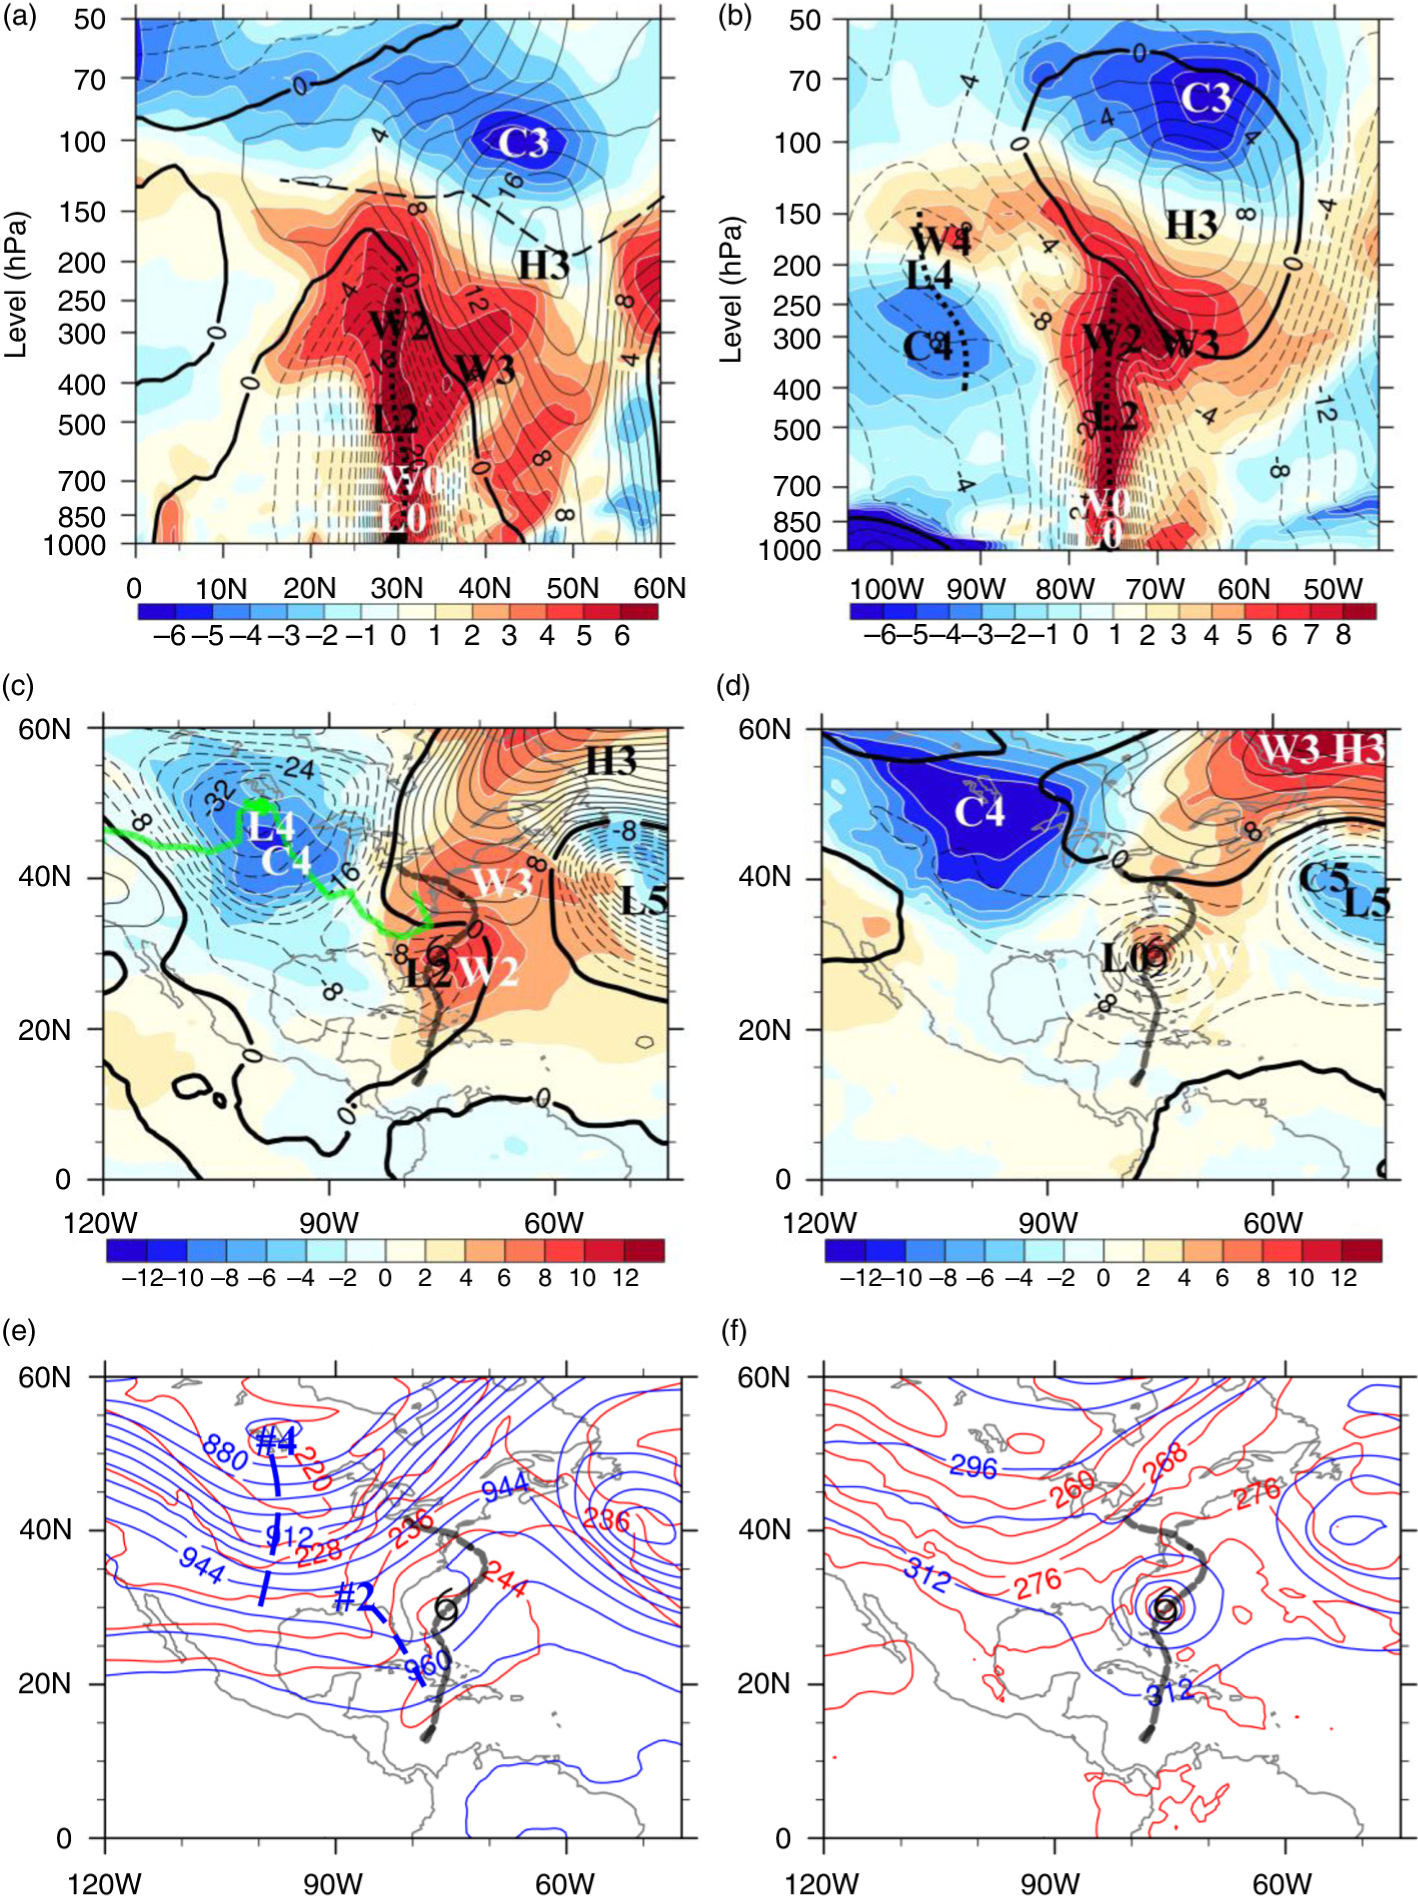
Fig. 5
Vertical sections of height anomalies (black solid and dashed lines, 2×10 gpm interval) and temperature anomalies (shading, 1 K interval) along (a) 75.75°W and (b) 30°N at 1800 UTC 27 October 2012, as well as the two horizontal synoptic charts of height anomalies (thin solid and dashed lines, 4×10 gpm interval) and temperature anomalies (shading, 2 K interval) at (c) 300 hPa and (d) 700 hPa, respectively. Panels (e) and (f) are the same as (c) and (d), but for total height (blue solid line, 8×10 gpm interval) and total temperature (red solid line, 4 K interval) at (e) 300 hPa and (f) 700 hPa, respectively. In (c), the thick green line is the low centre track of anomalous vortex L4 and the green spot is its current location. In (e), two blue dashed lines indicate the height troughs.
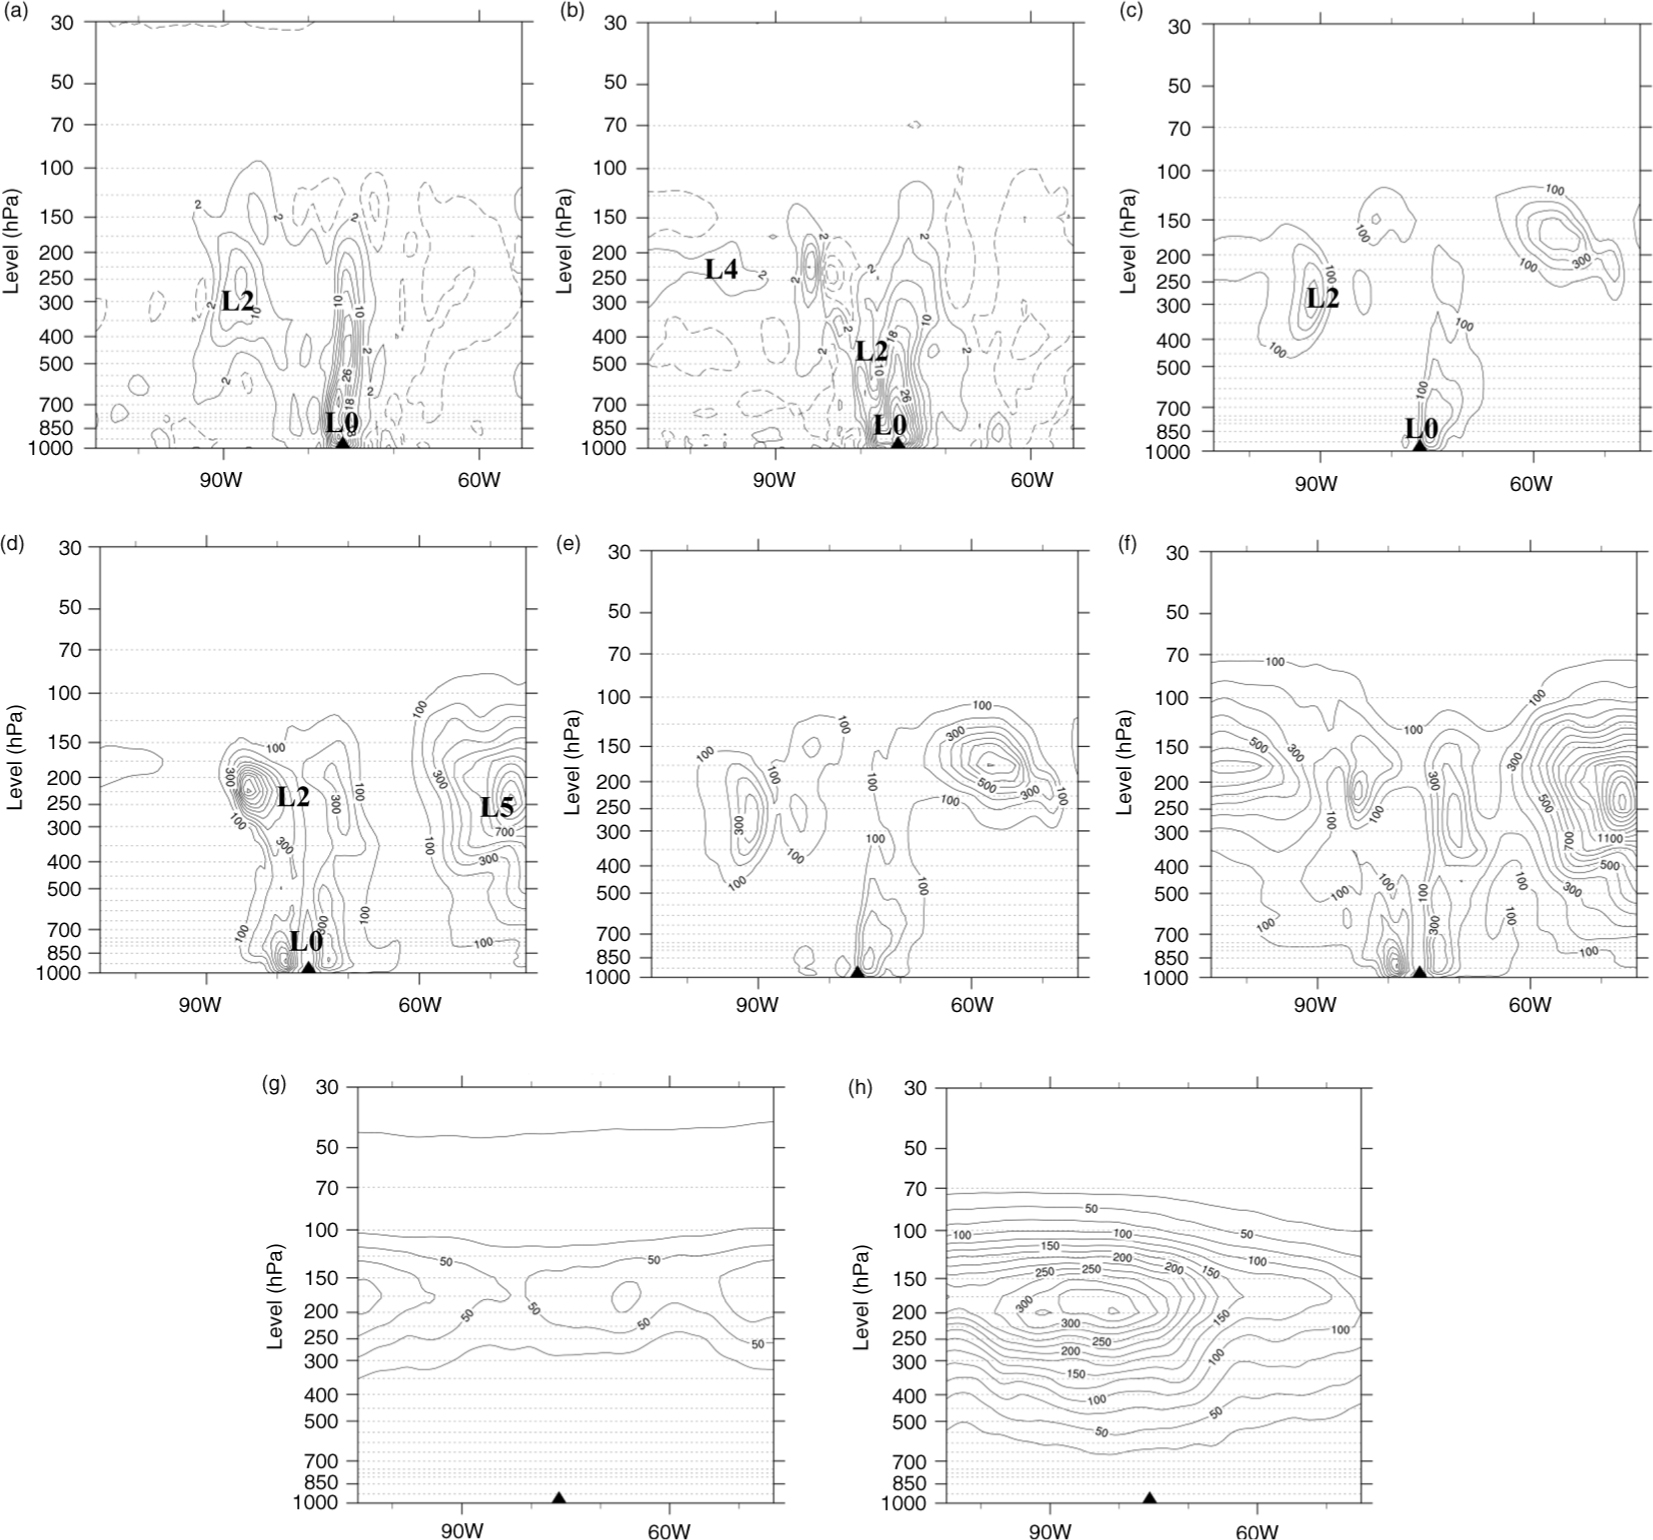
Fig. 6
Vorticity anomalies (8×10⁻⁵ s−1 interval) along the zonal section crossing the centre of Sandy at (a) 0600 UTC 25 (75.75°W and 20.25°N), (b) 1800 UTC 27 (75°W and 30.75°N) October 2012. Panels (c) and (d) are the same as (a) and (b) except anomalous kinetic energy (100 m2 s−2 interval). Panels (e) and (f) are the same as (c) and (d) except total kinetic energy. Panels (g) and (h) are the same as (e) and (f) except climatic kinetic energy (25 m2 s−2 interval). Symbol ‘’ indicates the current position of Sandy. Capital letter ‘L’ indicates the position of vortex.
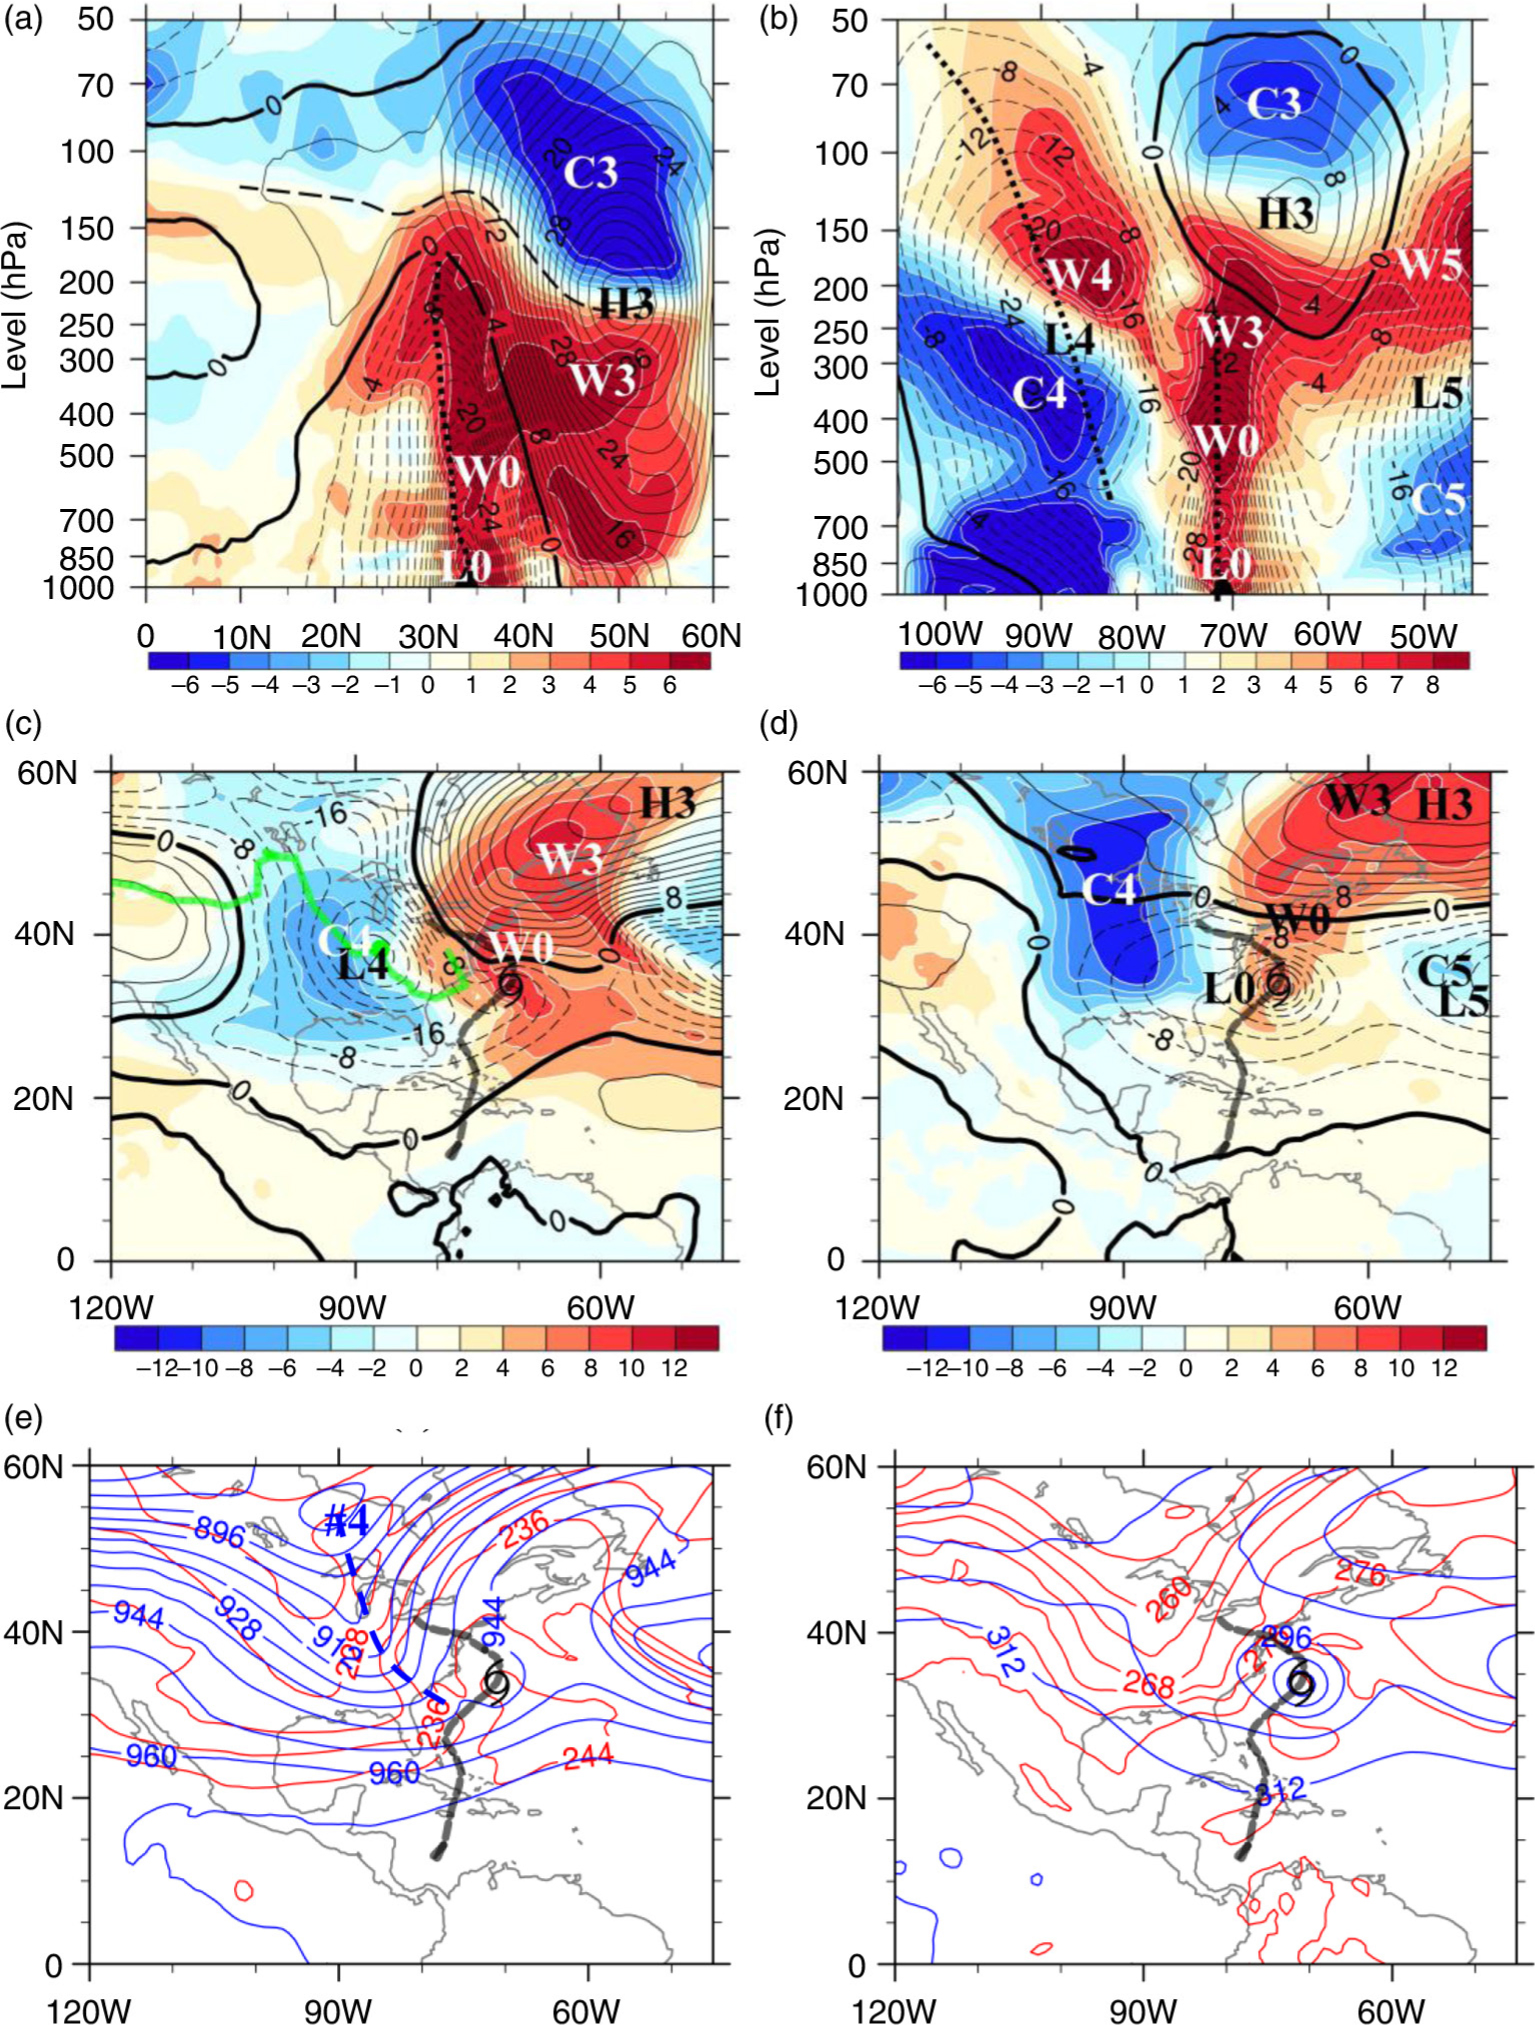
Fig. 7
Same as Fig. 5 except for the vertical-latitude sections along (a) 71.25°W and (b) 33.75°N at 0000 UTC 29 October 2012, as well as the two horizontal anomaly-based synoptic charts on (c) 300 hPa and (d) 700 hPa, respectively. Total height and total temperature are shown at (e) 300 hPa and (f) 700 hPa.
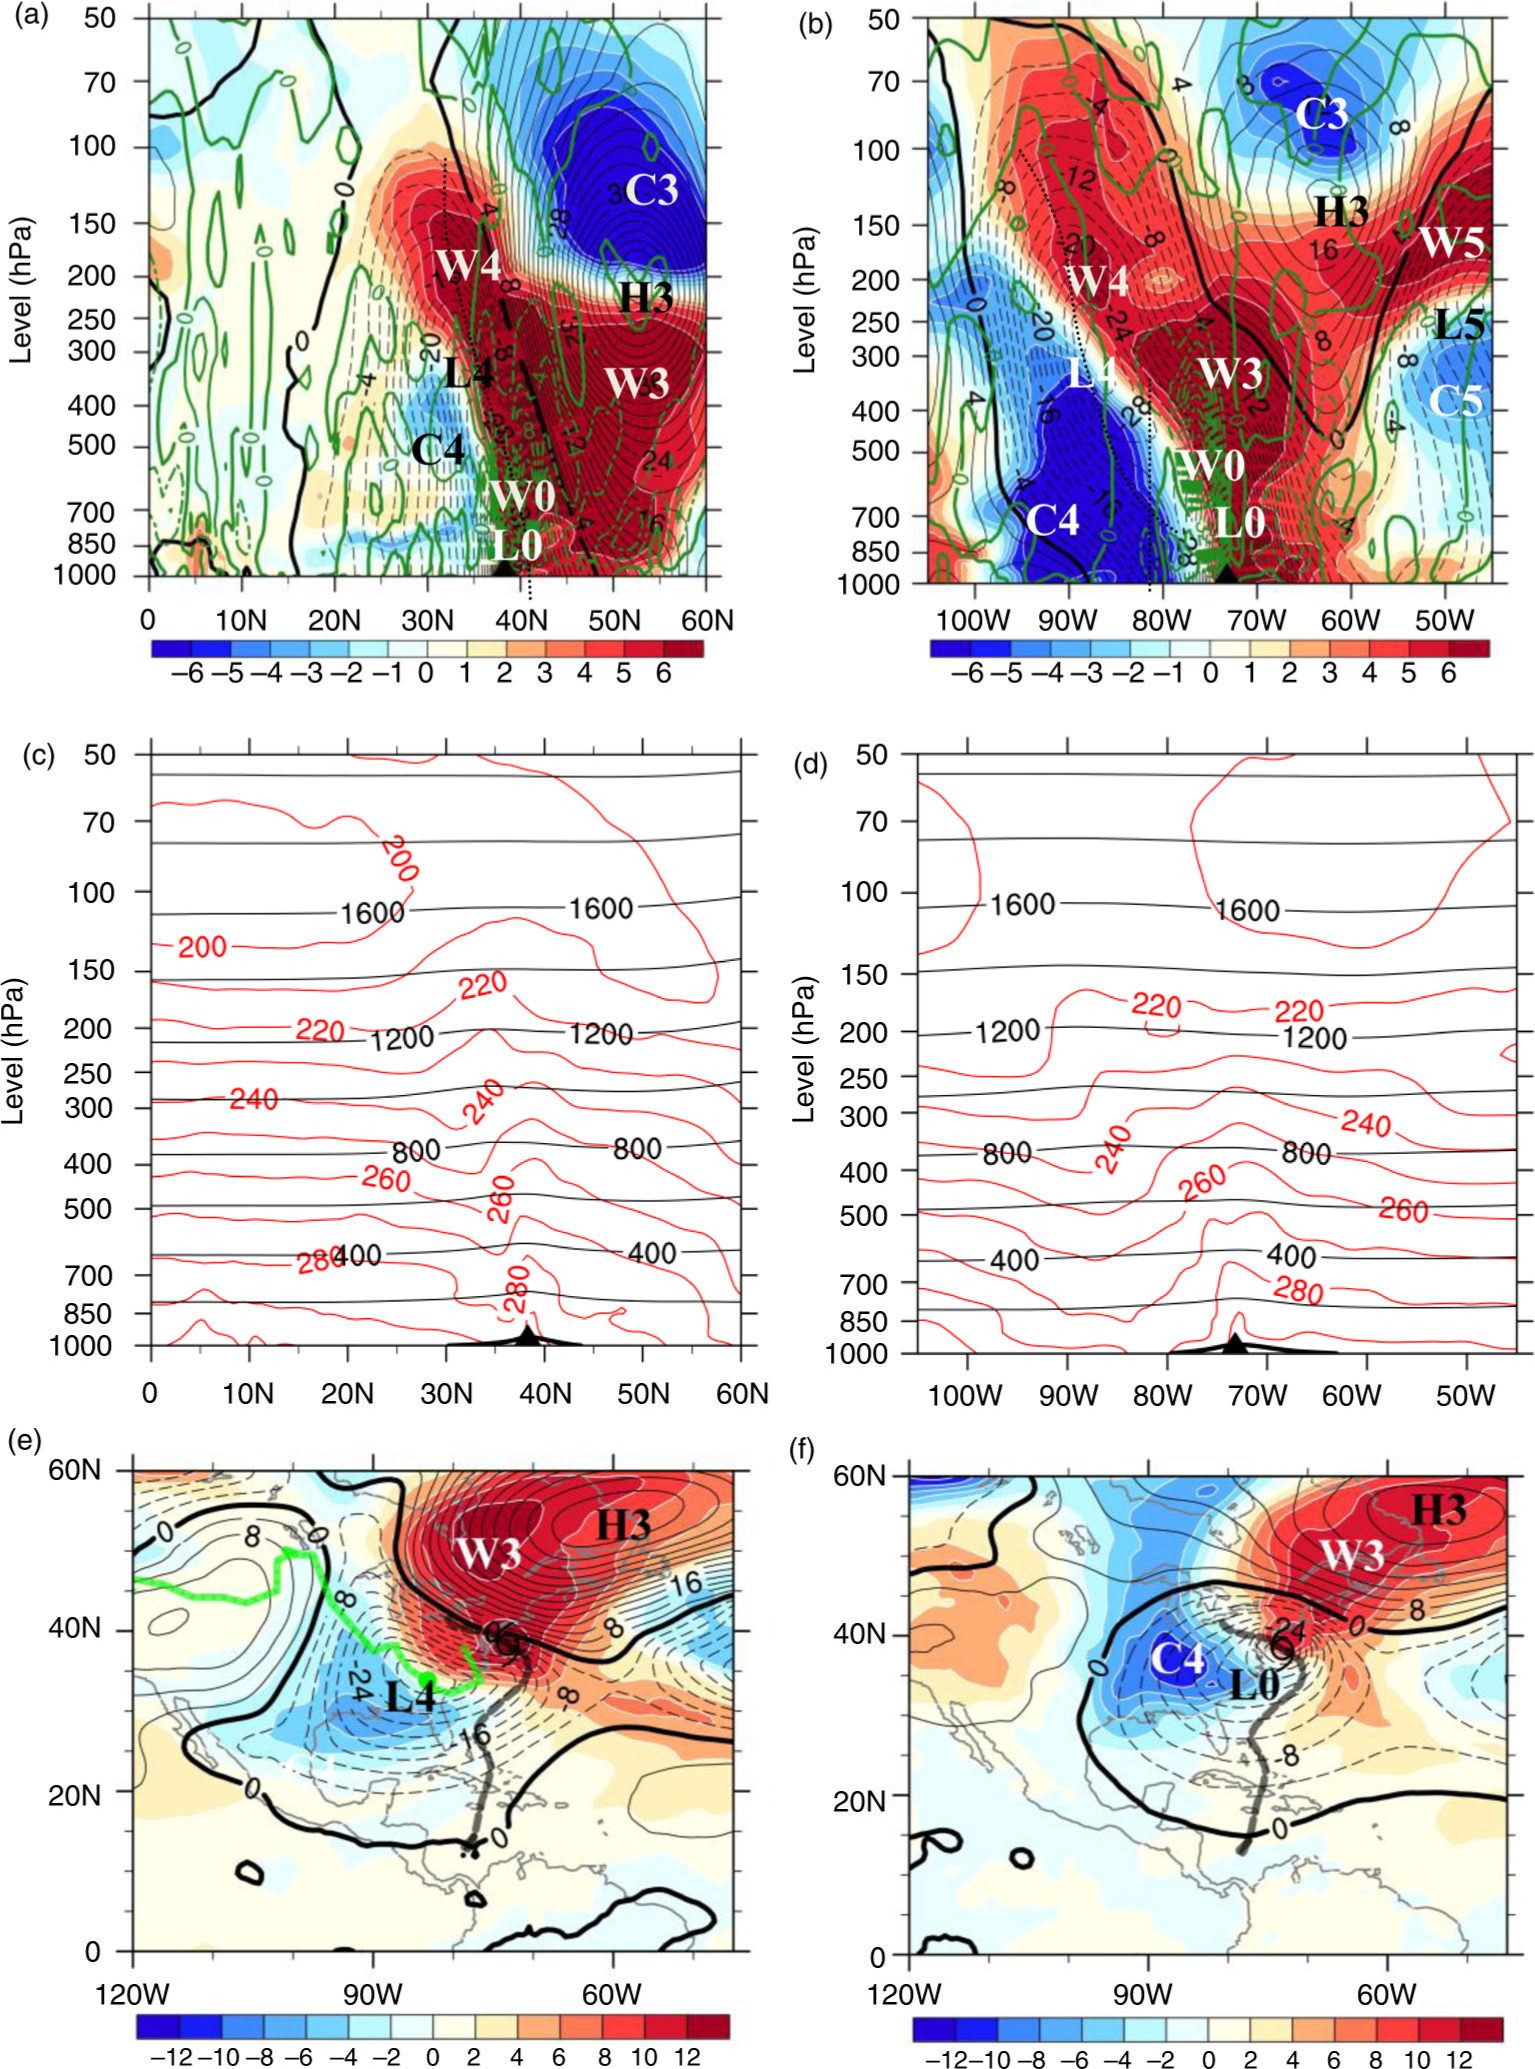
Fig. 8
Same as Fig. 5a and b except at 1800 UTC 29 October 2012 along (a) 73.5°W and (b) 38.25°N. Panels (c) and (d) are total height (black solid line, 200×10 gpm interval) and total temperature (red solid line, 10 K interval) at 1800 UTC 29 October 2012 along 73.5°W and 38.25°N, respectively. Height and temperature anomalies are on (e) 300 hPa and (f) 850 hPa at 1800 UTC 29 October 2012. In (a) and (b), the green solid and dashed lines, respectively, indicate anomalous descending and rising pressure velocities (10 hPa s−1 interval).
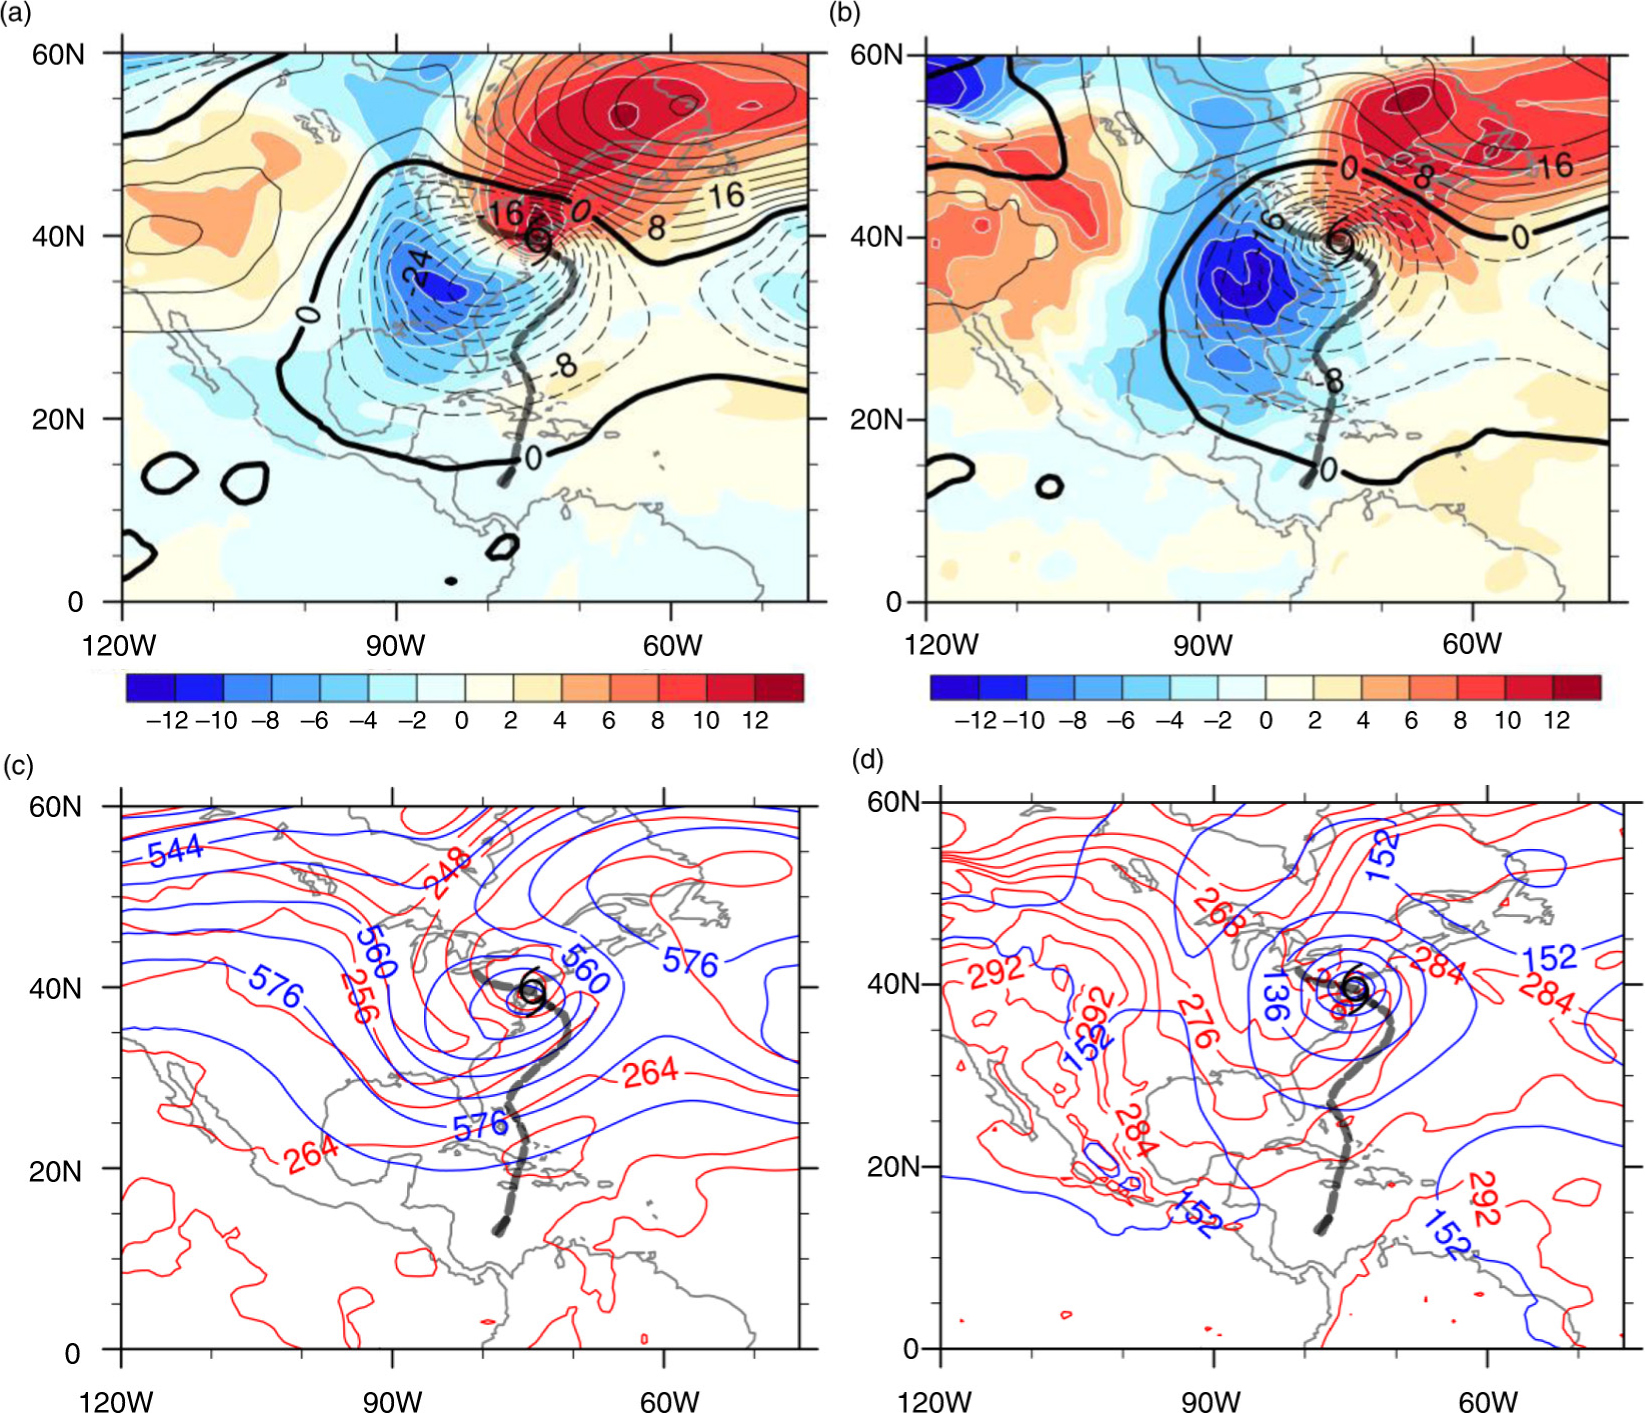
Fig. 9
Height anomalies (black solid and dashed lines, 4×10 gpm interval) and temperature anomalies (shading, 2 K interval) at (a) 500 hPa and (b) 850 hPa at 0000 UTC 30 October 2012. Panels (c) and (d) are the same as (a) and (b) but for total height (blue line, 8×10 gpm interval) and total temperature (red line, 4 K interval) on (c) 500 hPa and (d) 850 hPa, respectively.
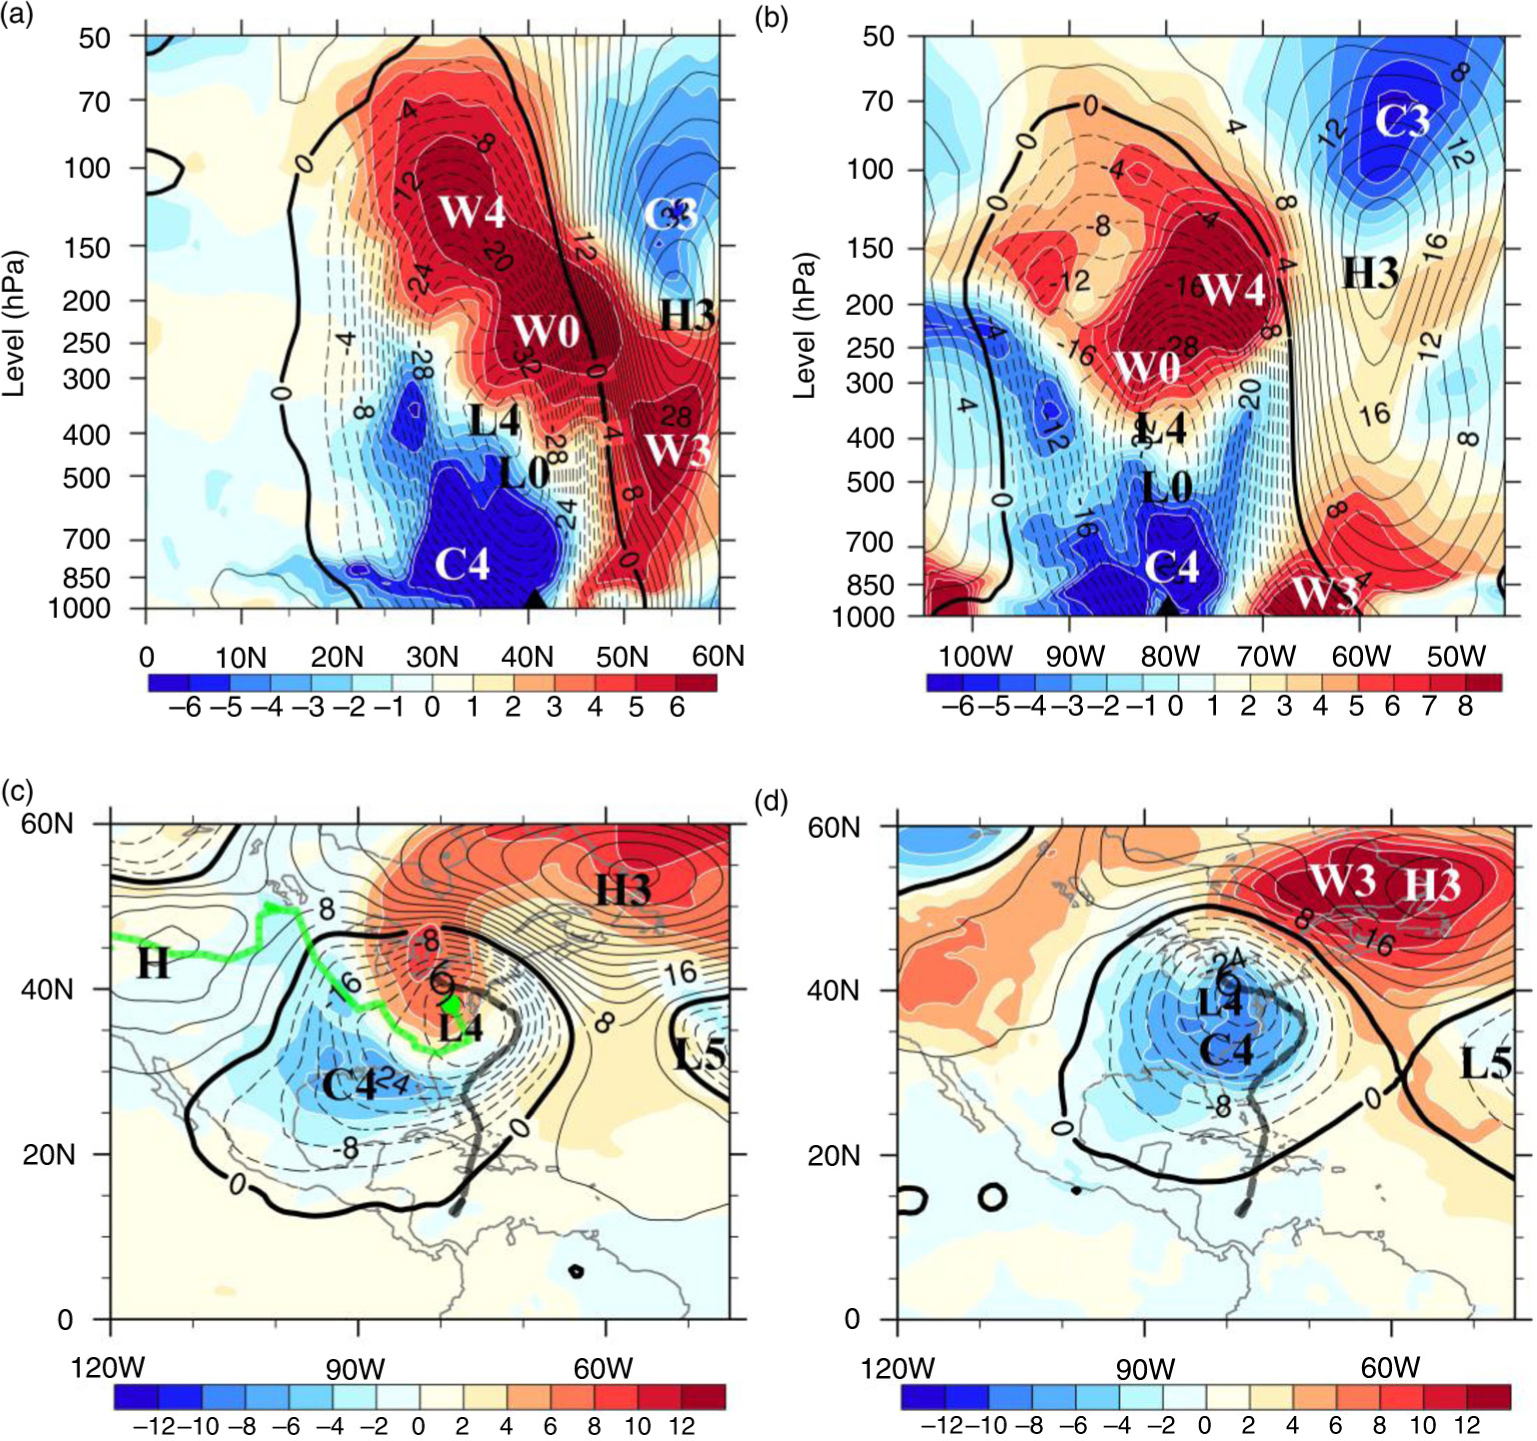
Fig. 10
Same as Fig. 5a–d except at 0000 UTC 31 October 2012 for the two vertical sections along (a) 79.5°W and (b) 40.5°N, as well as the two horizontal anomaly-based synoptic charts on (c) 300 hPa and (d) 700 hPa, respectively.
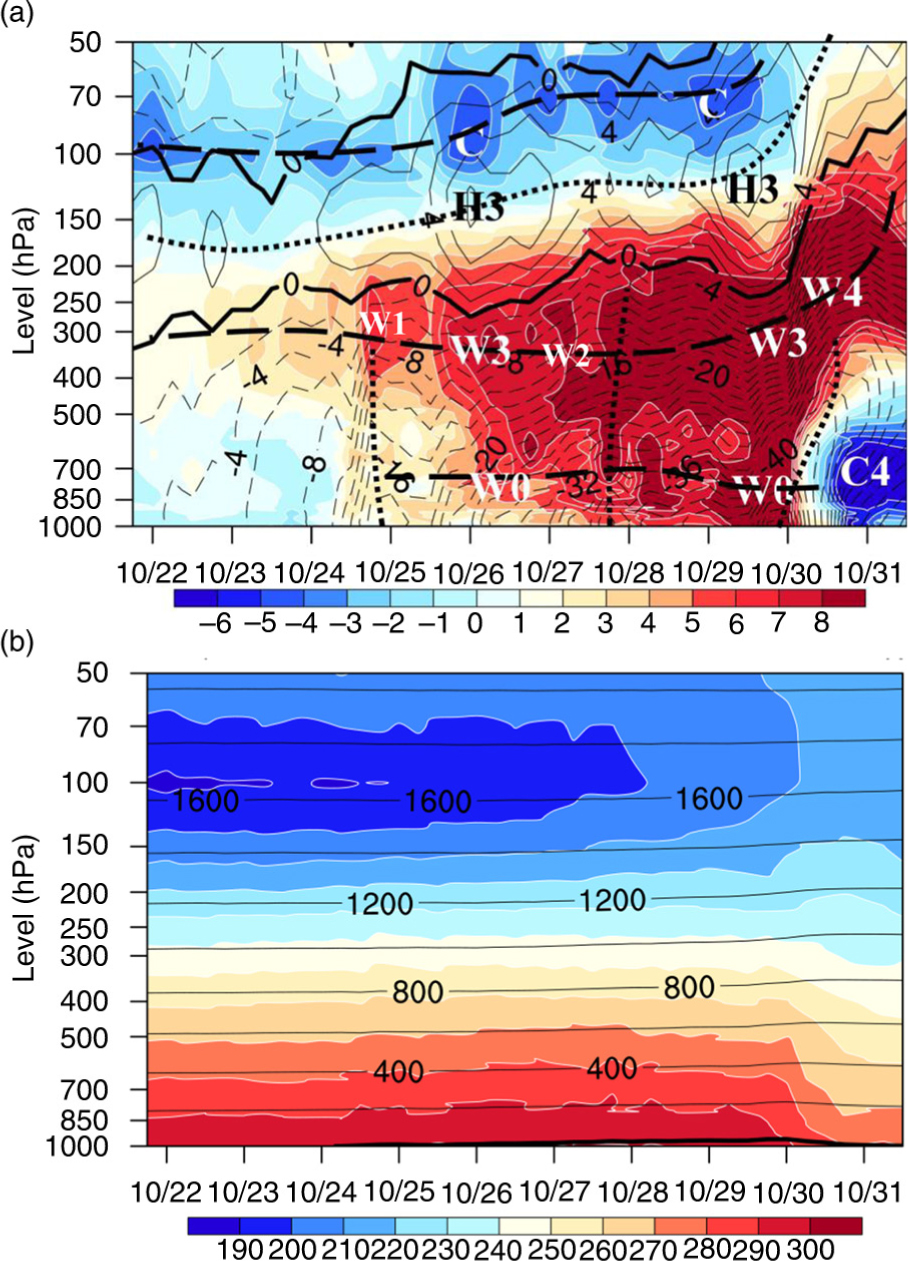
Fig. 11
(a) Time-pressure section of height anomalies (black solid line for positive and dashed line for negative, 2×10 gpm interval) and temperature anomalies (shading, 1 K interval) with 6-hour interval from 1800 UTC 21 to 1200 UTC 31 October 2012. The heavy dotted line and the heavy dashed line are the axes of height anomalies and temperature anomalies, respectively. Three vertical axes of height anomalies at the mid–low troposphere are indicated by the heavy dotted line at 1800 UTC 24, 1800 UTC 27 and 0000 UTC 30 October, respectively. (b) Same as in (a) except for total height (thin solid line, 200×10 gpm interval) and total temperature (shading, 10 K interval).
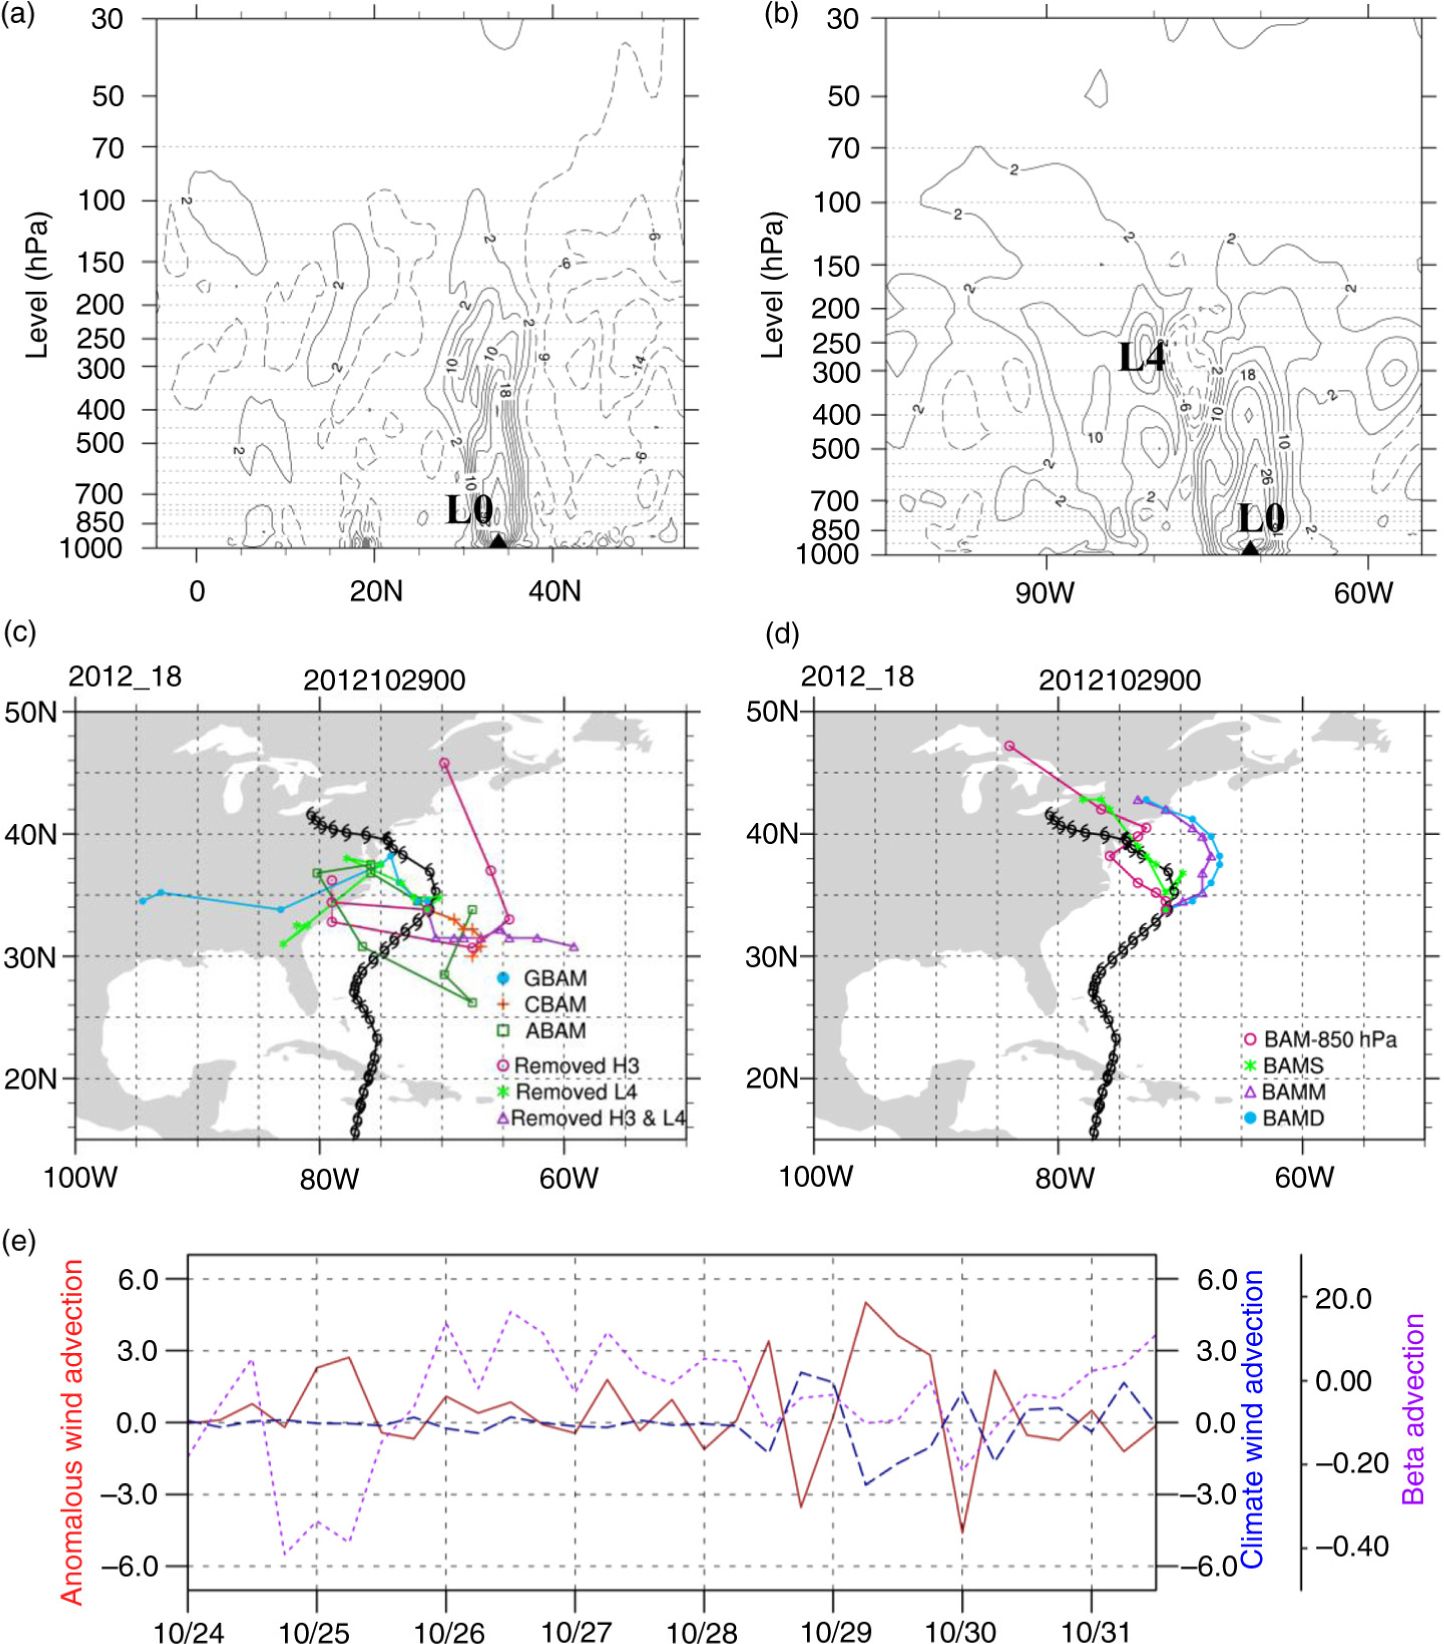
Fig. 12
(a) Meridional and (b) zonal sections of vorticity anomalies (8×10⁻⁵ s−1 interval) crossing the centre of Sandy at 0000 UTC 29 October 2012. Letters L0 and L4 indicate the locations of Sandy vortex and middle-latitude vortex, respectively. The 48-hour track forecasts of Sandy every 6 hours by (c) the GBAM, CBAM, ABAM and the results after removing other anomalous systems at 850 hPa as well by (d) classical BAMs initiated at 0000 UTC 29 October 2012. The black line with symbol ‘’ indicates the best track of Sandy in (c) and (d). (e) Time series of vorticity advection (blue dashed line, 10−8 s−2) by the climatic flow, vorticity advection (red line, 10−8 s−2) by the anomalous flow, and the beta term (purple line, 10−8 s−2) at 850 hPa.