
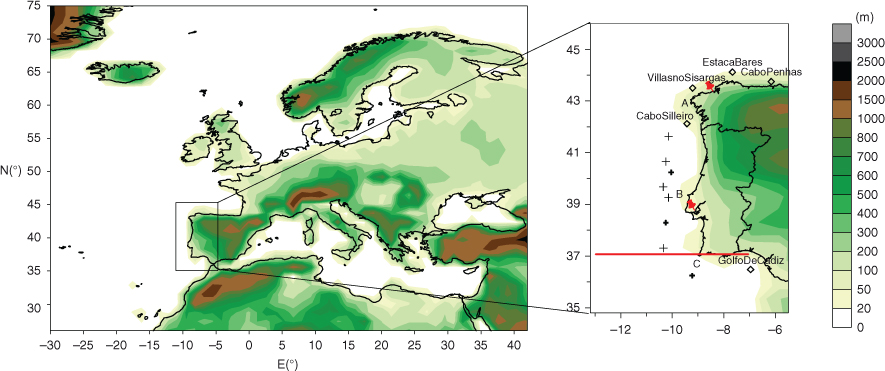
Fig. 1
WRF model domain (contours from the model domain overlaid by current coast line). Solid red line marks the area of the cross-section at 37.05°N (illustrated in Fig. 7), pins mark the location of the radiosondes, lozenges pinpoint the ocean buoys and all crosses indicate the points used in Fig. 10 and bold crosses locate where the maximum frequency of occurrence is observed (illustrated in Fig. 9). (A) Cape Finisterra, (B) Cabo Carvoeiro and (C) Cabo São Vicente.
Table 1. Global error statistics of surface wind
Wind speed0.080.351.941.9826.1031.512.572.610.670.60U−0.060.512.292.8253.0768.03.183.740.840.76V0.440.052.261.9244.8973.33.092.590.860.76
Table 2. Global statistics of vertical wind and temperature profiles
LocalTime UTCWind (m s−1)T (°C)Wind (m s−1)T (°C)Wind (%)T (%)Wind (m s−1)T (°C)
Lisbon120.060.623.491.7834.616.74.772.95La Coruña00.410.654.172.134.520.95.544.48120.670.654.122.0635.720.55.594.56
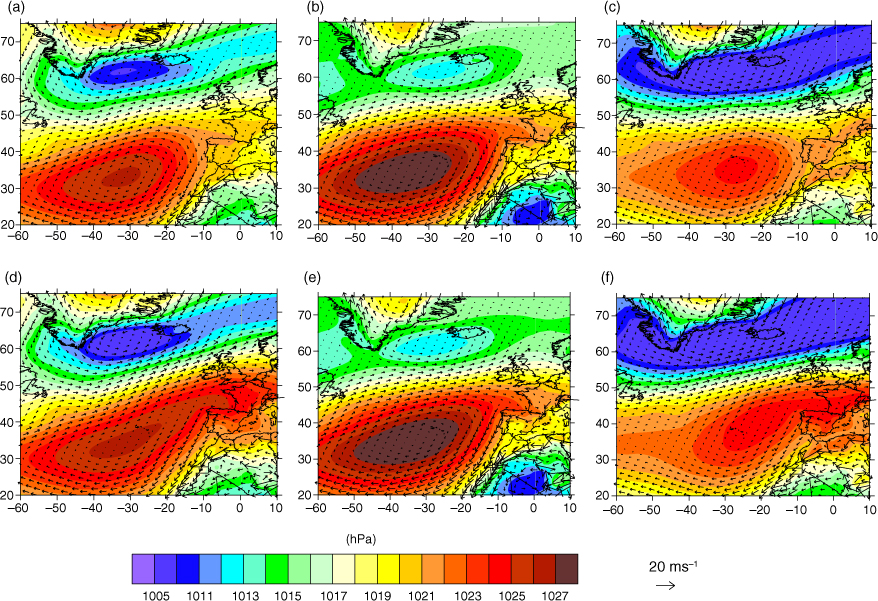
Fig. 2
North Atlantic, ERA-Interim synoptic configurations for (a) MAM, (b) JJA and (c) SON and for days when CCLJ are detected offshore of Iberia (d) MAM, (e) JJA and (f) SON. Mean sea-level pressure in contours and wind in vectors.
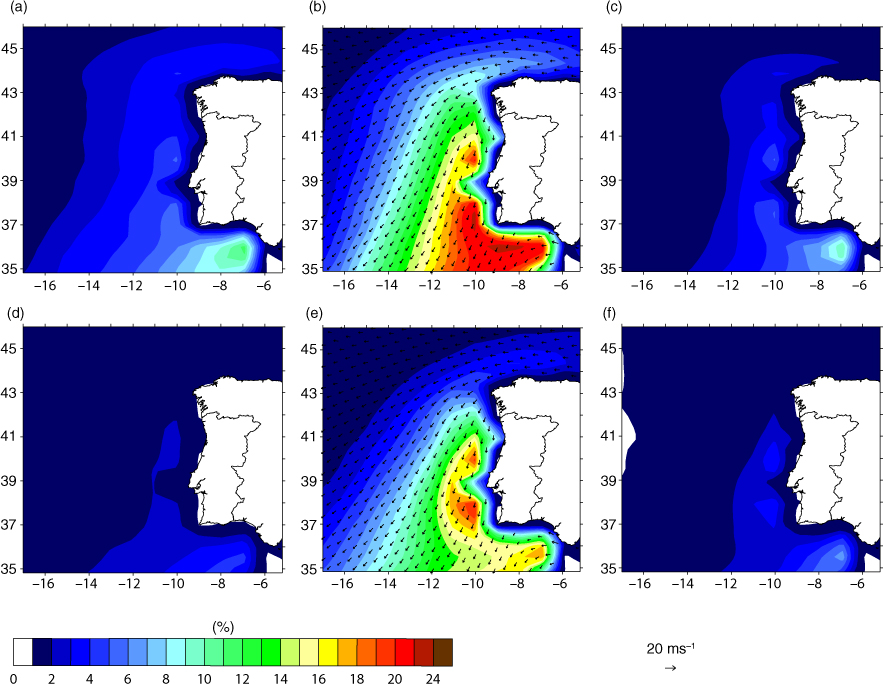
Fig. 3
Maps of seasonal hourly CLLJ frequency of occurrence (%) for ERA-Interim downscaling (a) MAM, (b) JJA and (c) SON, and for historic reference (d) MAM, (e) JJA and (f) SON.
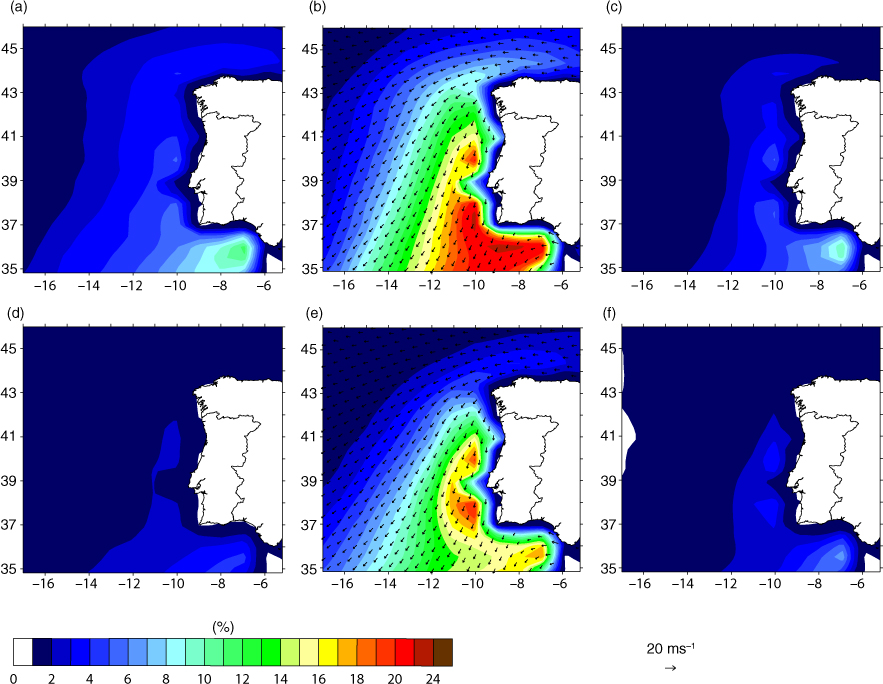
Fig. 4
CLLJ statistics of ERA-Interim and historic reference for summer (JJA): (a) jet height histogram (%), (b) jet wind speed histogram (%), (c and d) jet wind rose, (e and f) jet height-wind histogram (%) and (g and h) surface wind speed when jet occurs.
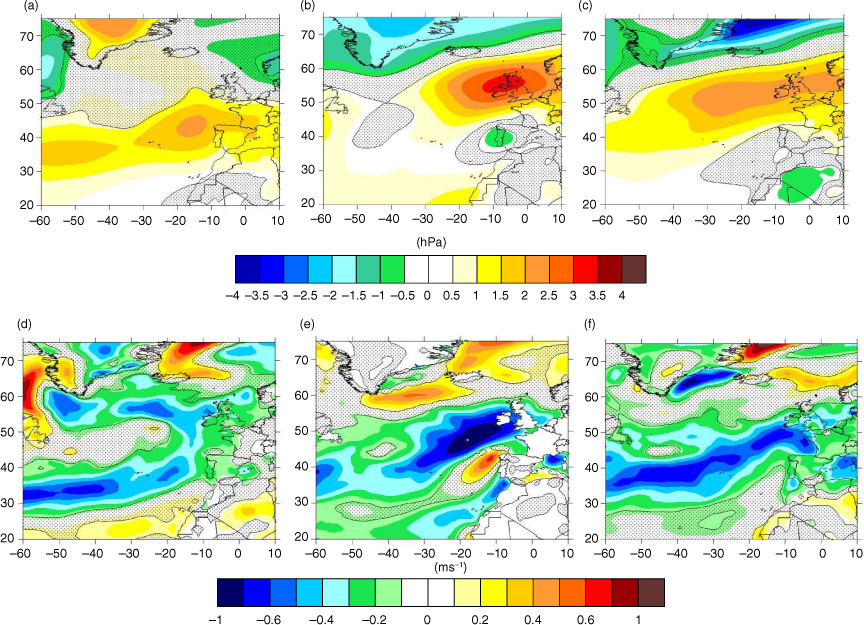
Fig. 5
Anomalies (2071–2100 minus 1971–2000) of the synoptic configurations associated with the occurrence of low-level jets. Mean sea-level pressure anomalies for (a) MAM, (b) JJA and (c) SON season and anomalies of surface wind speed for (d) MAM, (e) JJA and (f) SON season. Shaded areas specify changes not statistically significant using a Student's t-test at the 75% confidence level.
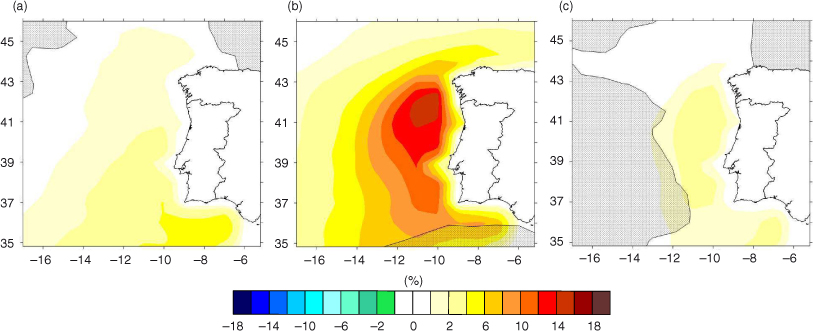
Fig. 6
Maps of anomalies (future – historic reference) of seasonal hourly CLLJ frequency of occurrence (%) (2071–2100 minus 1971–2000), (a) MAM, (b) JJA and (c) SON. Shaded areas specify changes not statistically significant using a Student's t-test at the 90% confidence level.
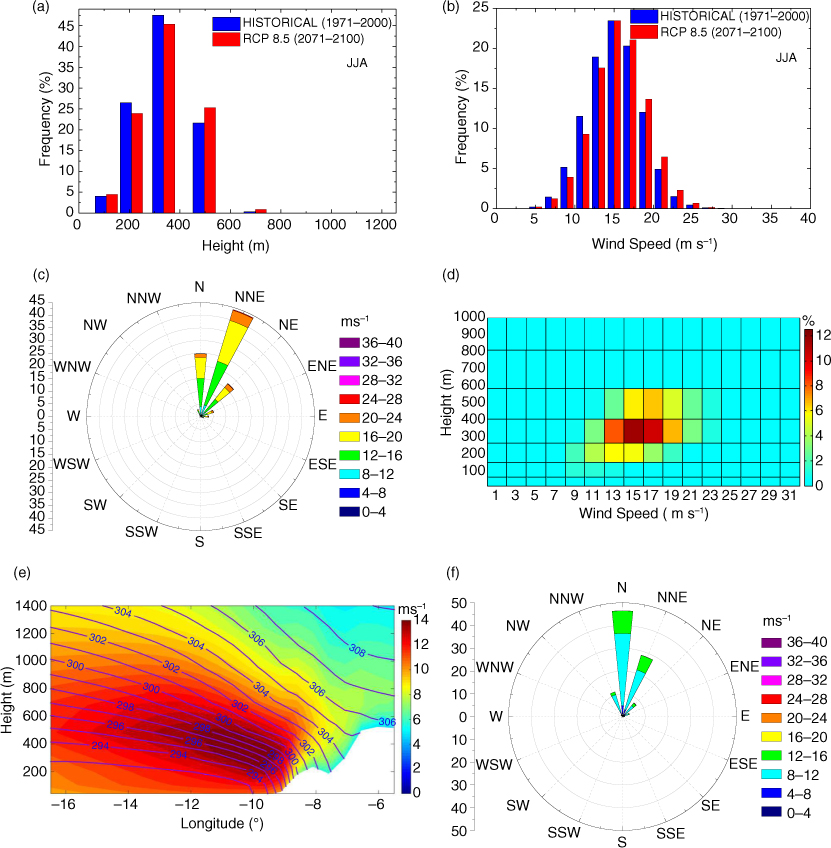
Fig. 7
Future CLLJ statistics (RCP8.5) for summer (JJA): (a) jet height histogram (%), (b) jet wind speed histogram (%), (c) jet wind rose, (d) jet height-wind histogram (%), (e) east–west cross section (illustrated in Fig. 1) at 37.05°N, colours for mean wind speed (m s−1) and isentropes (K) and (f) surface wind speed when jet occurs.
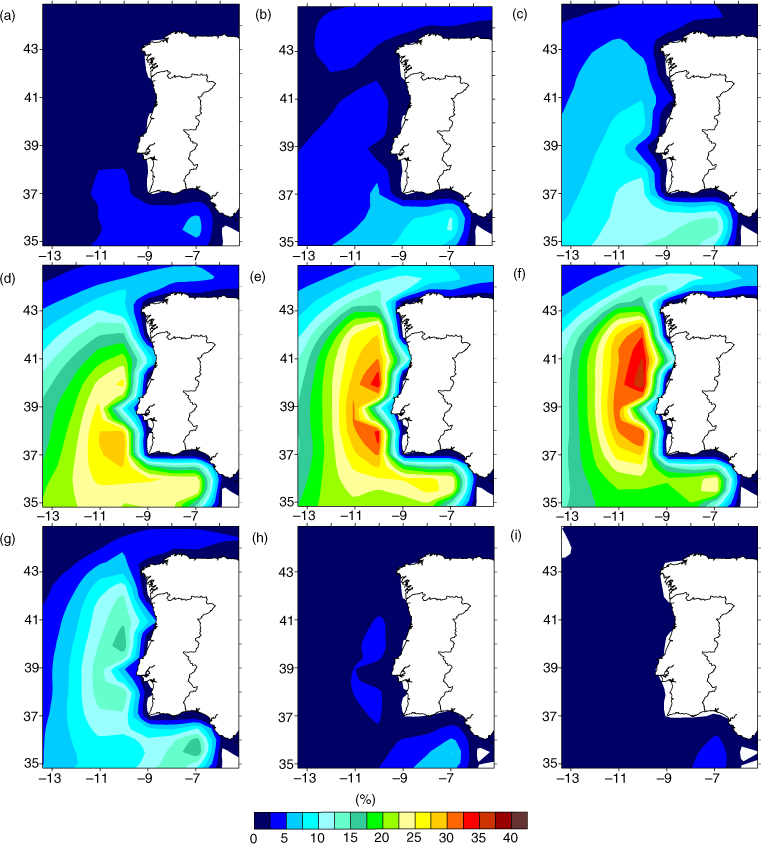
Fig. 8
Maps of monthly mean frequency of future CLLJ occurrence (%) for (a) March, (b) April, (c) May, (d) June, (e) July, (f) August, (g) September, (h) October and (i) November.
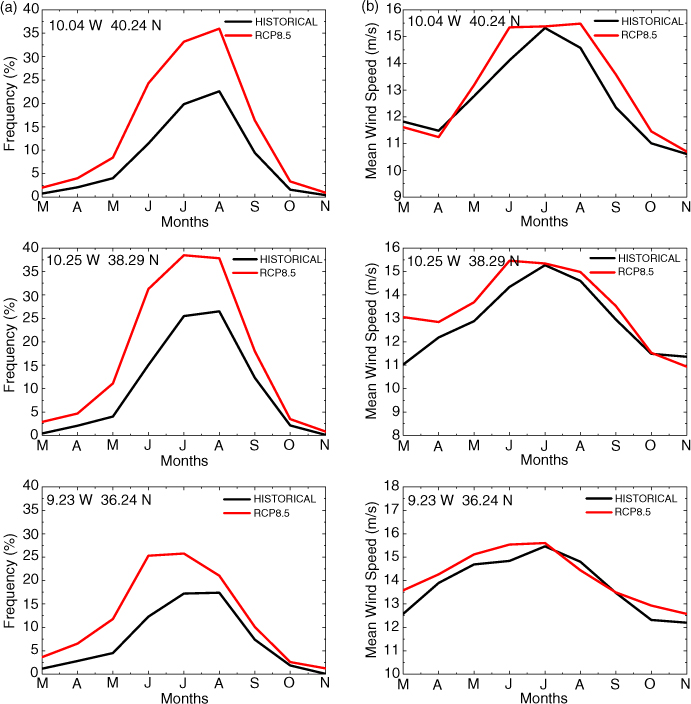
Fig. 9
Present (historic reference) and future (RCP8.5) climate (a) mean monthly frequency of occurrence (%) and (b) mean monthly wind speed (m s−1), from March to November, both for three different geographical locations, for the 30 yr.
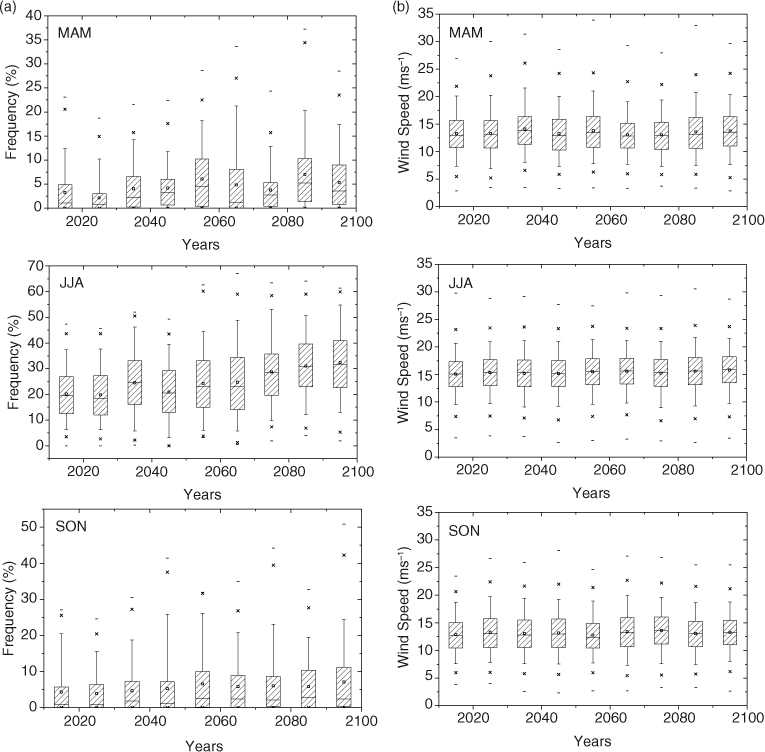
Fig. 10
Decadal tendency in the 21st century of (a) jet frequency of occurrence and (b) jet wind speed. Individual boxes span from the 25th to the 75th percentile, with the median represented by a straight line and the average by a floating square. The 99th and 1st percentiles are denoted by crosses, with the maximum and minimum indicated by a dash.