
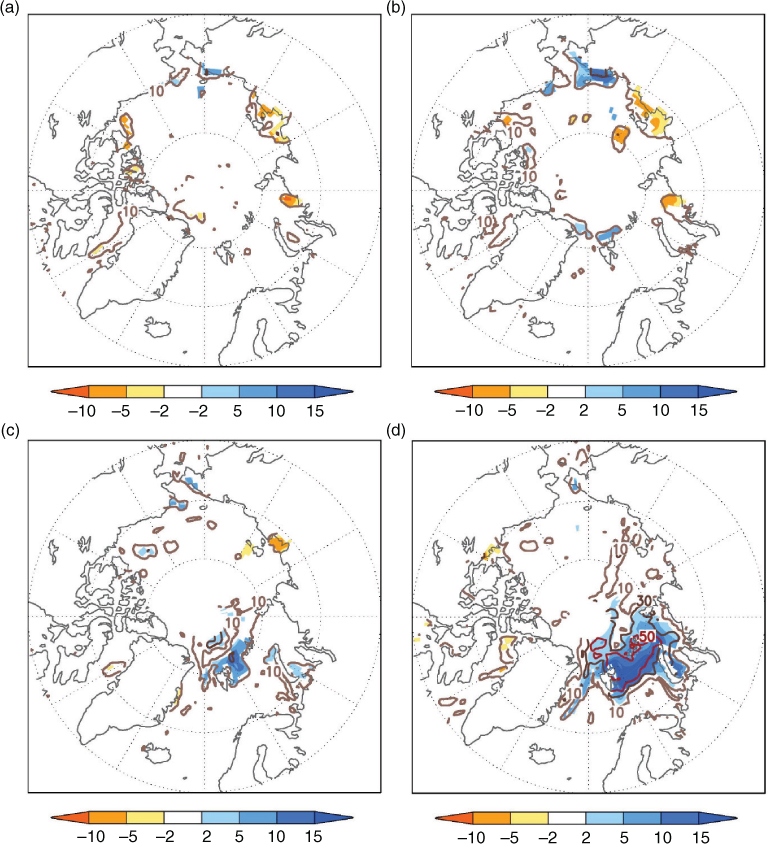
Fig. 1
Colour shading shows regressions of sea ice concentration (SIC, %) in (a) August, (b) September, (c) October, (d) November, on BK SIC time series in November. Shading in all panels also indicates areas with 95 % significance level. Contour lines indicate percentage of explained variance in SIC of the same months for November SIC. Original data from NSIDC.
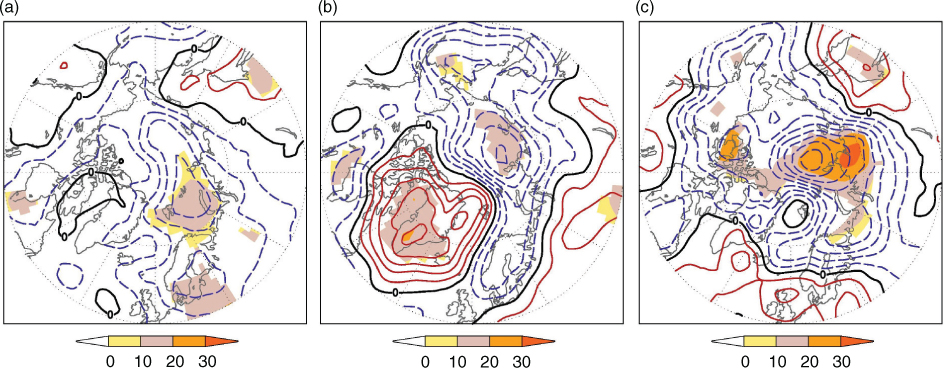
Fig. 2
Contours show regressions of sea-level pressure in (a) August, (b) September, (c) October, on BK SIC time series in November. Contour interval (CI) = 0.3 hPa. Solid (dashed) lines indicate positive (negative) values. Shading indicates percentage of explained variance in SLP as well as areas with 95 % significance level. Original data from NCEP/NCAR Reanalysis and NSIDC.
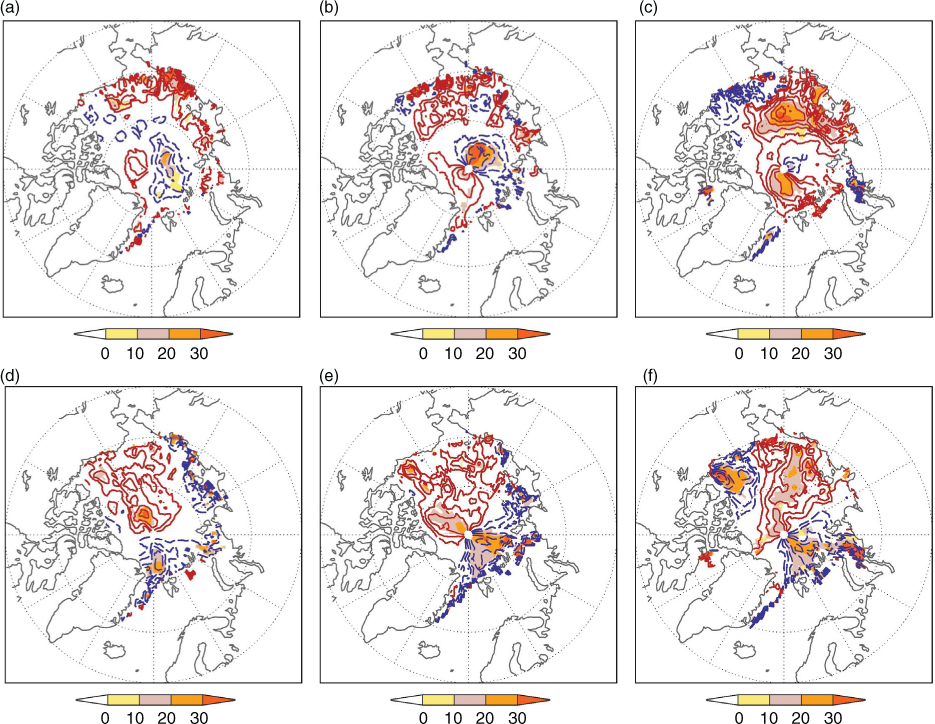
Fig. 3
Regressions of sea ice drift velocities (CI=2 cm/s) in August (left), September (middle) and October (right) on BK SIC in November, solid (dashed) lines indicate positive (negative) values. Top row shows zonal drift velocity; bottom row meridional drift velocity. Shading indicates percentage of explained variance in drift velocity, as well as areas with 95 % significance level. Original data from NSIDC.
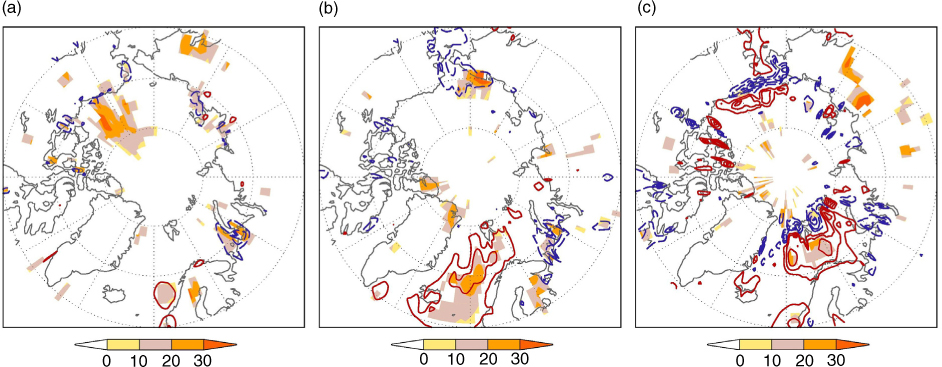
Fig. 4
Regressions of surface turbulent heat flux (CI=5 W/m2, positive upwards) in (a) August, (b) September, and (c) October on BK SIC in November; solid (dashed) lines indicate positive (negative) values. Shading indicates percentage of explained variance in turbulent heat flux, as well as areas with 95 % significance level. Original data from NCEP/NCAR Reanalysis and NSIDC.
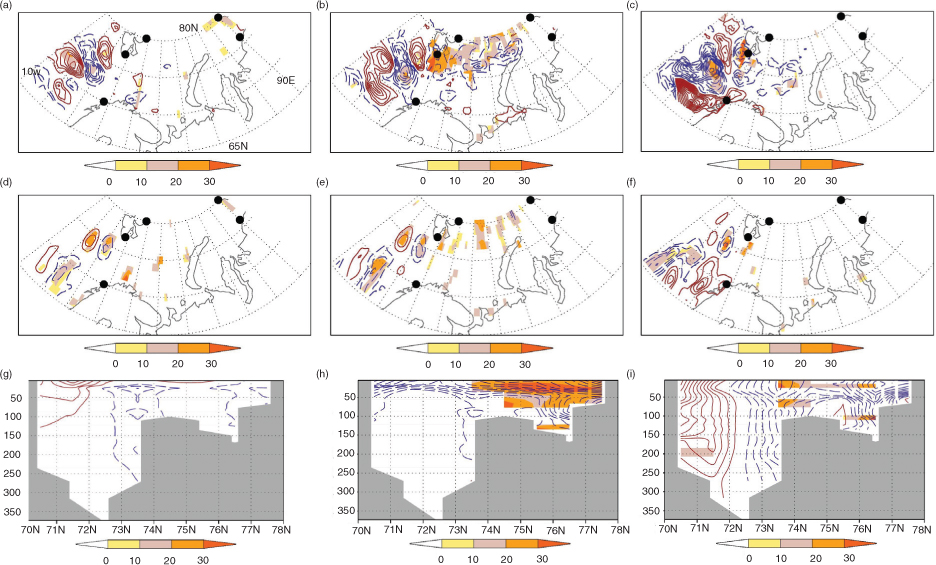
Fig. 5
Regressions of vertically integrated zonal (top), meridional (middle) heat transport at each grid cell (CI=0.5e14 W) on November BK SIC time series. Bottom panel is the same but for zonal heat flux (CI=0.5e6 W/m2) on the 18.5 °E plane. Left, middle and right panels for August, September and October, respectively. Solid (dashed) lines indicate positive (negative) values. Shading indicates percentage of explained variance, as well as areas with 95 % significance level. Original data from ECMWF-ORAS4 and NSIDC.