
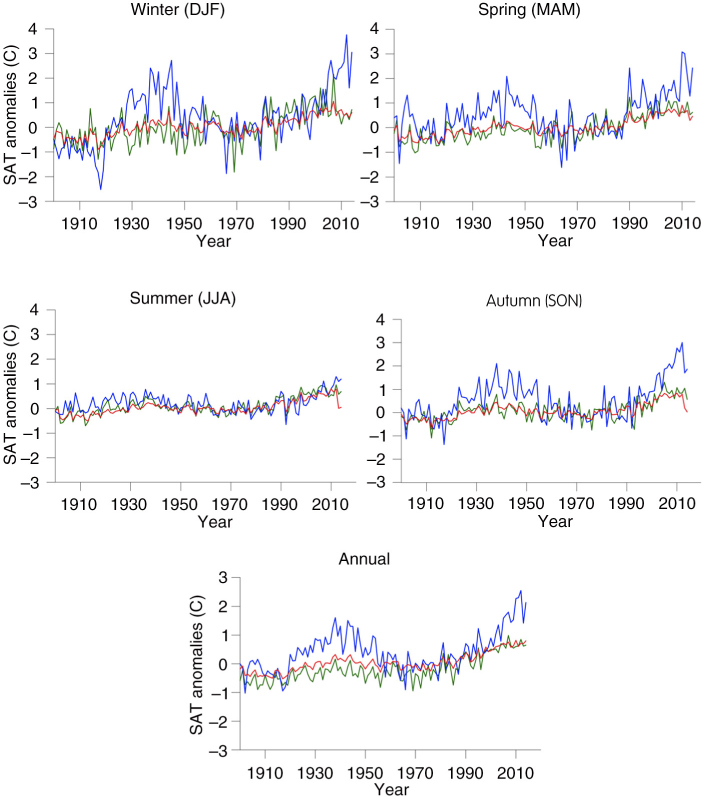
Fig. 1
Seasonal and annual SAT anomalies relative to the reference period 1961–1990, averaged over three latitudinal zones: mid-latitudes (40–65°N) – green; Arctic (65–90°N) – blue; and Northern Hemisphere (0–90°N) – red.
{ label needed for table-wrap[@id='T0001'] }
Table 1. Absolute maximum (+) SAT anomalies (C) for year when registered
40–65°N2.15; 20071.24; 19900.96; 20121.31; 20050.99; 200765–90°N3.76; 20123.08; 20101.29; 20123.01; 20122.54; 20120–90°N1.06; 20070.75; 20070.79; 20120.84; 20100.72; 2010
{ label needed for table-wrap[@id='T0002'] }
Table 2. Seasonal and annual SAT trends (C/100yr) averaged over 1900–2014
40–65°N1.171.090.680.700.9765–90°N1.721.020.290.980.990–90°N0.860.810.590.630.77
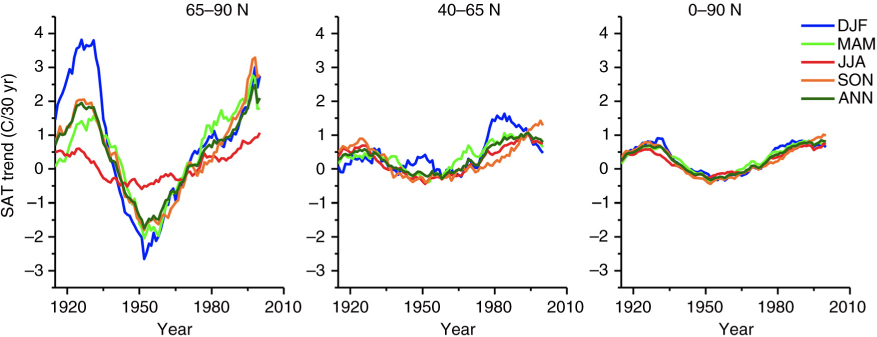
Fig. 2
Seasonal and annual successive 30-yr linear SAT trends for three latitude zones: mid-latitudes (40–65°N); Arctic (65–90°N); and Northern Hemisphere (0–90°N) for four seasons and annual. The 30-yr moving trends are computed at 1-yr increments; the x-axis indicates the middle year of 30-yr period, e.g. 1954 indicates 1940–1969, and so on.
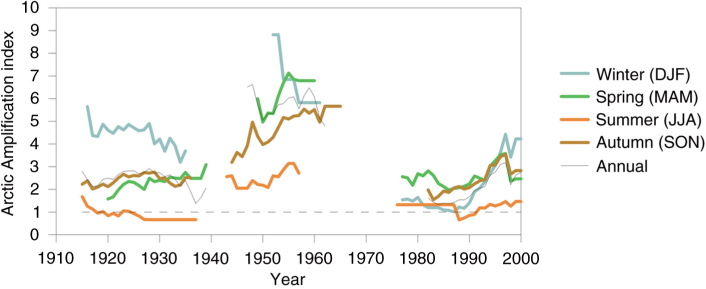
Fig. 3
Time evolution of the Arctic Amplification Index (AAI) for four seasons. AAI is a ratio between 30-yr linear trends for the Arctic (65–90°N) and Northern Hemisphere (NH) SAT. The index is calculated only for the years when both NH and Arctic trends are significant at the 95 % confidence level. Dotted line indicates AAI = 1, no amplification: Arctic SAT trends are equal to the NH trends. The 30-yr moving AAI is computed at 1-yr increments; the x-axis indicates the middle year of 30-yr period, e.g. 1954 indicates 1940–1969, and so on.
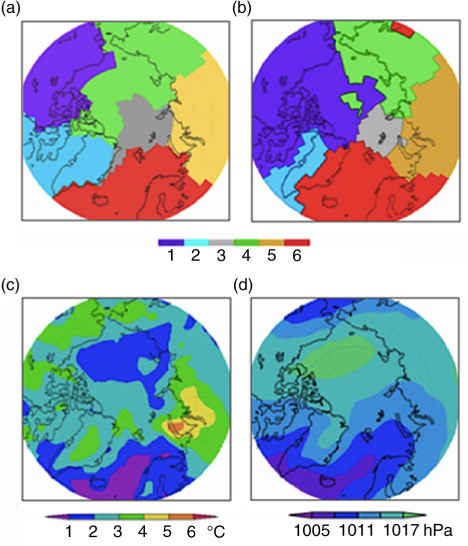
Fig. 4
Maps showing six Arctic regions defined by hierarchical cluster analysis using Annual average SATs from (a) ERA-40 reanalysis and (b) NansenSAT. Long-term mean (c) SAT standard deviation and (d) mean sea-level pressure from ERA-40 data.
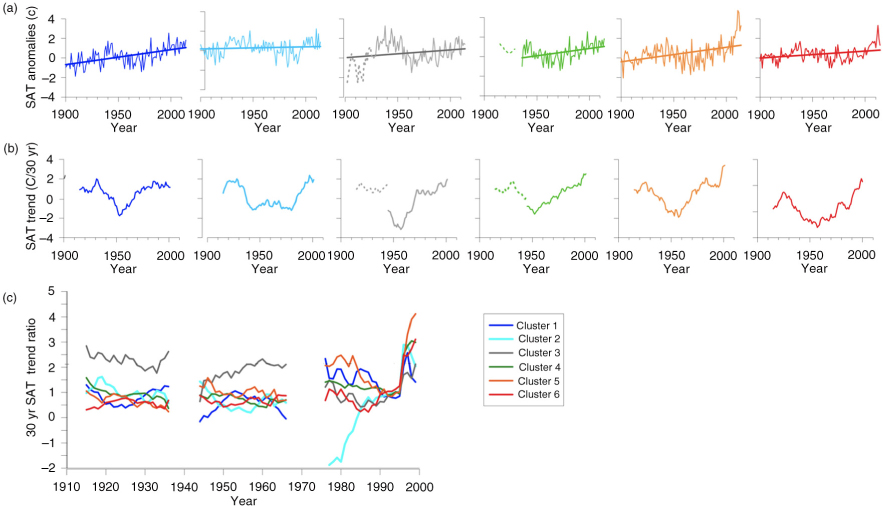
Fig. 5
(a) Annual SAT anomalies 1900–2014 and their linear trends for each cluster; (b) 30-yr moving trends in annual SAT; (c) ratio between 30-yr moving trends in annual SAT for each cluster and the entire Arctic region. In (b) and (c), the x-axis indicates the middle year of 30-yr trends, e.g. 1954 indicates 1940–1969, and so on. For the clusters where the data coverage is less than 50 %, SAT anomalies and trends are shown with dotted lines.
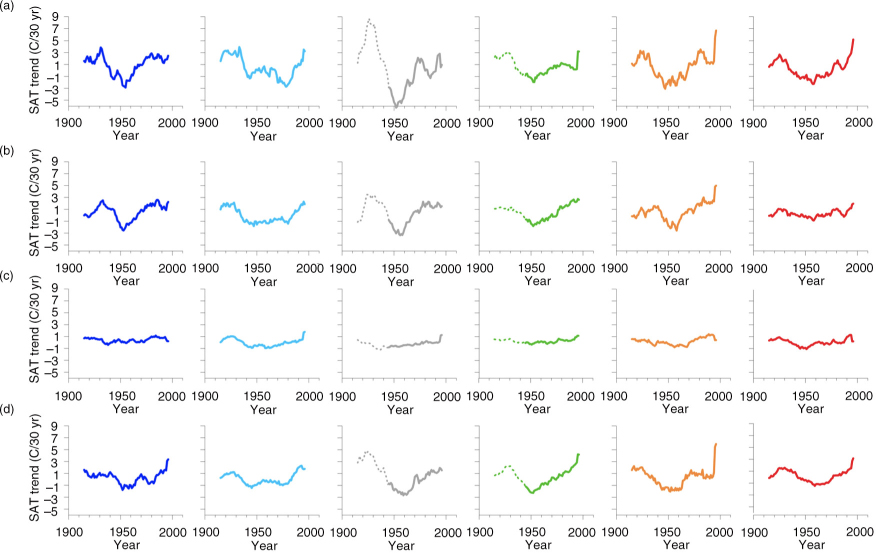
Fig. 6
Thirty-years moving trends as in Fig. 5b, but seasonally: (a) winter (DJF), (b) spring (MAM), (c) summer (JJA) and (d) autumn (SON).
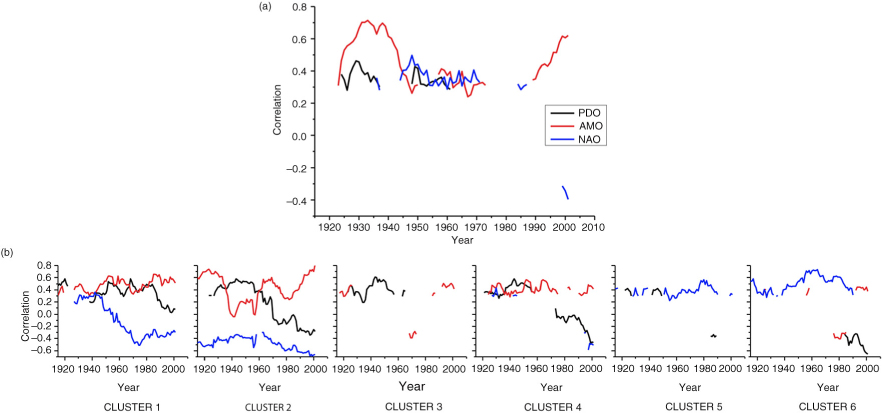
Fig. 7
Running 30-yr correlation between annual SAT and annual climate indices. The indices are the Pacific Decadal Oscillation (PDO), Atlantic Multidecadal Oscillation (AMO), and North Atlantic Oscillation (NAO). Only correlations greater than|0.3|which are significant at the 95 % confidence level (α<0.05) are shown. (a) Running 30-yr correlation between annual SAT averaged over the region 65–90°N and annual climate indices; (b) running 30-yr correlation between annual SAT and annual climate indices for six Arctic regions (1–6); the x-axis indicates the middle year of 30-yr trends, e.g. 1954 indicates 1940–1969, and so on.