
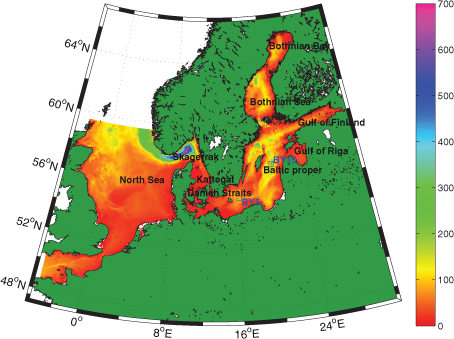
Fig. 1
Model domain, showing depth in metres, names of subregions and the location of the hydrographic stations BY5 and BY15.
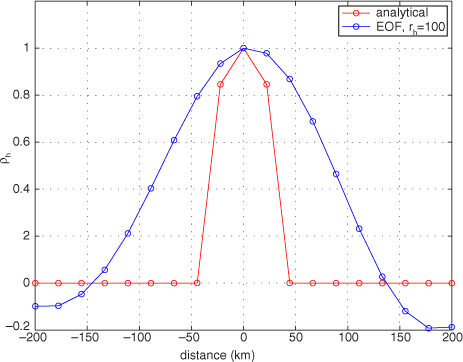
Fig. 2
Analytical and EOF approximation of the horizontal localization function. The figure shows a cross-section through the centre point. The number of horizontal EOF modes is 100.
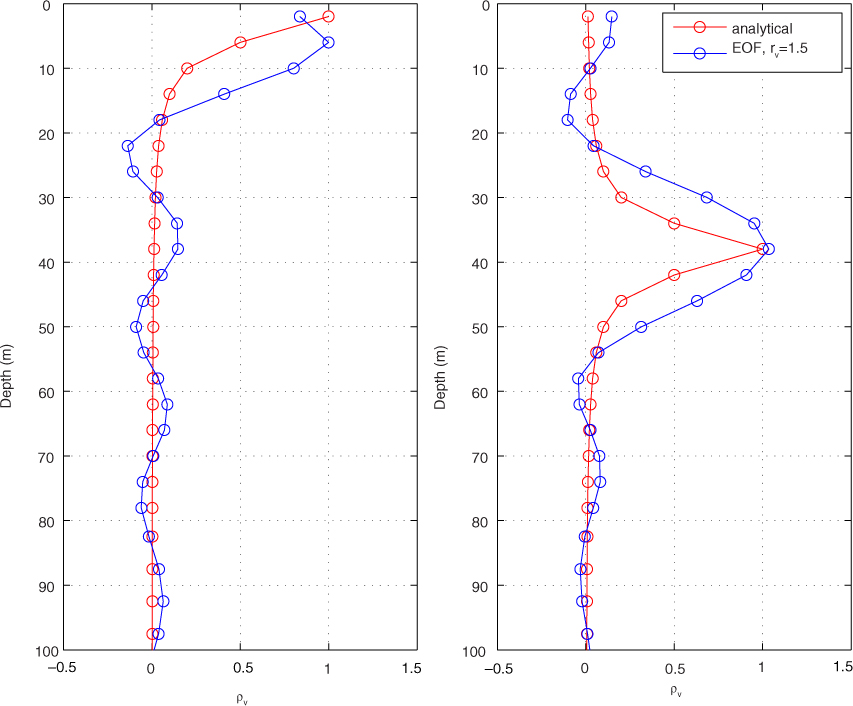
Fig. 3
Analytical version and EOF approximation of the vertical localization function for (left panel) level 1 and (right panel) level 10. The number of vertical EOF modes is 15.
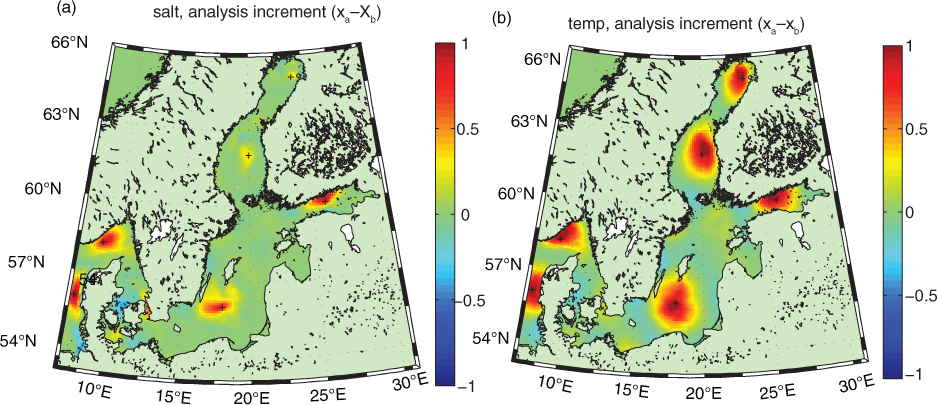
Fig. 4
Result from assimilating six synthetic observations of (a) SSS and (b) SST. The observation locations are indicated with crosses (+).
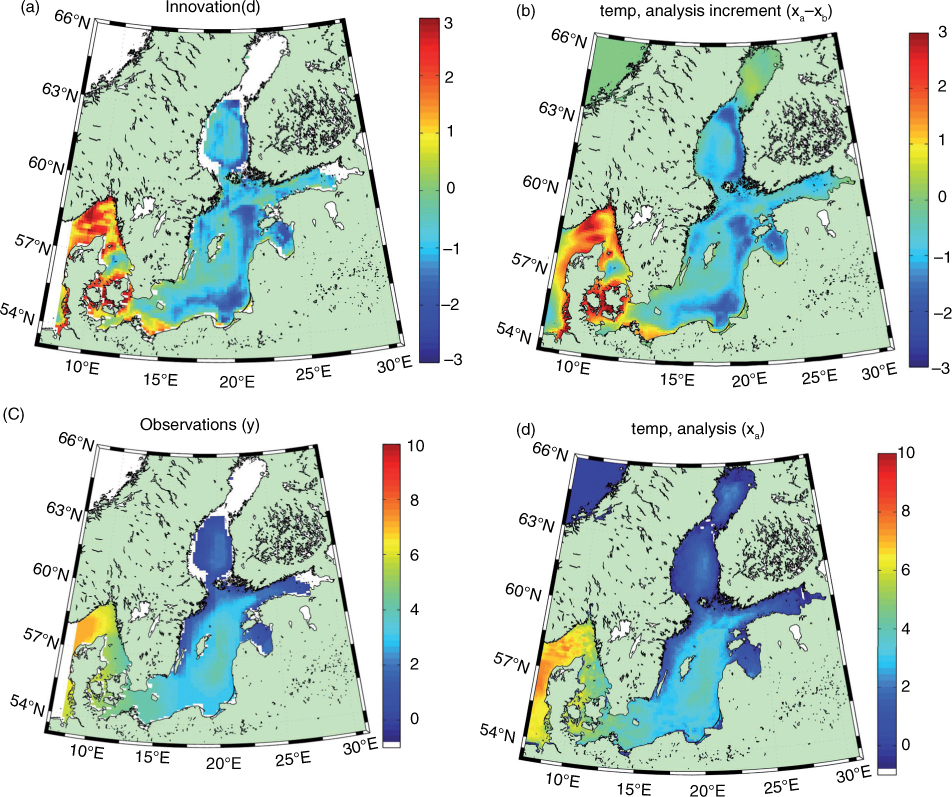
Fig. 5
Experiment of assimilating a real SST field, in terms of (a) innovation, (b) assimilation increment, and (c) observations and (d) analysis.
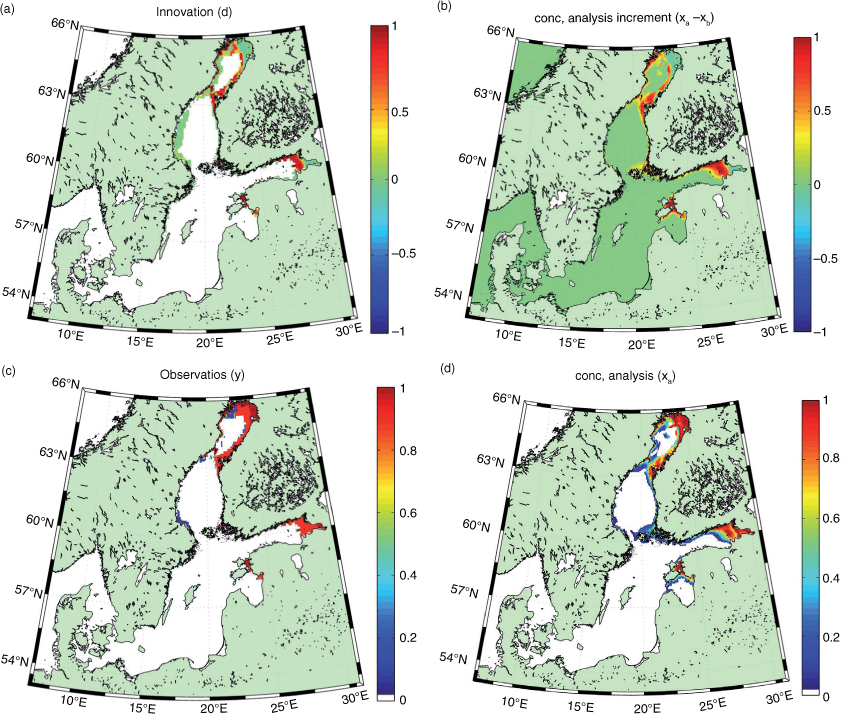
Fig. 6
Experiment of assimilating a real SIC field, in terms of (a) innovation, (b) assimilation increment, and (c) observations and (d) analysis.
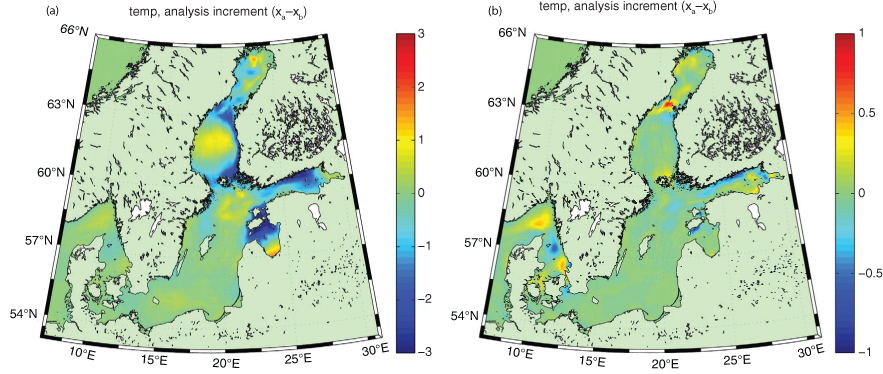
Fig. 7
Changes in (a) SST and (b) SSS as a result of assimilating SIC.
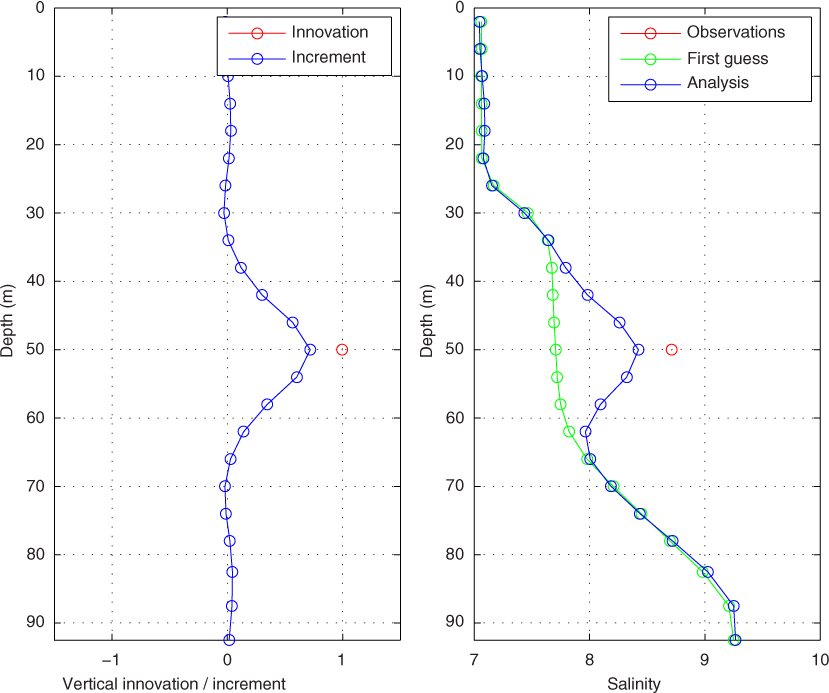
Fig. 8
The result of a single-observation experiment for salinity at 50 m depth with an innovation of +1.0.
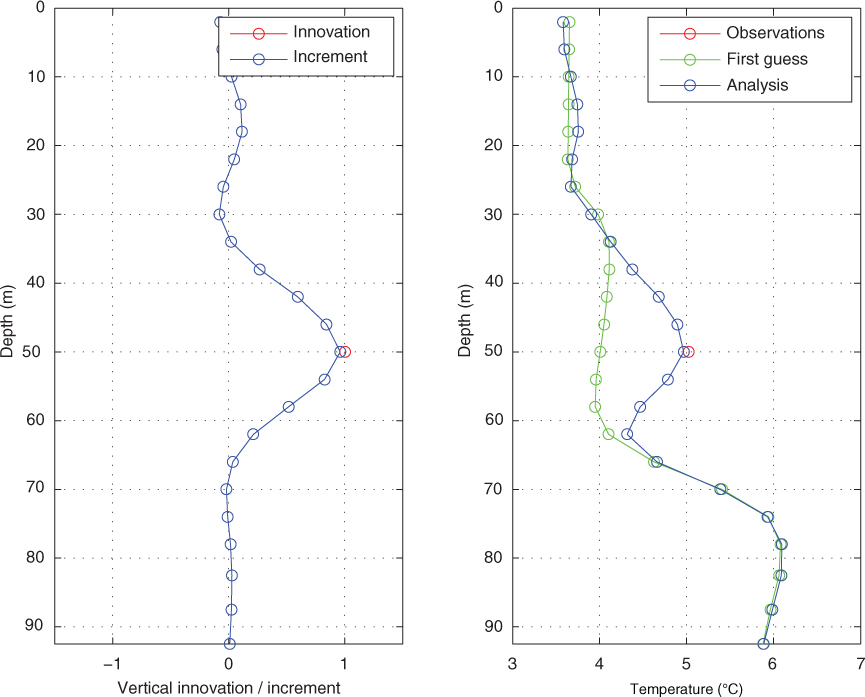
Fig. 9
The result of a single-observation experiment for temperature at 50 m depth with an innovation of +1.0 °C.
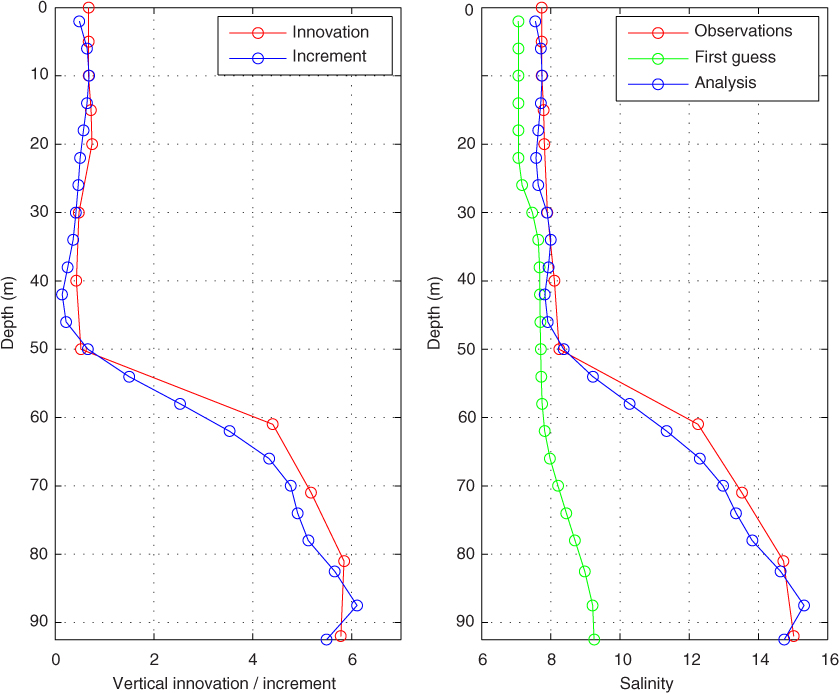
Fig. 10
Experiment of assimilating a real salinity profile. The left panel shows the innovation profile and the resulting increment profile, and the right panel shows the observations, the first guess and the results of the assimilation.
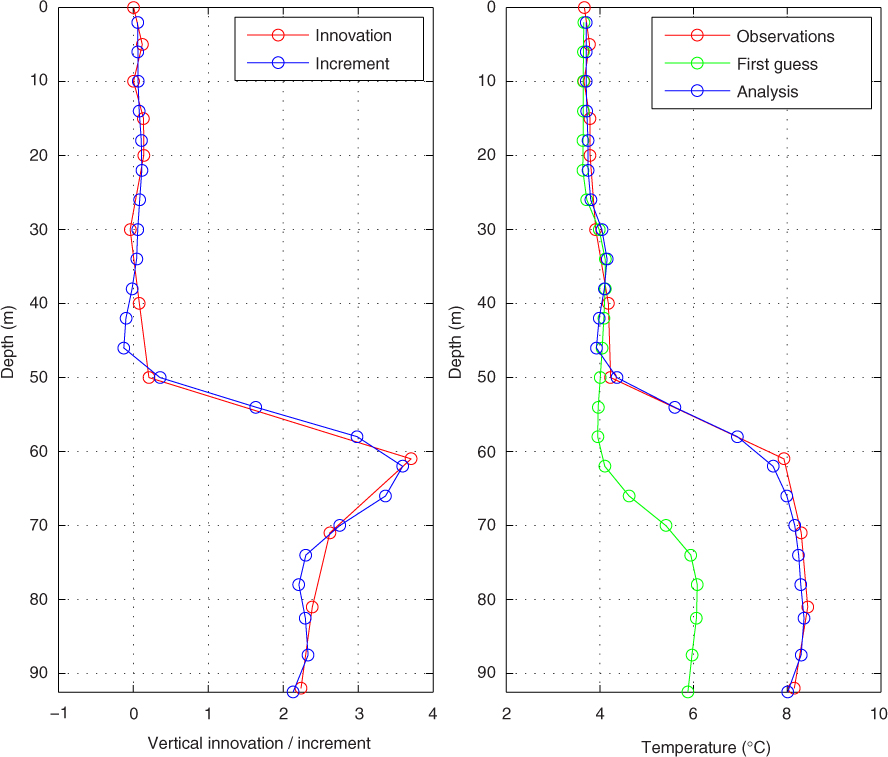
Fig. 11
Experiment of assimilating a real-temperature profile. The left panel shows the innovation profile and the resulting increment profile, and the right panel shows the observations, the first guess and the results of the assimilation.
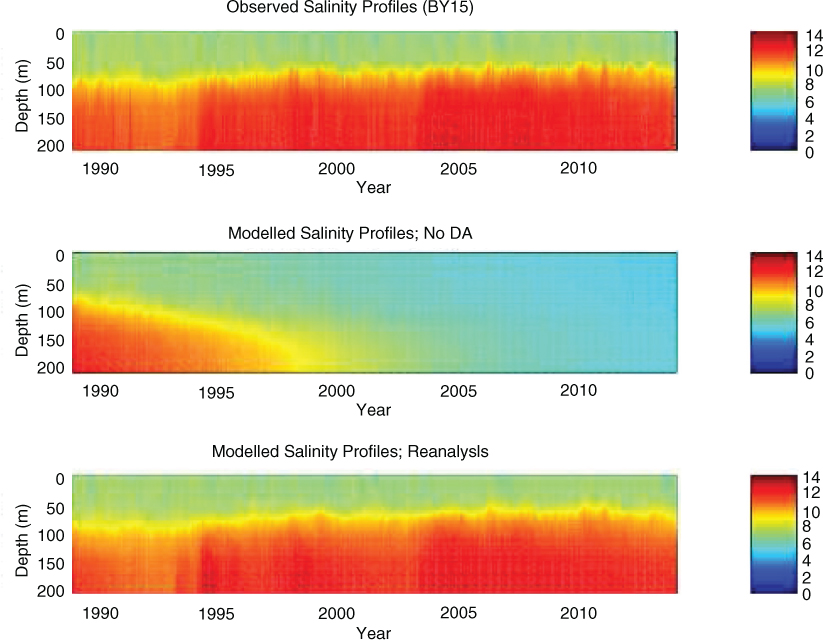
Fig. 12
Salinity profiles at station BY15, according to (a) observations, (b) a free run (without data assimilation) and (c) the reanalysis (with data assimilation). The data are sampled once a month.
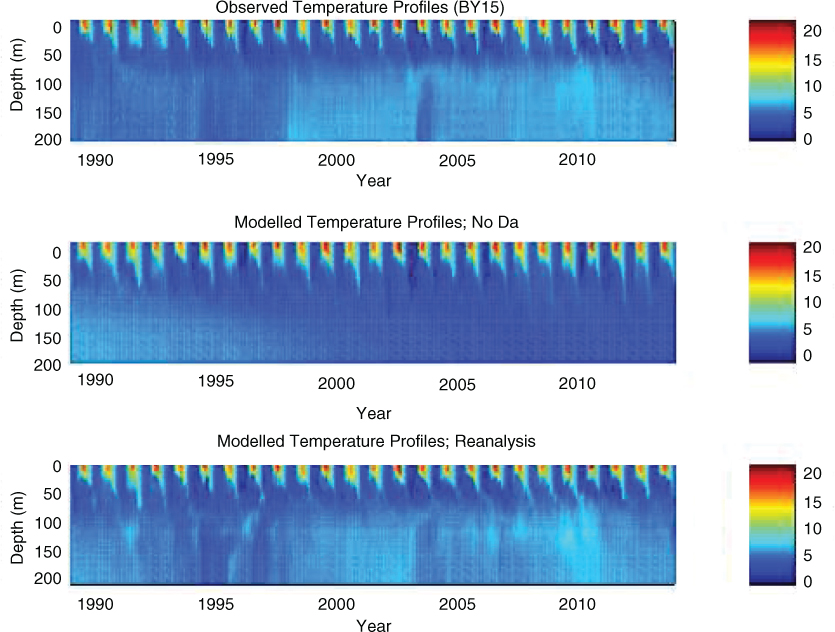
Fig. 13
Temperature profiles at station BY15, according to (a) observations, (b) a free run (without data assimilation) and (c) the reanalysis (with data assimilation). The data are sampled once a month.
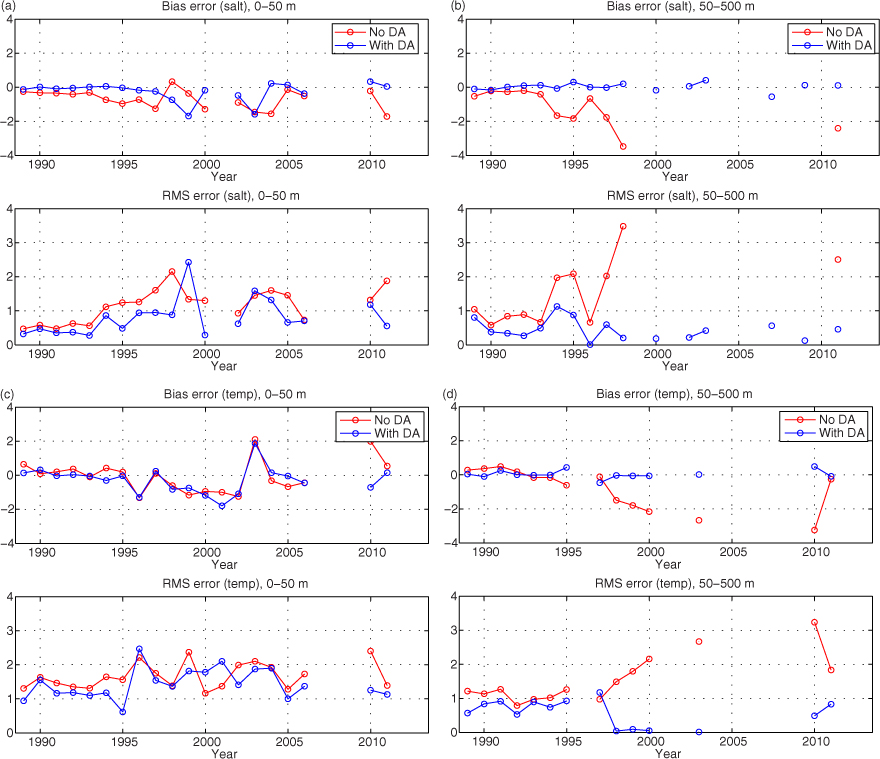
Fig. 14
Bias and rms errors from two 25-yr simulations, a free simulation (‘No DA’) and a reanalysis run (‘With DA’). The panels show (a) near-surface salinity (0–50 m), (b) subsurface salinity (50–500 m), (c) near-surface temperature (0–50 m) and (d) subsurface temperature (50–500 m).