
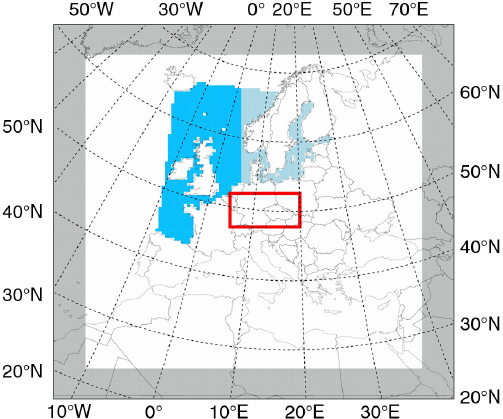
Fig. 1
Integration domain of CCLM (whole area) including the sponge zone (grey area), TRIMNP (blue & light blue), and CICE (light blue). Central Europe is marked by the red rectangular area.
Table 1. Sensitivity experiments (EXPS) using different sea surface temperature (SST) data for the coupling area, and the restart conditions on 1 July 1997 to simulate the Oder flood extreme event
UNCPLERA-IntUNCPLCPLTRIMNPCPLUNCPL_SSTCPLCPLUNCPLUNCPL_resCPLERA-IntCPLUNCPL_SST_resCPLCPLCPL
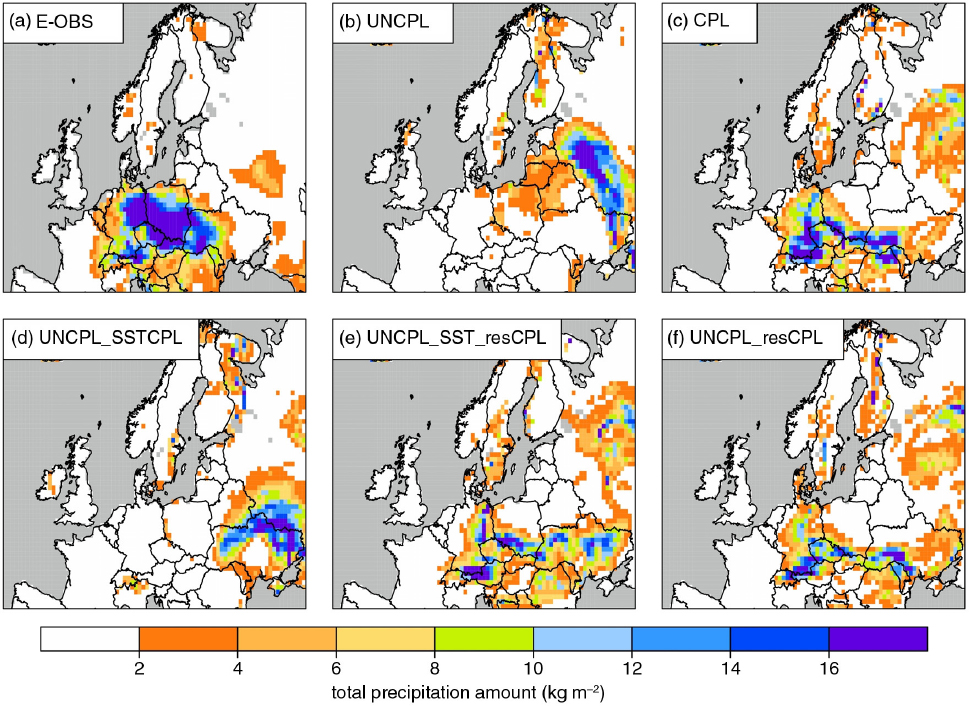
Fig. 2
Mean precipitation (mm/day) of E-OBS data and the various experiments averaged for 18–20 July 1997. All panels show only a section of the integration domain focusing on Central Europe.
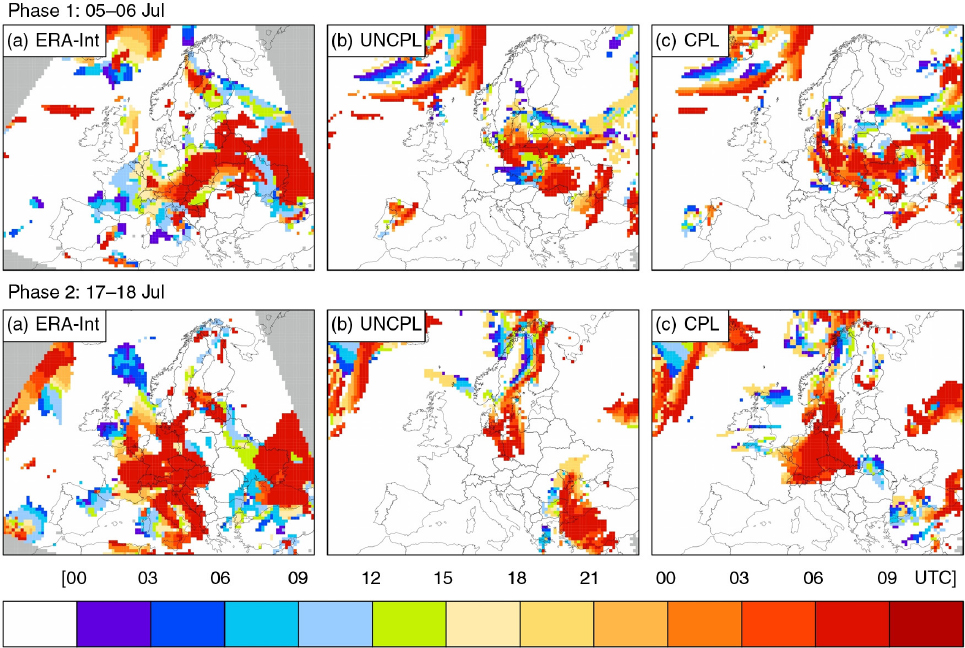
Fig. 3
Time evolution of the precipitation of (a) ERA-Int data, (b) uncoupled (UNCPL) and (c) coupled (CPL) experiments at the beginning of the two phases 5–6 July (top panel) and 17–18 July 1997 (bottom panel). The colour shows the 3-h step from 00:00 UTC on the first day to 09:00 UTC on the second day, if the 3-h rainfall exceeds the 90th percentile at each step. All panels focus on the European part of the integration domain.

Fig. 4
Daily mean differences between the CPL and UNCPL for the surface temperature (K) (filled colour) and 500 hPa geopotential height (m) (contours) from 17 to 20 July 1997. Contours show values in a range of [–1200, 1200] with an interval of 200 m. Dashed contours for negative values and solid contours for positive values.

Fig. 5
(a) Relative difference (%) of average soil moisture within the upper six soil layers (until a soil depth of 0.7 m) and (b) T_S differences (K) between the CPL and UNCPL at the beginning of 1 July 1997.
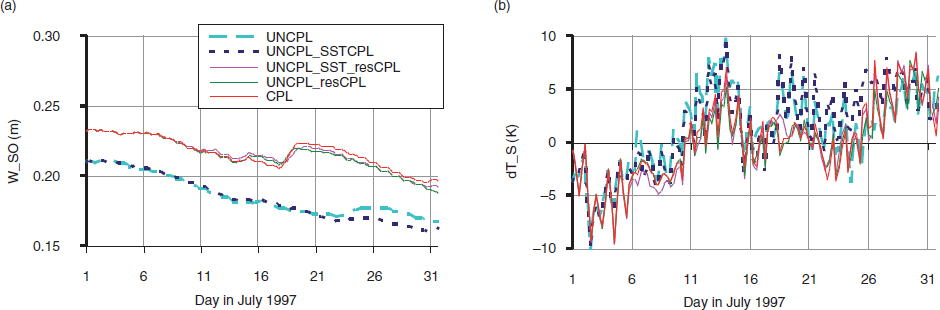
Fig. 6
(a) Area averaged soil moisture (m) summed up for six uppermost levels of the various experiments over Central Europe in July 1997 and (b) difference of simulated daily surface temperature against ERA-Int data over Central Europe in July 1997.

Fig. 7
(a) Monthly mean of precipitation (mm/month) of the UNCPL, CPL and E-OBS data averaged over Central Europe for January 1996–December 1997; (b) Differences between the CPL and UNCPL for precipitation (mm/day) (bars: blue for positive values, orange for negative values) and for the soil moisture (m) summed up for six uppermost levels (brown solid line). Data are averaged over Central Europe for 1 May–31 July 1997.
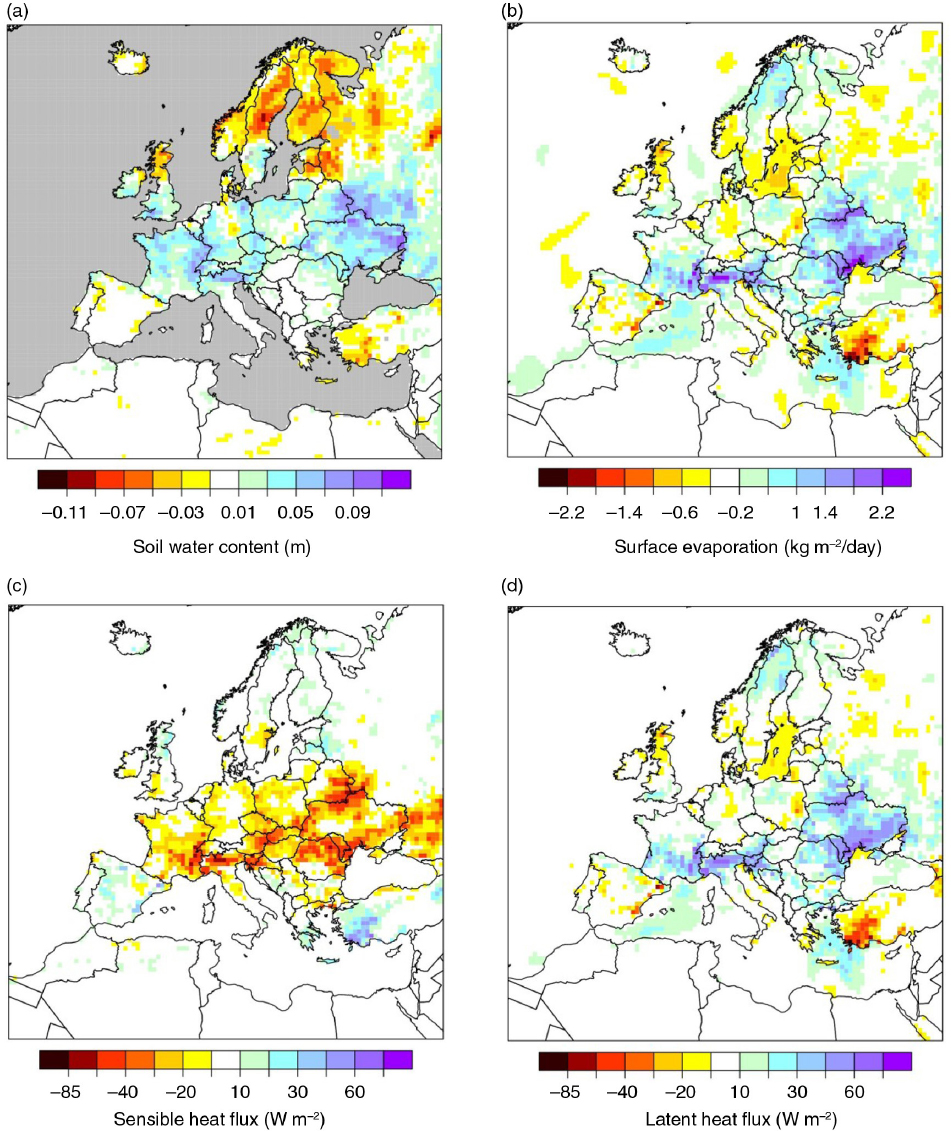
Fig. 8
Differences between the CPL and UNCPL for (a) the six uppermost levels of soil moisture (m), (b) surface evaporation (positive upward) (kg m−2/day), (c) sensible heat flux (positive upward) (W m−2) and (d) latent heat flux (positive upward) (W m−2). Data are averaged for 1–17 July 1997.
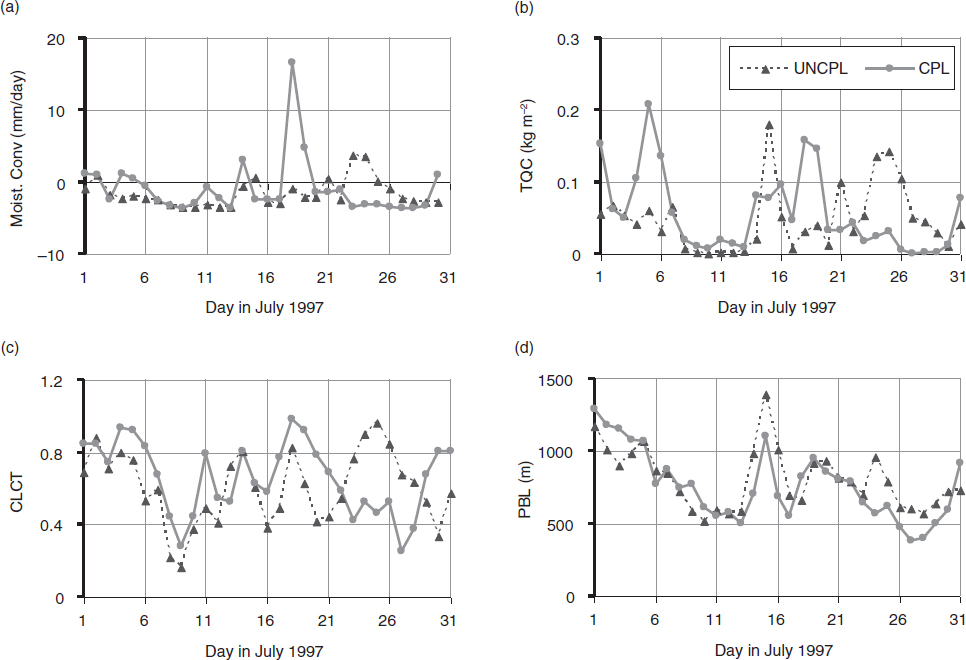
Fig. 9
Daily variation of (a) moisture convergence (mm/day), (b) the vertical integrated cloud water (kg m−2), (c) the total cloud cover and (d) the planetary boundary-layer thickness (m) of the UNCPL and CPL averaged over Central Europe for July 1997.
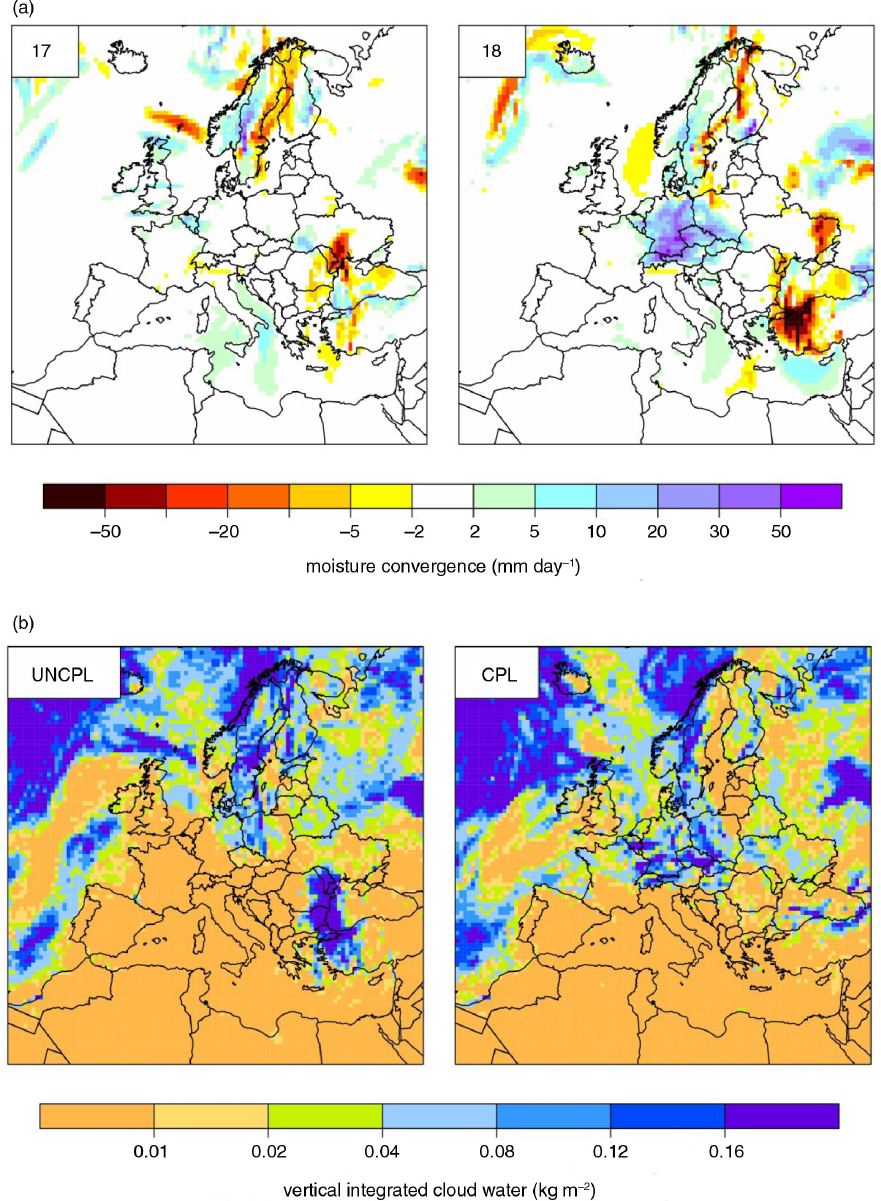
Fig. 10
(a) Moisture convergence (mm/day) differences between the CPL and UNCPL for 17 and 18 July 1997; (b) Averaged daily vertical integrated cloud water (kg m−2) of the UNCPL and CPL for 17–18 July 1997.
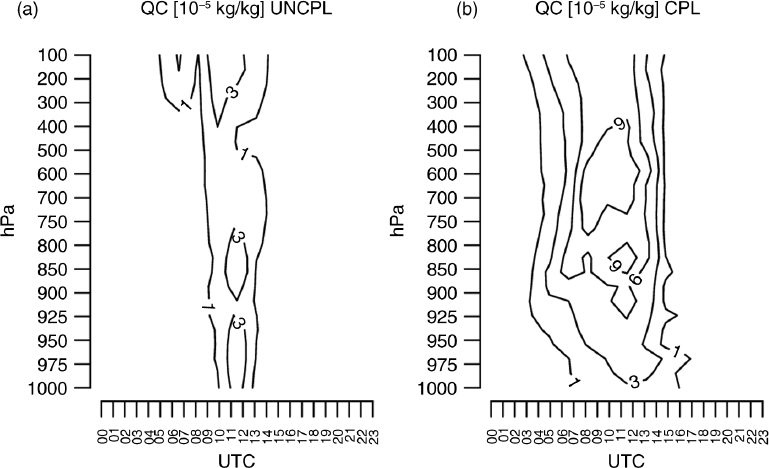
Fig. 11
Vertical distribution (pressure in hPa) of cloud water content QC (10–5 kg/kg) over time (UTC) of (a) the UNCPL and (b) the CPL for 18 July 1997, averaged over Central Europe.
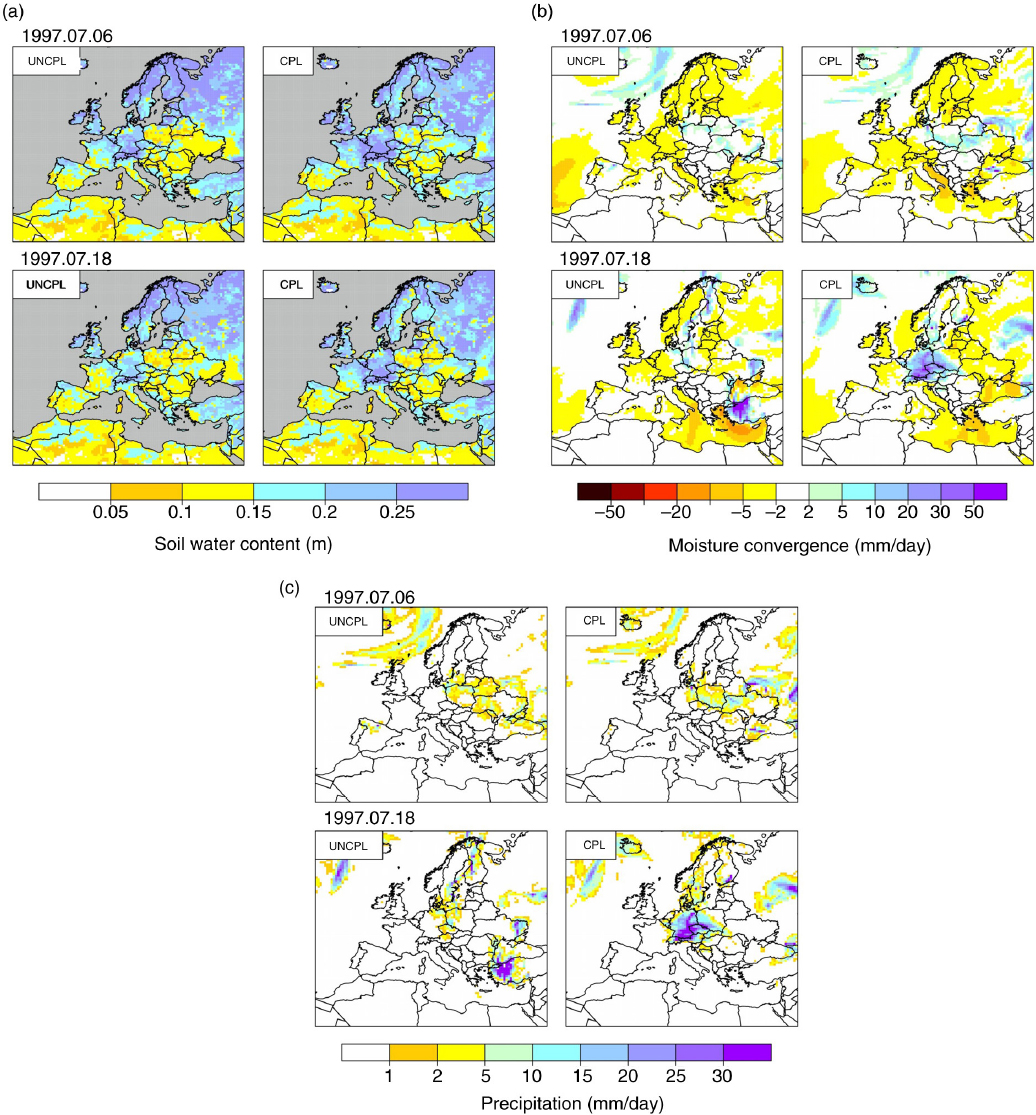
Fig. 12
Daily (a) soil moisture (m) of six uppermost levels, (b) moisture convergence (mm/day), and (c) precipitation (mm/day) of the UNCPL and CPL for 6 and 18 July 1997.