
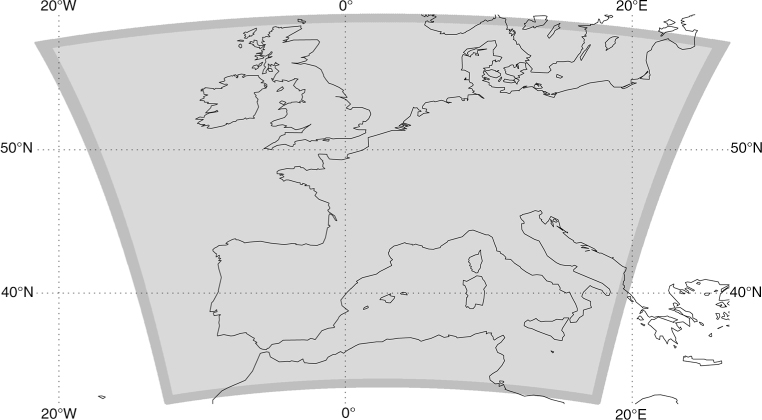
Fig. 1
Horizontal domain of ALADIN-France containing 389 grid points in x− and y− directions: the central zone (light grey) represents the region of meteorological interest. The coupling zone (dark grey), whose width corresponds to eight grid points, is the region where the coupling is added.
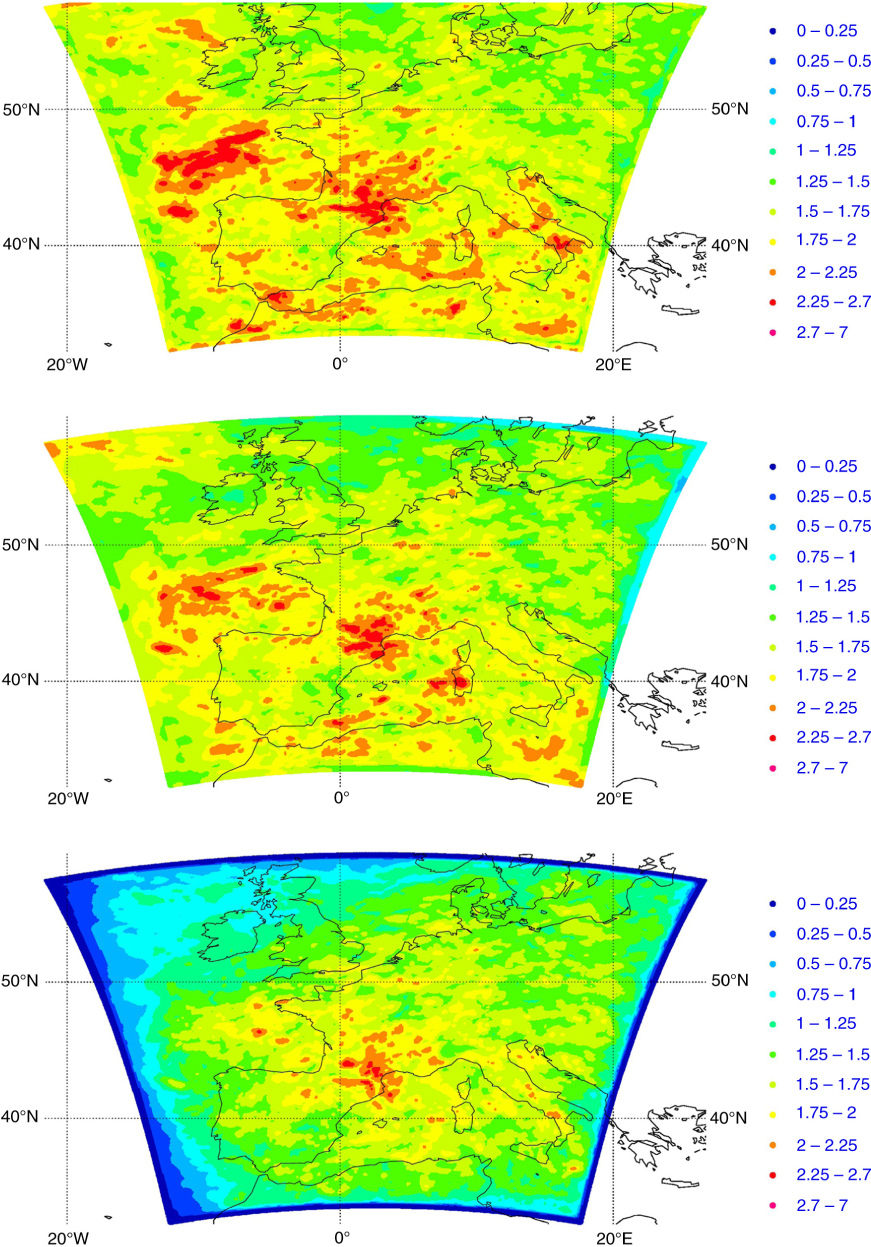
Fig. 2
Horizontal maps of time-averaged spread of 6-h zonal wind forecasts valid at 06 UTC, near level 500 hPa for: PLBC (top), GLBC (middle) and ULBC (bottom). The scaling factor α in PLBC is 0.3.
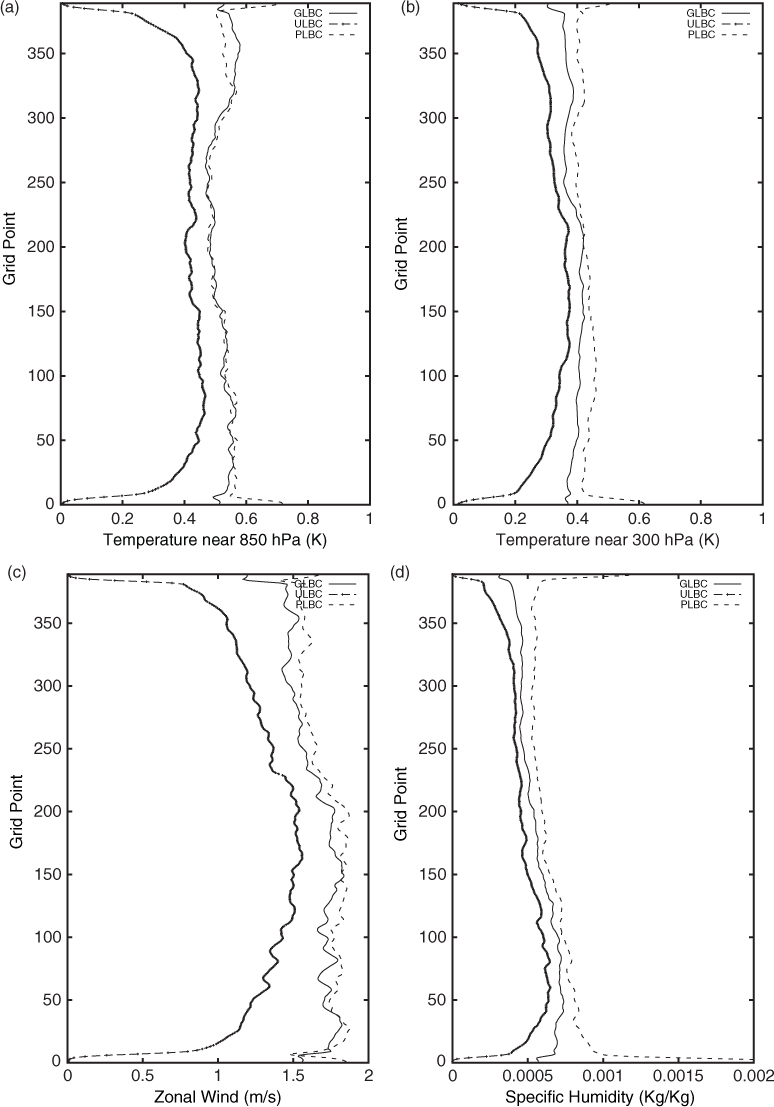
Fig. 3
Meridional cross-sections of time-averaged spread of 6-h forecasts valid at 06 UTC of: (a) temperature near level 850 hPa, (b) temperature near 300 hPa, (c) zonal wind near 500 hPa and, (d) specific humidity near 850 hPa.
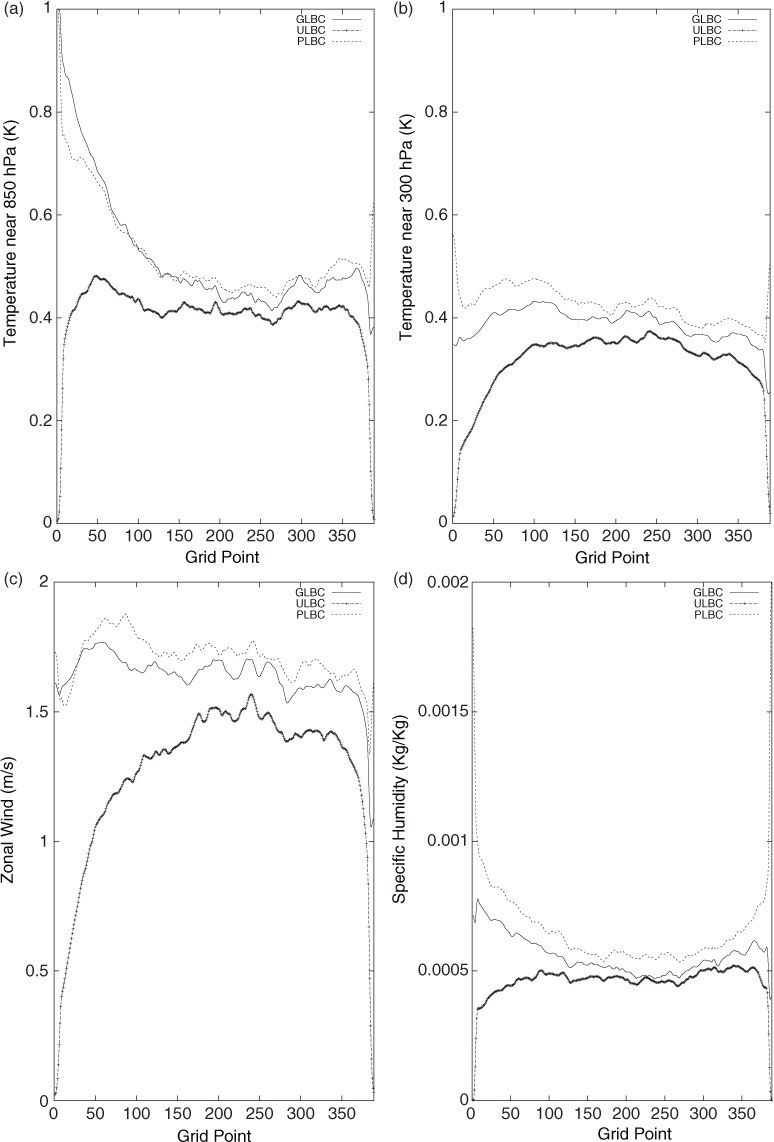
Fig. 4
Zonal cross-sections of time-averaged spread of 6-h forecasts valid at 06 UTC of: (a) temperature near 850 hPa, (b) temperature near 300 hPa, (c) zonal wind near 500 hPa and, (d) specific humidity near 850 hPa.
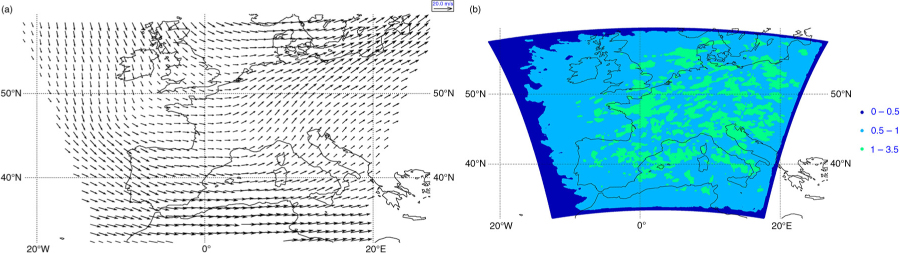
Fig. 5
(a) Time-averaged 6-h horizontal wind forecast from ALADIN-France deterministic model near 500 hPa valid at 06 UTC. (b) Ratio of time-averaged spread of 6-h zonal wind forecast near 500 hPa valid at 06 UTC from ULBC experiment to that of GLBC.
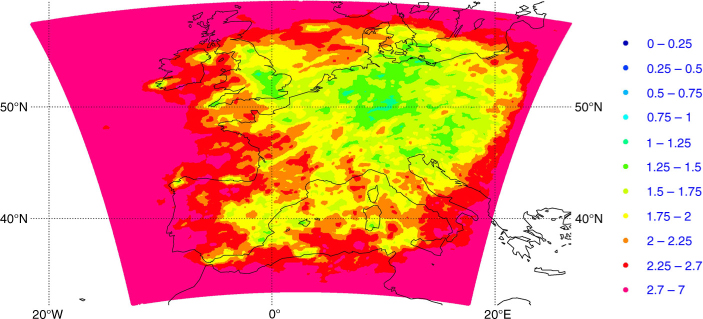
Fig. 6
Horizontal map of time-averaged spread of 6-h zonal wind forecasts near 500 hPa valid at 06 UTC for the PLBC configuration and with a scaling factor α equal to 1.
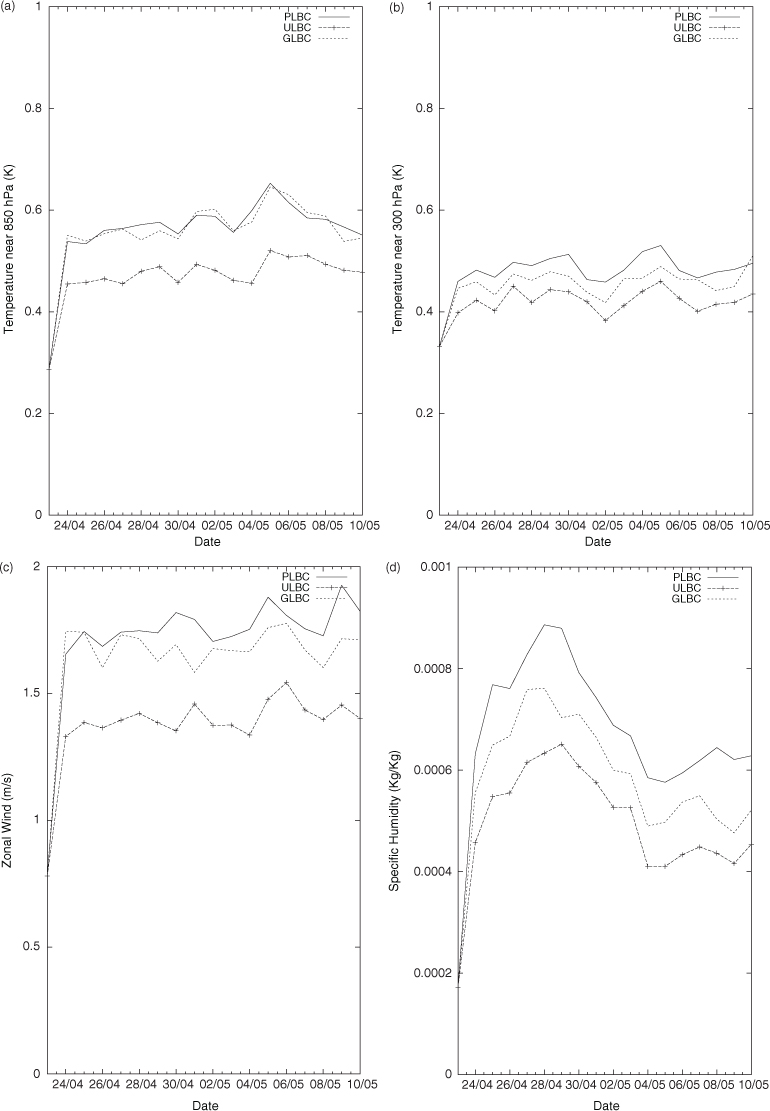
Fig. 7
Temporal evolution of horizontally averaged analysis spread maps valid at 00 UTC of: (a) temperature near 850 hPa, (b) temperature near 300 hPa, (c) zonal wind near 500 hPa and (d) specific humidity near 850 hPa.
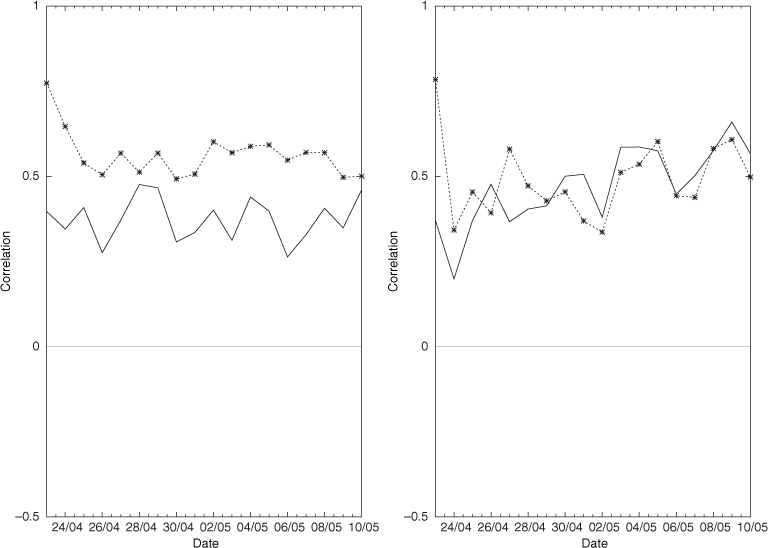
Fig. 8
Temporal evolution of domain-averaged correlations between respective raw spread maps of 6-h forecasts valid at 06 UTC of ULBC and of GLBC (solid line) and of PLBC and GLBC (dotted line) for: (a) temperature near 850 hPa and (b) zonal wind near 500 hPa.
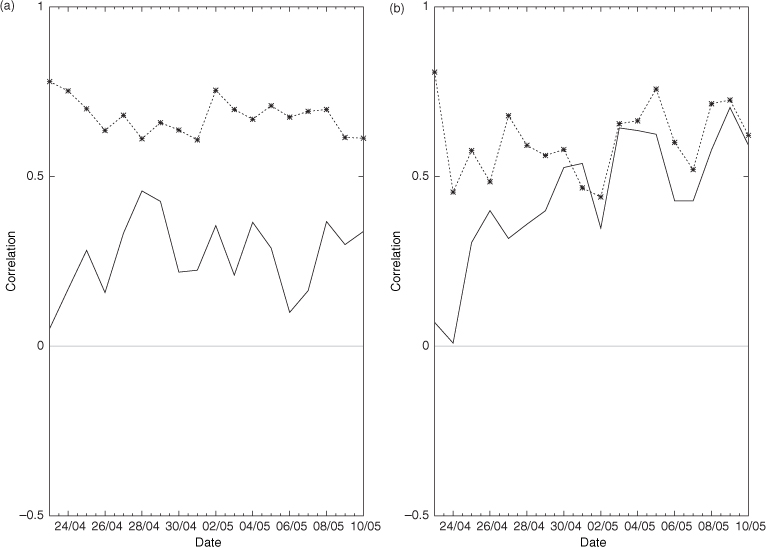
Fig. 9
Temporal evolution of domain-averaged correlations between respective spatially filtered spread maps 6-h forecasts valid at 06 UTC of ULBC and of GLBC (solid line) and of PLBC and GLBC (dotted line) for: (a) temperature near 850 hPa and (b) zonal wind near 500 hPa.
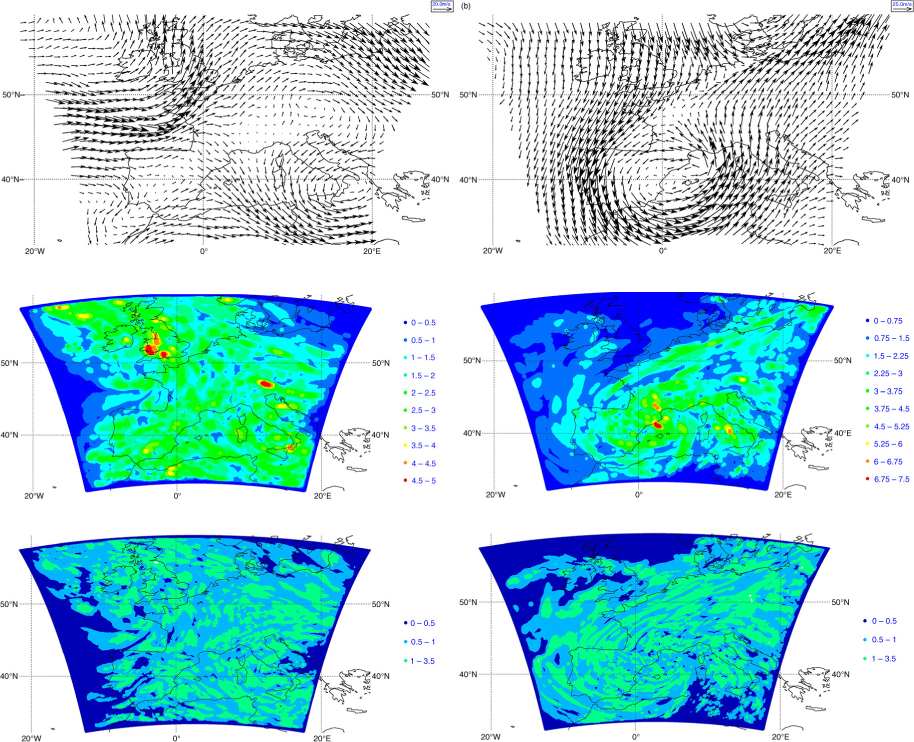
Fig. 10
Case of a Westerly jet on April 25, 2010 (left panels) and of a strong northern flow on May 04, 2010 (right panels). (a) and (b) 6-h horizontal wind forecast near 500 hPa from ALADIN-France deterministic model, valid at 06 UTC. (c) and (d) spread in ULBC of 6-h zonal wind forecasts near 500 hPa valid at 06 UTC. (e) and (f) ratio of spread of 6-h zonal wind forecasts valid at 06 UTC near 500 hPa of ULBC to that of GLBC.
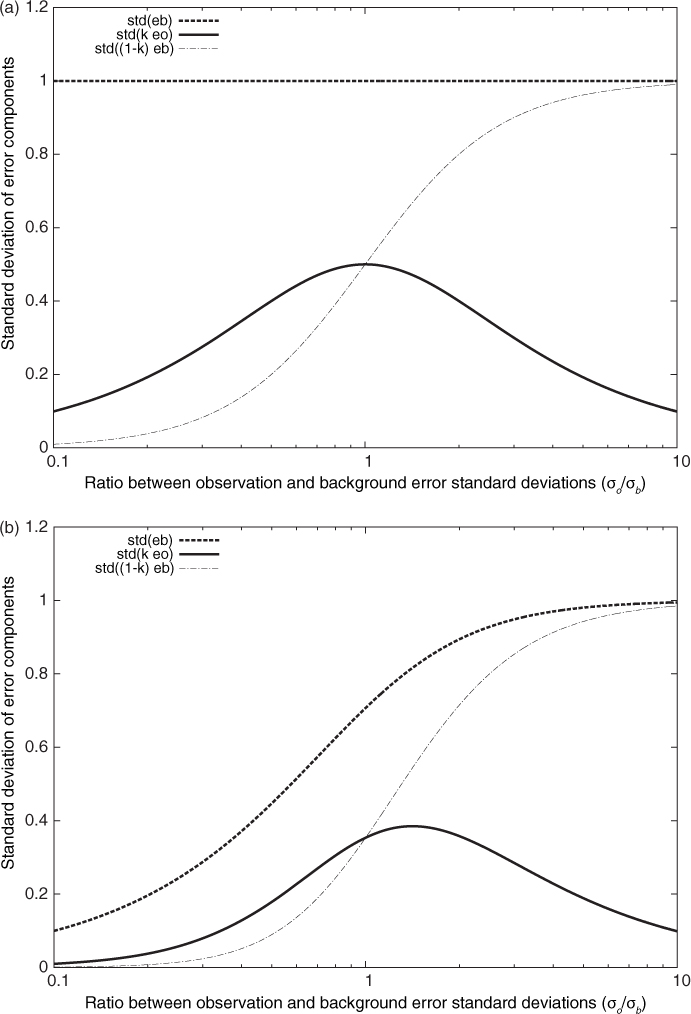
Fig. 11
Specified background error standard deviations (thick dashed line), standard deviations of current observation error contributions to analysis errors (thick full line) and standard deviations of background error contributions to analysis errors (thin dash-dotted line), as a function of the ratio γ between observation and background error standard deviations . (a) case where σ b is the same whatever γ is (i.e. σ b =1); (b) case where σ b increases when γ is larger (i.e. by specifying ) in this example.