
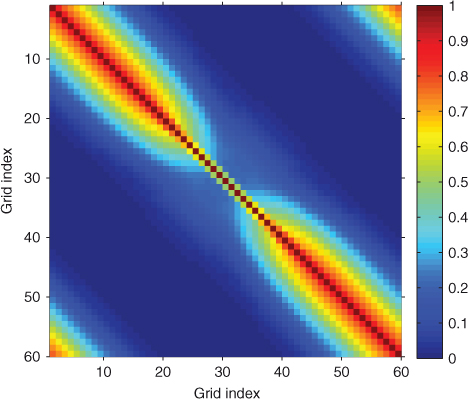
Fig. 1
True covariance matrix used for the estimation of ensemble covariances on a one-dimensional periodic domain of 60 grid points.
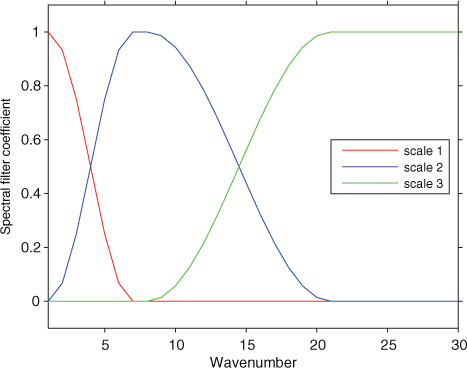
Fig. 2
Spectral filter coefficients used to separate the background-error covariances into three wavebands: scales 1, 2 and 3 correspond to the large, medium and small scales, respectively.
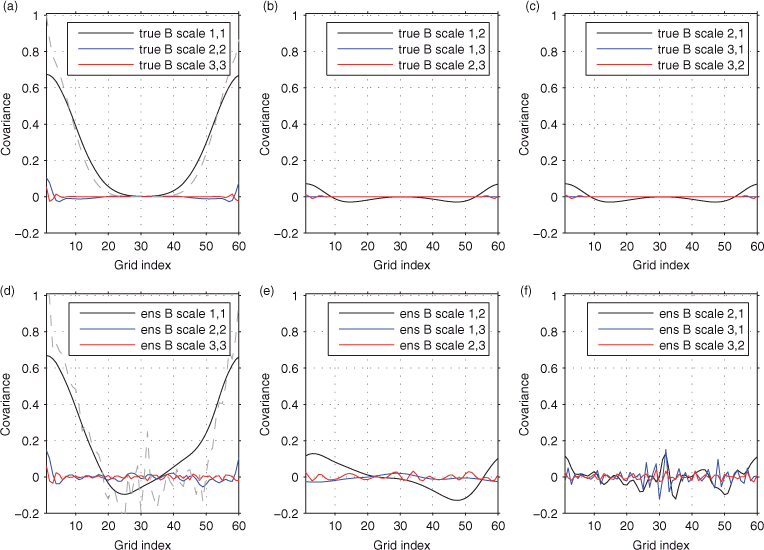
Fig. 3
The true (upper panels) and ensemble (lower panels) covariance functions after decomposition with respect to three ranges of scale for both the within-scale (left panels) and between-scale (middle and right panels) spatial covariances as described in the legends of each panel relative to the first grid point that is dominated by the large-scale covariances. For comparison, the complete true and ensemble covariance functions are also shown in dashed grey in the left panels only.
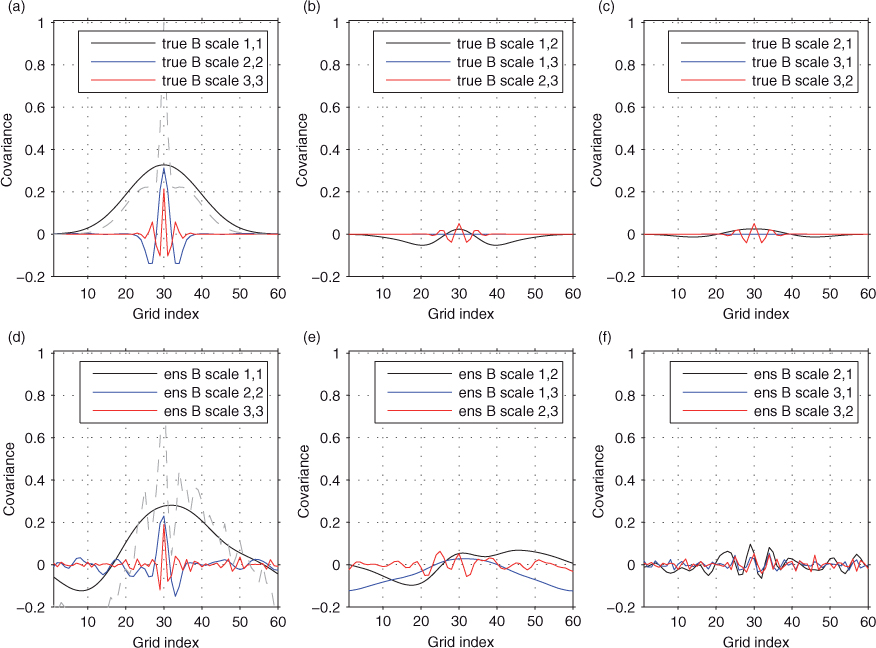
Fig. 4
Same as Fig. 3, except for covariances relative to the middle grid point that is dominated by the small-scale covariances.
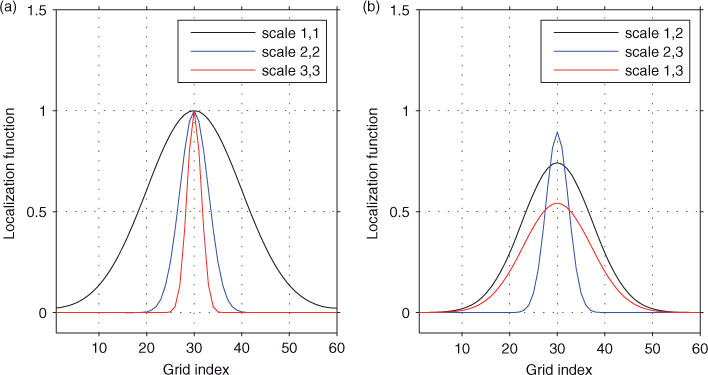
Fig. 5
Scale-dependent localisation functions (a) for each scale with itself and (b) for between every pair of scales for a single location at the middle of the spatial domain.
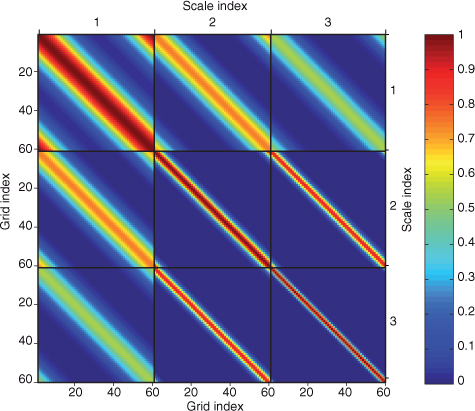
Fig. 6
Scale-dependent spatial localisation matrix for three scales and a one-dimensional spatial domain of 60 grid points.
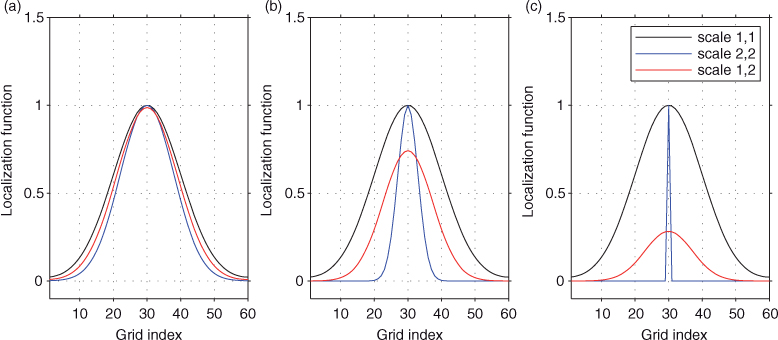
Fig. 7
The spatial localisation functions for two ranges of scales (black and blue) and the between-scale localisation function (red) when the two localisation length scales are (a) 10 and 8, (b) 10 and 3, or (c) 10 and 0.2 grid points.
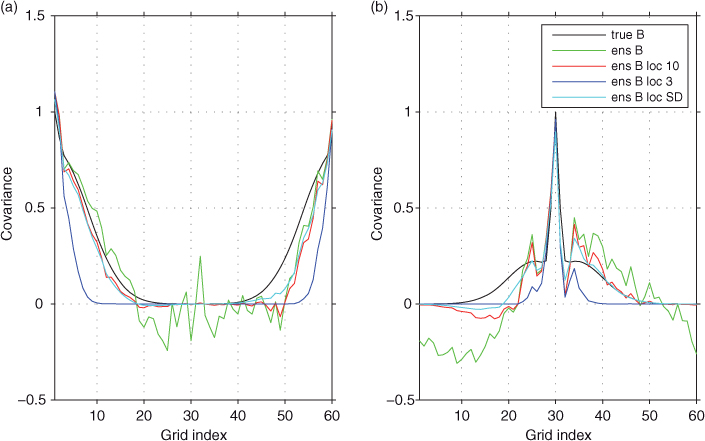
Fig. 8
Covariance functions relative to (a) the first grid point that is dominated by the large-scale covariances and (b) the middle grid point that is dominated by the small-scale covariances. The true covariances (black) are shown together with covariances estimated from a single ensemble of 50 random perturbations. The original ensemble covariances (green; same as the grey dashed curves in Fig. 3d and 4d) and the ensemble covariances with either broad localisation (red; 10 grid-point length scale), severe localisation (blue; 3 grid-point length scale) or scale-dependent localisation (cyan; 10, 3 and 1.5 grid-point length scales) are shown.
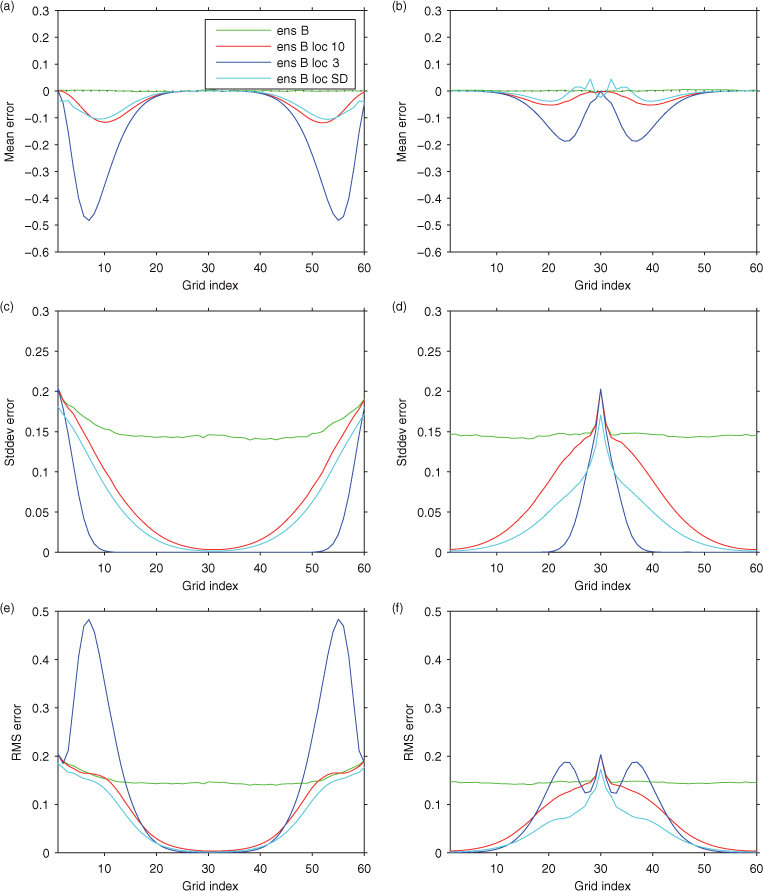
Fig. 9
Mean (upper panels), stddev (middle panels) and root-mean-square (lower panels) of the error in the estimated covariances with respect to the first (left panels) and middle (right panels) grid points computed from 5000 independent 50-member ensembles with no localisation (green), localisation with a large-length scale (red), localisation with a short-length scale (blue), and scale-dependent localisation using three different length scales (cyan).
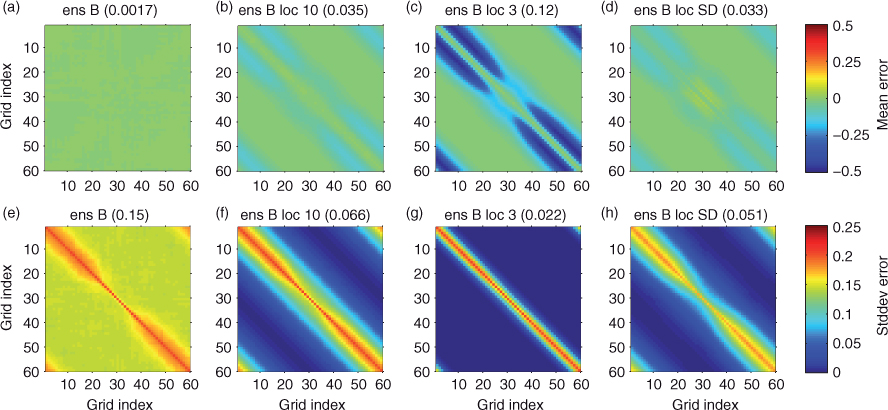
Fig. 10
The mean error (top panels) and stddev of the error (bottom panels) for (a, e) the raw ensemble covariances, the ensemble covariances with (b, f) the broad localisation function or (c, g) sharp localisation function applied, and (d, h) the ensemble covariances with scale-dependent localisation applied. The average magnitude of mean error and error stddev is shown in parentheses for each.
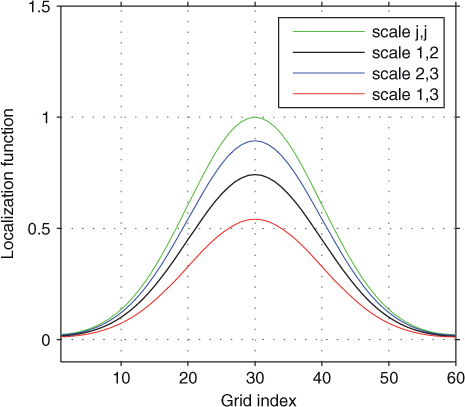
Fig. 11
Localisation functions used to isolate the impact of spectral localisation on the scale-dependent localisation results. The function labelled ‘scale j,j’ refers to the localisation used for each scale with itself, while the other functions are for the between-scale localisation for a single location at the middle of the spatial domain. All functions have the same length scale of 10 grid points.
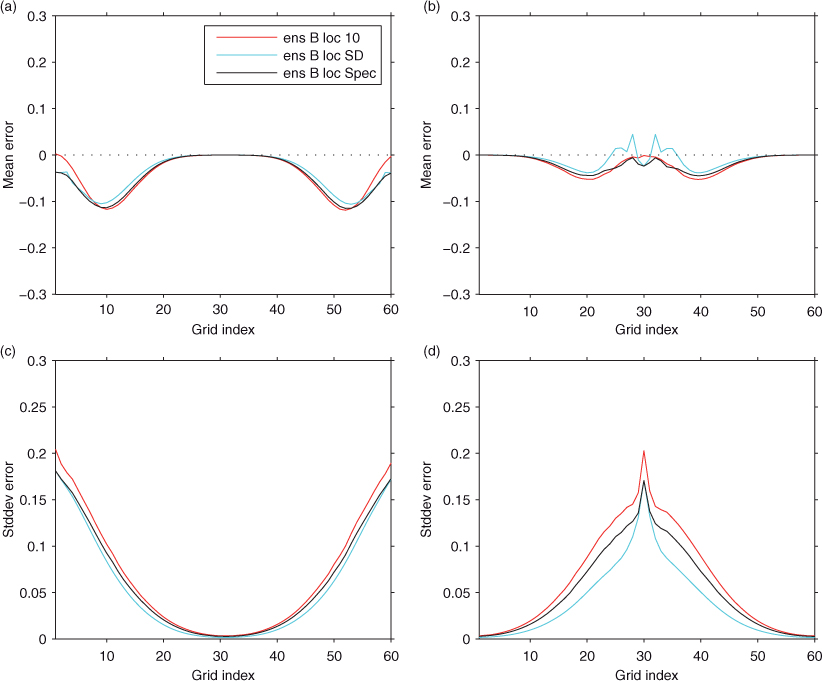
Fig. 12
Like Fig. 9, except for the estimated covariances computed using localisation with a large-length scale (red), scale-dependent localisation using three different length scales (cyan), and localisation with a large-length scale combined with the same amount of spectral localisation as for scale-dependent localisation (black).
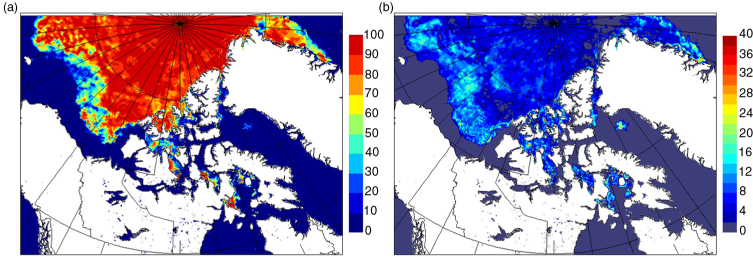
Fig. 13
The (a) background sea-ice concentration and (b) ensemble spread stddev of sea-ice concentration computed from the 60-member ensemble. Note that the units are in percent.
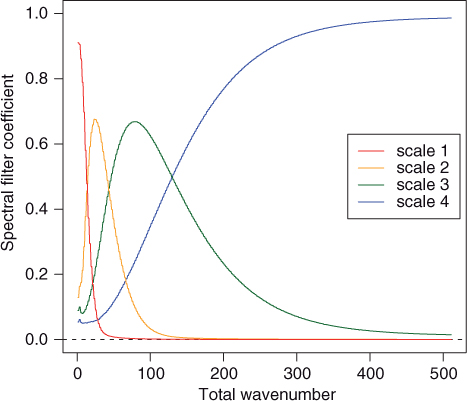
Fig. 14
Equivalent spectral filter coefficients computed from the application of the diffusion operator to perform the separation into four ranges of scales.
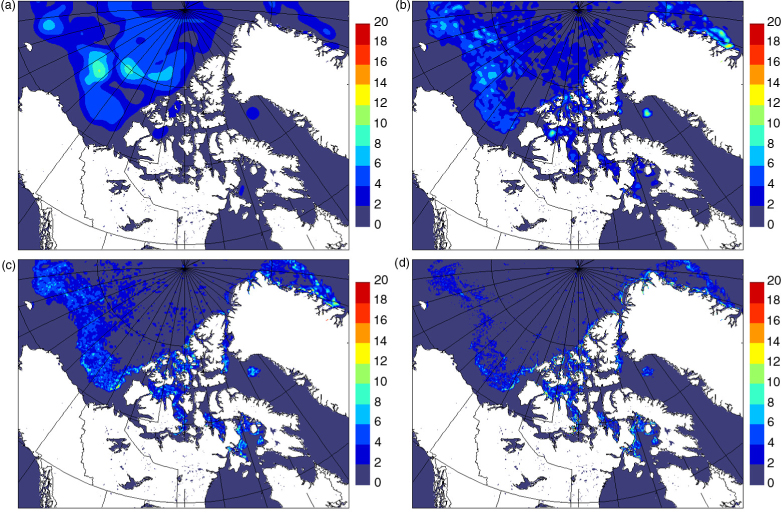
Fig. 15
The ensemble spread stddev for the 60-member sea-ice concentration ensemble for four different ranges of spatial scales, ordered from (a) largest to (d) smallest. Note that the units are in percent.
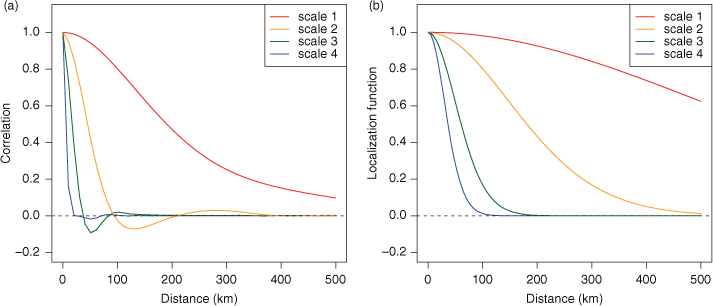
Fig. 16
(a) The homogeneous correlation functions computed from the ensemble covariances for each range of scales. (b) The specified spatial localisation functions chosen for each scale: Gaussian-like functions with length scales equal to 500, 150, 50, and 30 km for scales 1, 2, 3 and 4, respectively.
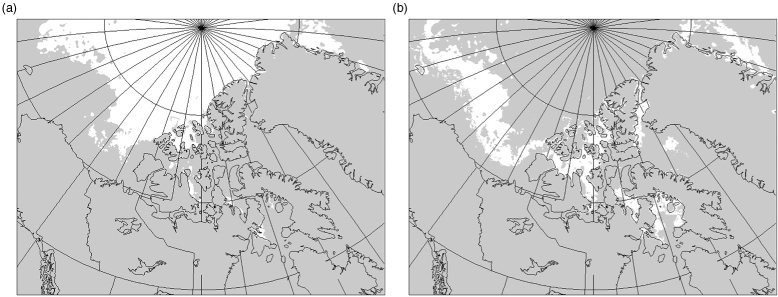
Fig. 17
(a) The pack ice area and (b) the marginal ice zone (shown in white).
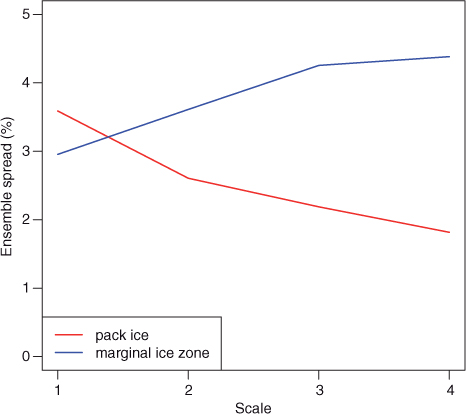
Fig. 18
The sea-ice concentration ensemble spread stddev (in percent) for each of four ranges of scales, averaged over the pack ice area (red) and the marginal ice zone (blue).
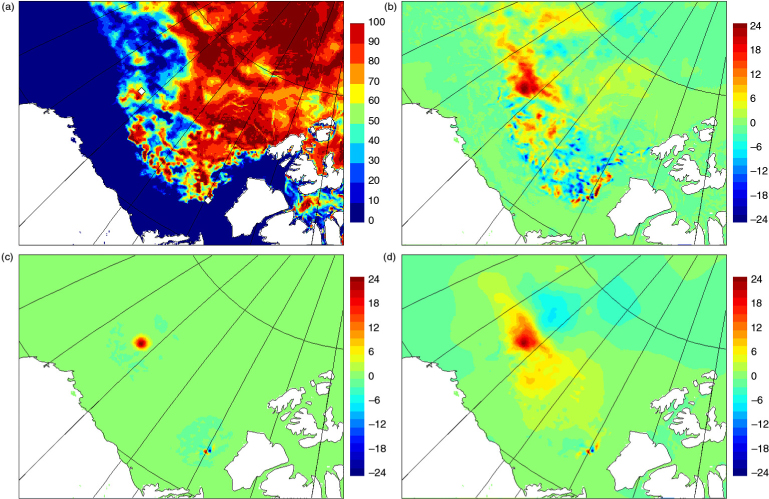
Fig. 19
(a) Background sea-ice concentration and locations of two observations (denoted by the white diamonds) in the Beaufort Sea that were assimilated. Resulting ice concentration analysis increment from assimilating these observations are shown when using (b) localisation with 500 km length scale, (c) localisation with 30 km length scale and (d) scale-dependent localisation with 500, 150, 50 and 30 km length scales. Note that the units are in percent.
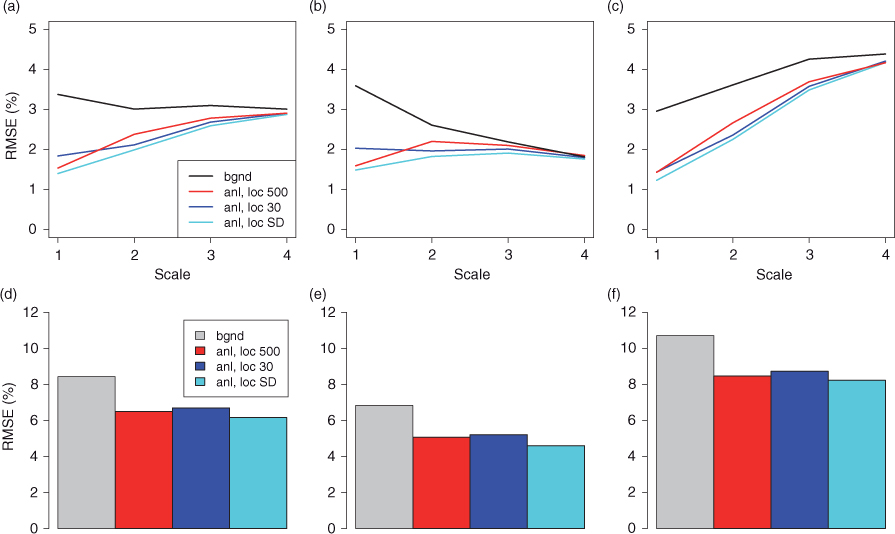
Fig. 20
Background (black/grey) and analysis root-mean-square error (in percent) when using localisation with 500 km (red) or 30 km (blue) length scale or scale-dependent localisation (cyan). The error is shown both as a function of horizontal scale (upper panels) and as the total error for all scales (lower panels). Left panels show the error averaged over the entire domain where the ice concentration is greater than 1 %, middle panels show the error averaged over only the pack ice area, and the right panels show the error averaged over only the marginal ice zone.