
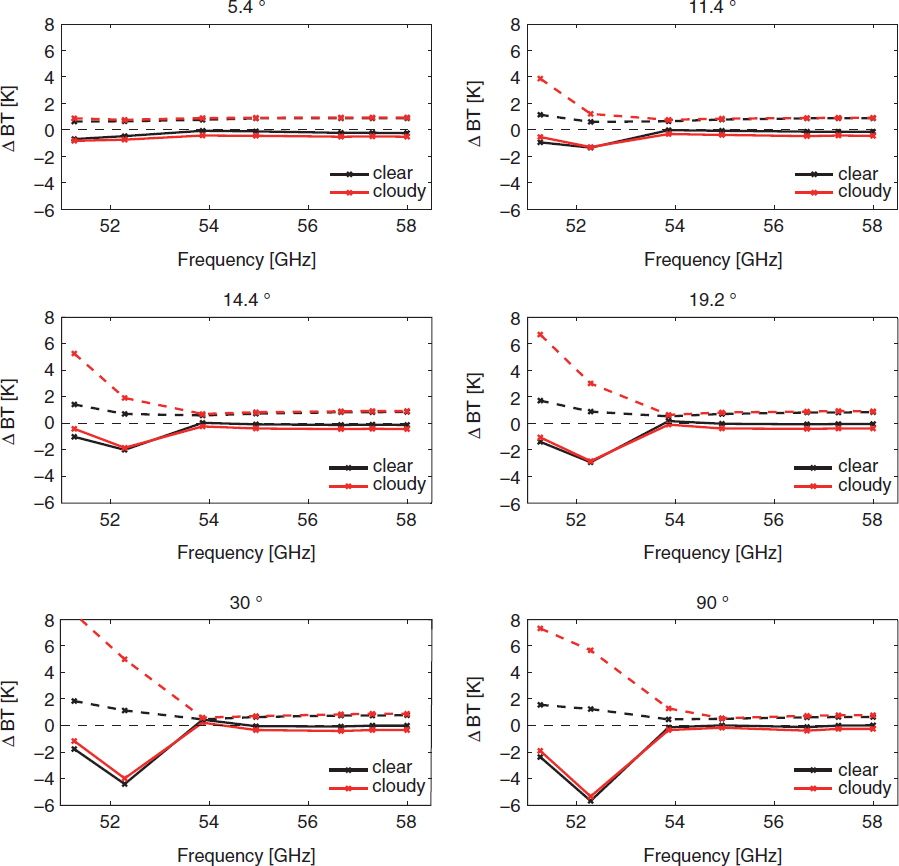
Fig. 1
Observation minus background (AROME forecast) departures for V-band channels (51–58 GHz) for different elevation angles from 5.4 ° to 90 °. For each elevation angle, bias (solid line) and standard deviation (dashed line) are shown for clear-sky cases (black line, 311 cases) and cloudy cases (red line, 334 cases).
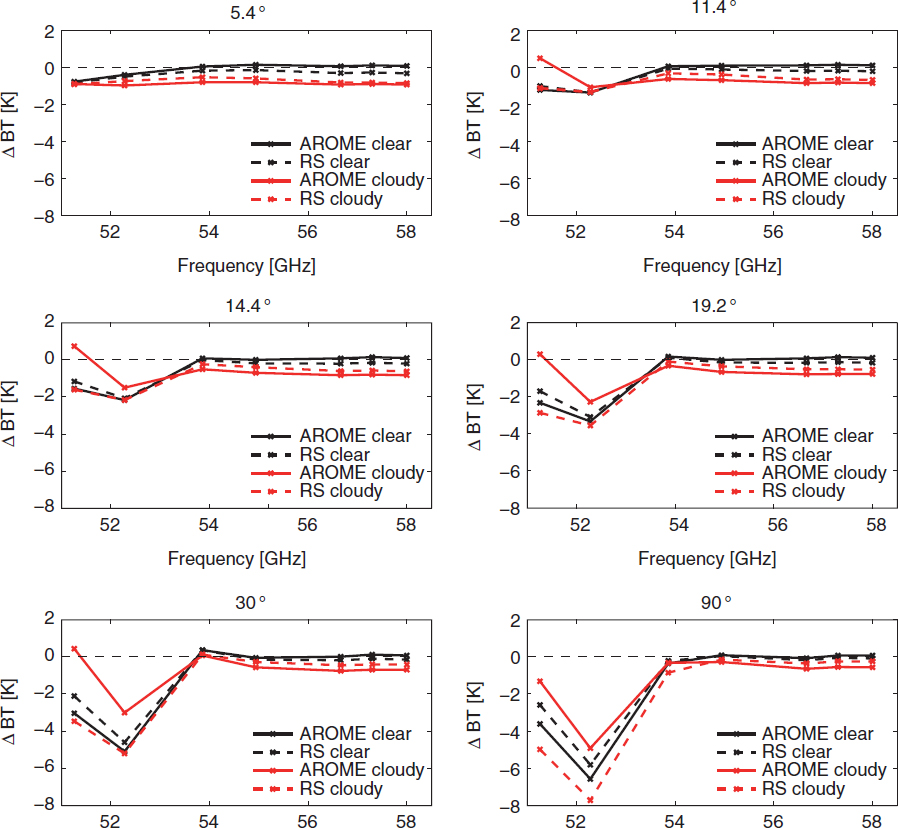
Fig. 2
Bias of the departures (observation minus background) computed either with AROME (solid line) or collocated radiosondes (dashed line). The differences are computed for different elevation angles from 5.4 ° to 90 ° in clear-sky cases (black line, 72 observations) and cloudy conditions (red line, 77 observations).
Table 1. The bias and standard deviation of the observation minus background departures computed from AROME forecasts at 90 ° elevation angle
51.26−2.4/−1.91.5/7.352.28−5.7/−5.31.2/5.753.86−0.1/−0.30.4/1.354.940.02/−0.20.5/0.656.66−0.11/−0.40.6/0.757.3−0.01/−0.20.6/0.8580.02/−0.20.6/0.8
Table 2. Relative standard deviation (ratio of the standard deviation to the mean brightness temperature) of the observation minus background departures computed from clear-sky AROME forecasts at different elevation angles
5.4 °0.2 (0.3)0.2 (0.3)0.3 (0.3)0.3 (0.3)0.3 (0.3)0.3 (0.3)0.3 (0.3)11.4 °0.4 (1.4)0.2 (0.4)0.2 (0.3)0.3 (0.3)0.3 (0.3)0.3 (0.3)0.3 (0.3)14.4 °0.6 (2.1)0.3 (0.7)0.2 (0.2)0.2 (0.3)0.3 (0.3)0.3 (0.3)0.3 (0.3)19.2 °0.8 (3.0)0.3 (1.2)0.2 (0.2)0.2 (0.3)0.3 (0.3)0.3 (0.3)0.3 (0.3)30 °1 (4.6)0.6 (2.2)0.2 (0.2)0.2 (0.2)0.2 (0.3)0.3 (0.3)0.3 (0.3)90 °1.4 (6.3)0.8 (3.7)0.2 (0.5)0.2 (0.2)0.2 (0.2)0.2 (0.3)0.2 (0.3)
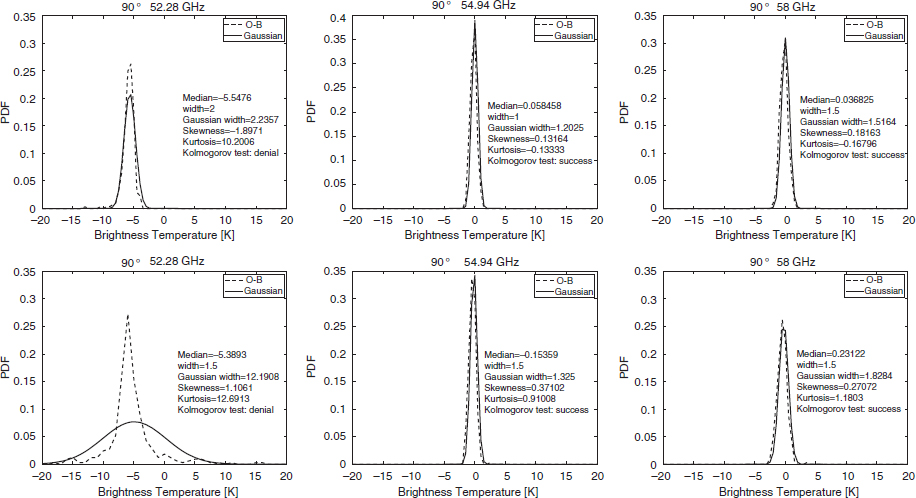
Fig. 3
Relative frequency distribution of brightness temperature differences between observation and background at 90 ° elevation angle for three channels: 52.28 GHz (left panel), 54.94 GHz (middle panel) and 58 GHz (right panel). The frequency distributions are shown for clear-sky cases (311 observations) on top panels and cloudy cases (334 observations) on bottom panels. The Gaussian distributions with the same error characteristics are also shown in solid line.
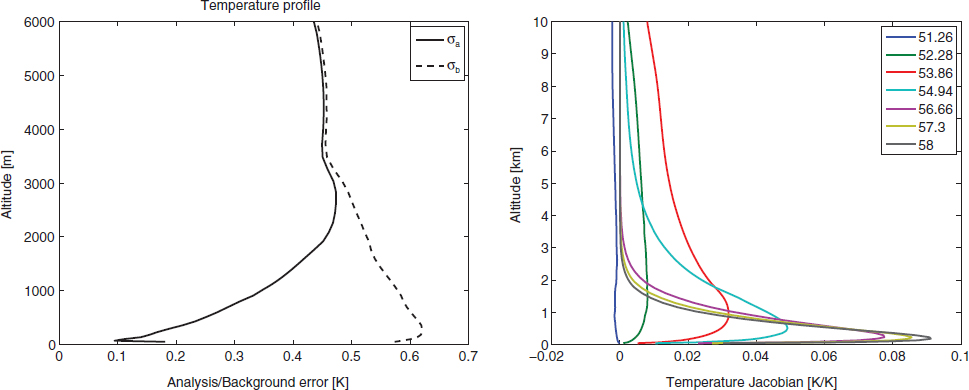
Fig. 4
Left panel: temperature analysis error (solid line) and background error (dashed line). Right panel: temperature Jacobians.
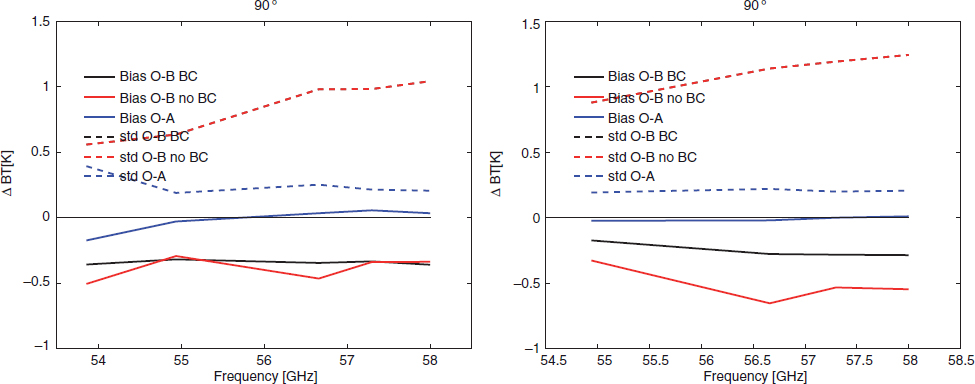
Fig. 5
Bias (solid line) and standard deviation (dashed line) of observation minus background departures after bias correction (O - B, black line) compared to those of observation minus background departures without bias correction (O - B, red line) and observation minus analysis innovations (O - A, blue line). Statistics computed on 51 clear-sky cases (left panel) and 69 cloudy-sky cases (right panel).
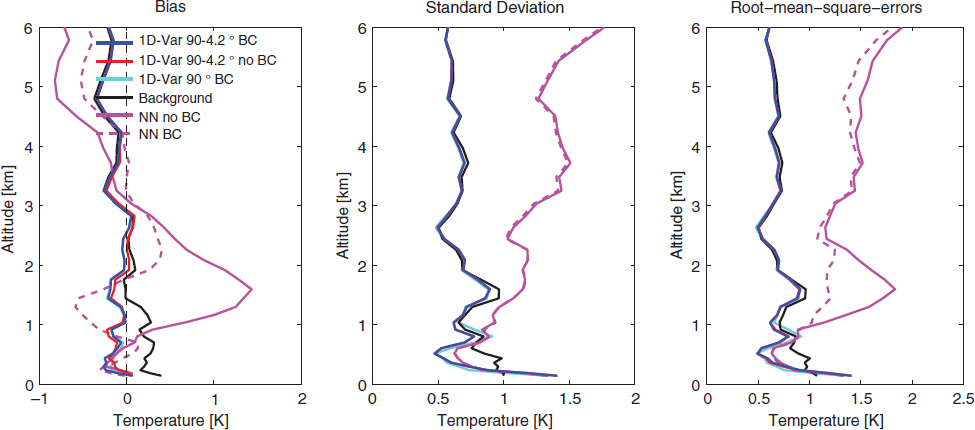
Fig. 6
Vertical profiles of bias (left panel), standard deviation (middle panel) and root-mean-square-errors (right panel) of the AROME background (black line) and MWR retrievals against radiosondes. The performance of neural network retrievals is displayed in magenta whereas all the other colours refer to 1D-Var retrievals for different settings: using all elevation angles and applying a BT offset correction (blue), using all elevation angles without bias correction (red) and using only observations at zenith angle (cyan). NN retrievals before bias correction are shown in solid line (magenta), whereas retrievals after bias correction are shown in dashed line (magenta). Results computed on 51 clear-sky temperature retrievals.
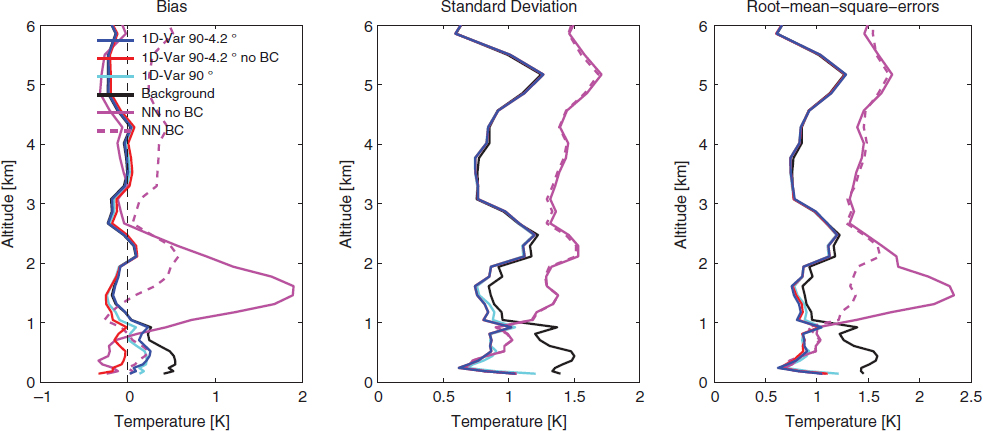
Fig. 7
Vertical profiles of bias (left panel), standard deviation (middle panel) and root-mean-square-errors (right panel) of the AROME background (black line) and MWR retrievals against radiosondes. The performance of neural network retrievals is displayed in magenta, whereas all the other colours refer to 1D-Var retrievals for different settings: using all elevation angles and applying a BT offset correction (blue), using all elevation angles without bias correction (red) and using only observations at zenith angle (cyan). NN retrievals before bias correction are shown in solid line (magenta), whereas retrievals after bias correction are shown in dashed line (magenta). Results computed on 69 cloudy-sky temperature retrievals.