
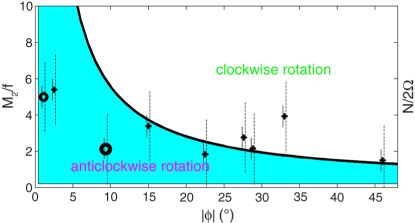
Fig. 1
Clockwise and anticlockwise polarisation of internal semidiurnal tidal waves as a function of latitude for given stratification. Theoretical curve [eq. (4)] following non-TA (see text) as a function of wave frequency (σ=M2, lunar semidiurnal) scaled with the inertial frequency (heavy solid graph). The graph separates areas with dominant clockwise polarisation above it (white area) and anticlockwise polarisation below it (light-blue). The symbols represent mean local stratification in terms of buoyancy frequency computed over 100 m around the current meter depth and scaled with 2Ω (vertical solid lines indicate +/− one standard deviation; the thin dashed lines indicate the one std-extent of N over 10 m intervals, cf. van Haren and Millot, 2006). Observations are from: 500–1000 m above the 5000 m deep Atlantic Ocean abyssal plains (+) and about 100 m above the bottom (mab) in tropical channels (o) Kane Gap (KG) and Romanche Fracture Zone (RFZ). For locations, see Fig. 2.
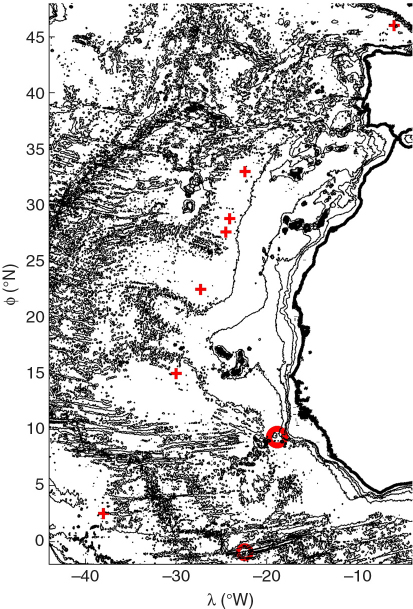
Fig. 2
Northeast Atlantic Ocean, mid-latitude-tropical region, with the positions of long-term mooring locations indicated by symbols. The seven open basin locations are indicated by crosses, the two channel locations by circles. Bathymetry is given every 1000 m from 0 to 5000 m.
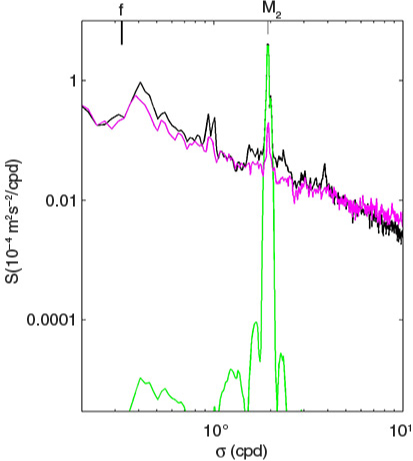
Fig. 3
Example of kinetic energy spectrum from a 1-yr current meter record at 105mab in KG, including semidiurnal band-pass filter (green) and vertical difference spectrum from 5 to 210 mab (purple).
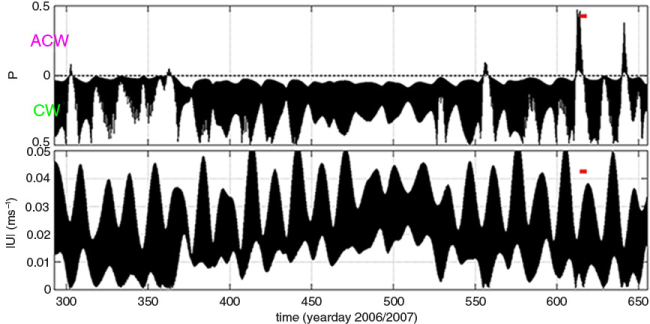
Fig. 4
One year time series of typical deep CB semidiurnal polarisation direction, observed at 28.8°N, 500 mab. The polarisation sign is anticlockwise when positive and clockwise when negative [arbitrary values between (−0.5, 0.5)]. The red bar indicates a 4-d period of which hodographs are given in Fig. 5a. (b) Current amplitude.
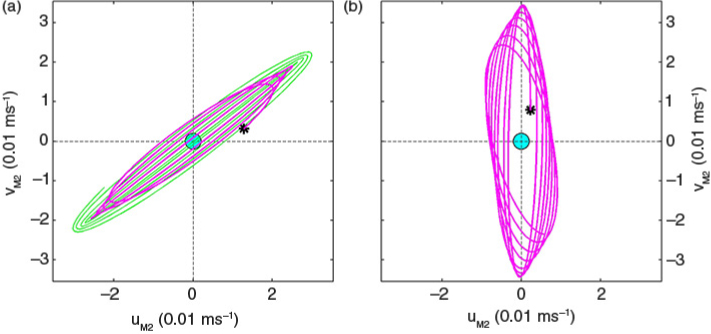
Fig. 5
Hodographs of 4d of band-pass filtered semidiurnal motions. Green colours indicate clockwise motion, purple anticlockwise. Starting point is the star. The light-blue circle indicates the extent of one standard instrumental error. (a) CB, period indicated by small red bar in Fig. 4a. (b) KG, period indicated in Fig. 6a.

Fig. 6
As Fig. 4, but for observations at 105mab in KG in panel a. (b) Inverse of local gradient Richardson number, computed from high-resolution temperature observations and current meter records.

Fig. 7
Mooring location in KG, a varying through-flow of Antarctic Bottom Water in the eastern tropical Atlantic (insert). The mooring was about 5 km south of the main sill, just east of a small (<100 m high) hill.

Fig. 8
Fraction of anticlockwise polarisation from yearlong current meter records (heavy solid line and symbols) compared with the fraction (statistics) of 10-m scale buoyancy frequency below the local theoretical threshold in eq. (4) of the wave frequency/sin(φ) (thin dash–dotted line and symbols). For the latter, an estimate of the standard error is given by the vertical line for the KG-data. Statistics are built over an equivalent range of 600 m around the current meter depths, commonly distributed over three profiles near the moorings.