Fig. 1
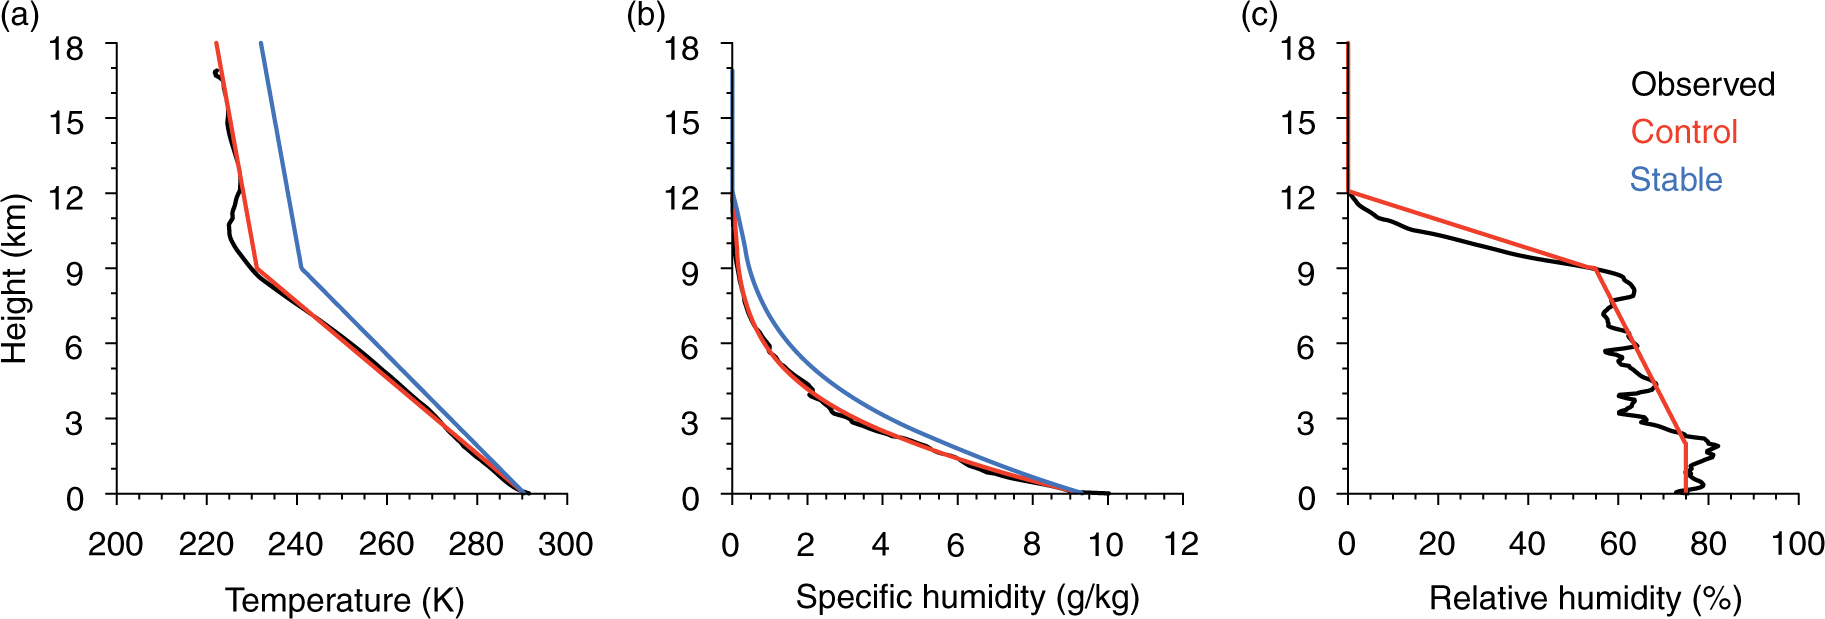
Profiles of (a) temperature (K), (b) specific humidity (g kg−1) and (c) relative humidity (%) derived from soundings taken at Norderney (black, see text for details) and as idealised to start the model simulations (red, control). The stable case (blue) uses a more stable temperature profile but the same relative humidity as the control.
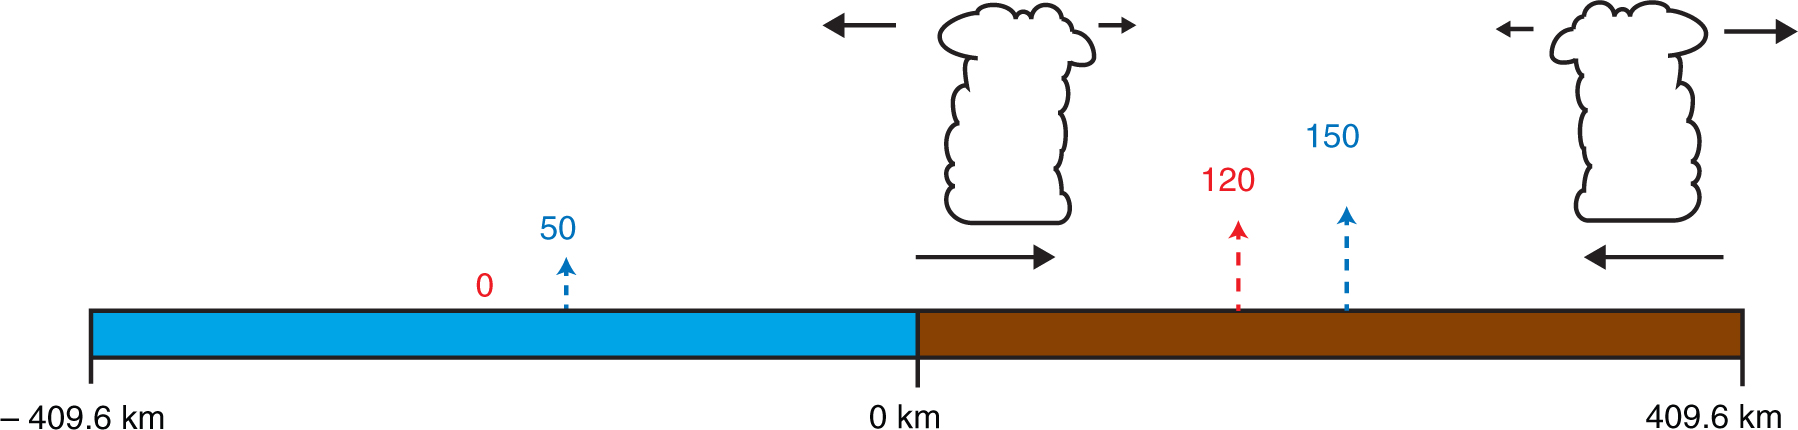
Fig. 2
Overview of the simulation set-up with domain size in x-direction, values of sensible (red) and latent heat fluxes (blue; in W m−2) over ocean (left) and land (right) as well as schematic of the horizontal component of the circulation and cloud location. Note that the domain is doubly periodic.
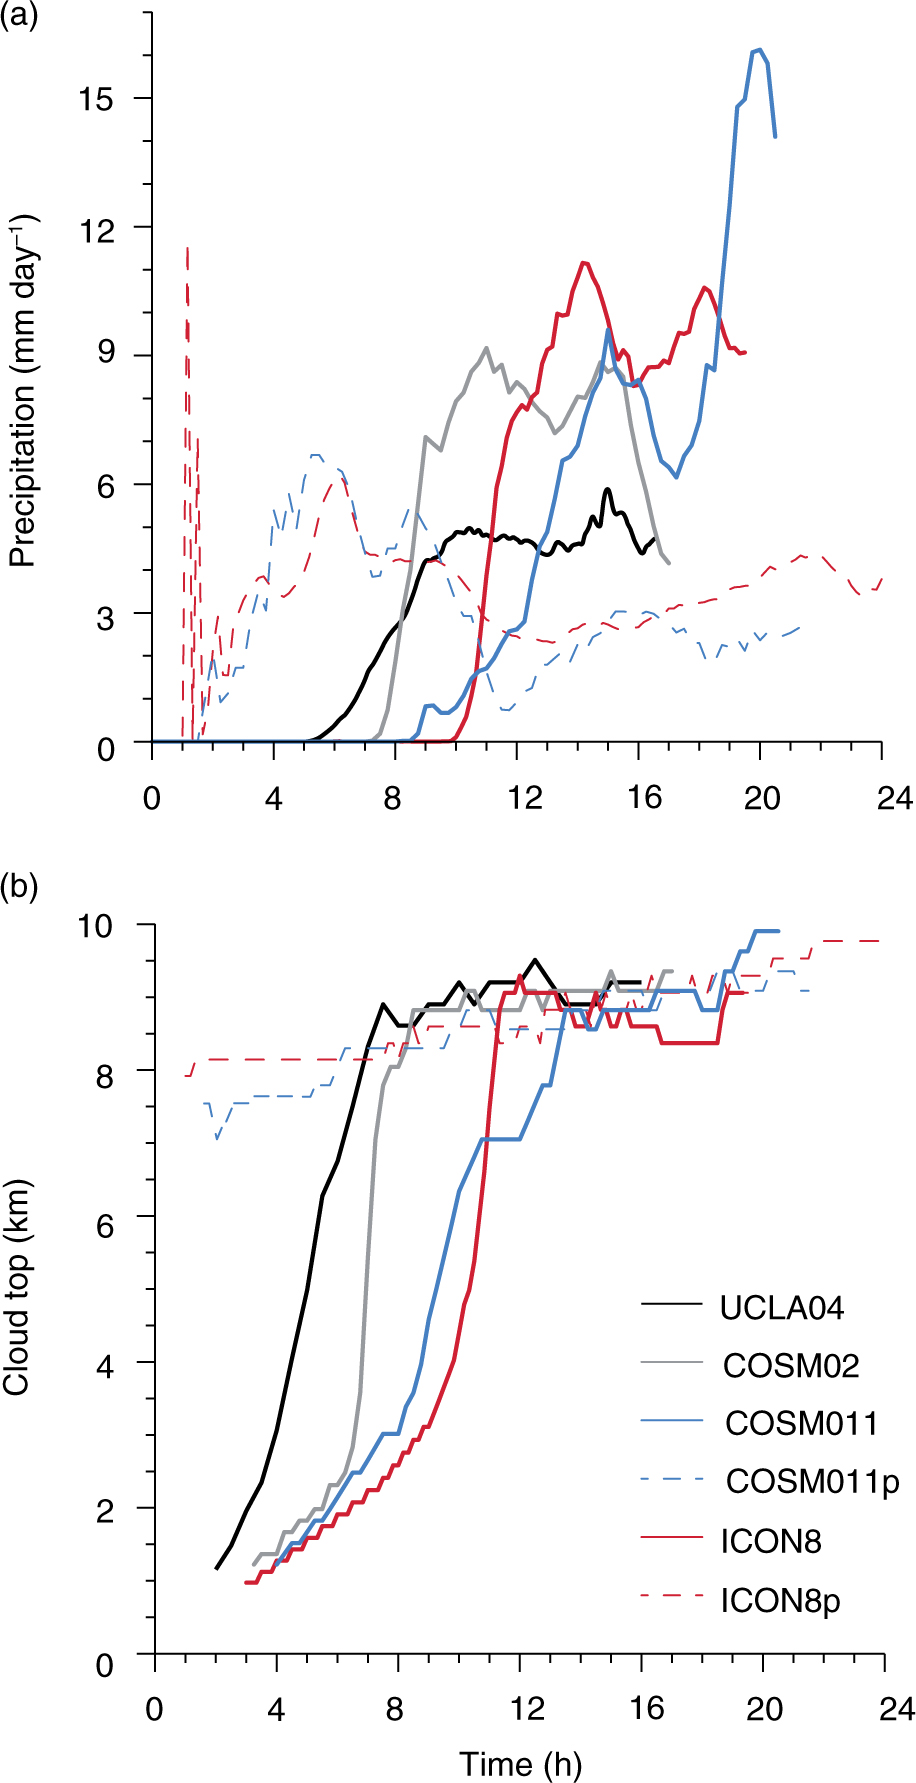
Fig. 3
Time series of (a) domain-averaged precipitation (mm day−1) and (b) maximum cloud top height (km) in UCLA04 (black), COSMO2 (grey), COSMO11 (blue) and ICON8 (red). Dashed lines for the simulations with convective parameterisation.
{ label needed for table-wrap[@id='T0001'] }
Table 1. Summary of various quantities associated with the propagation of the breeze front in the experiments: T col (h), T acc (h) and V (m s−1). The values in brackets refer to the first precipitation event in COSMO11p
Tcol14.51518.517.519.25 (8.75)21.75Tacc8.59.513.512.515 (4)14V7.58.66.87.113.8 (13.2)7.6
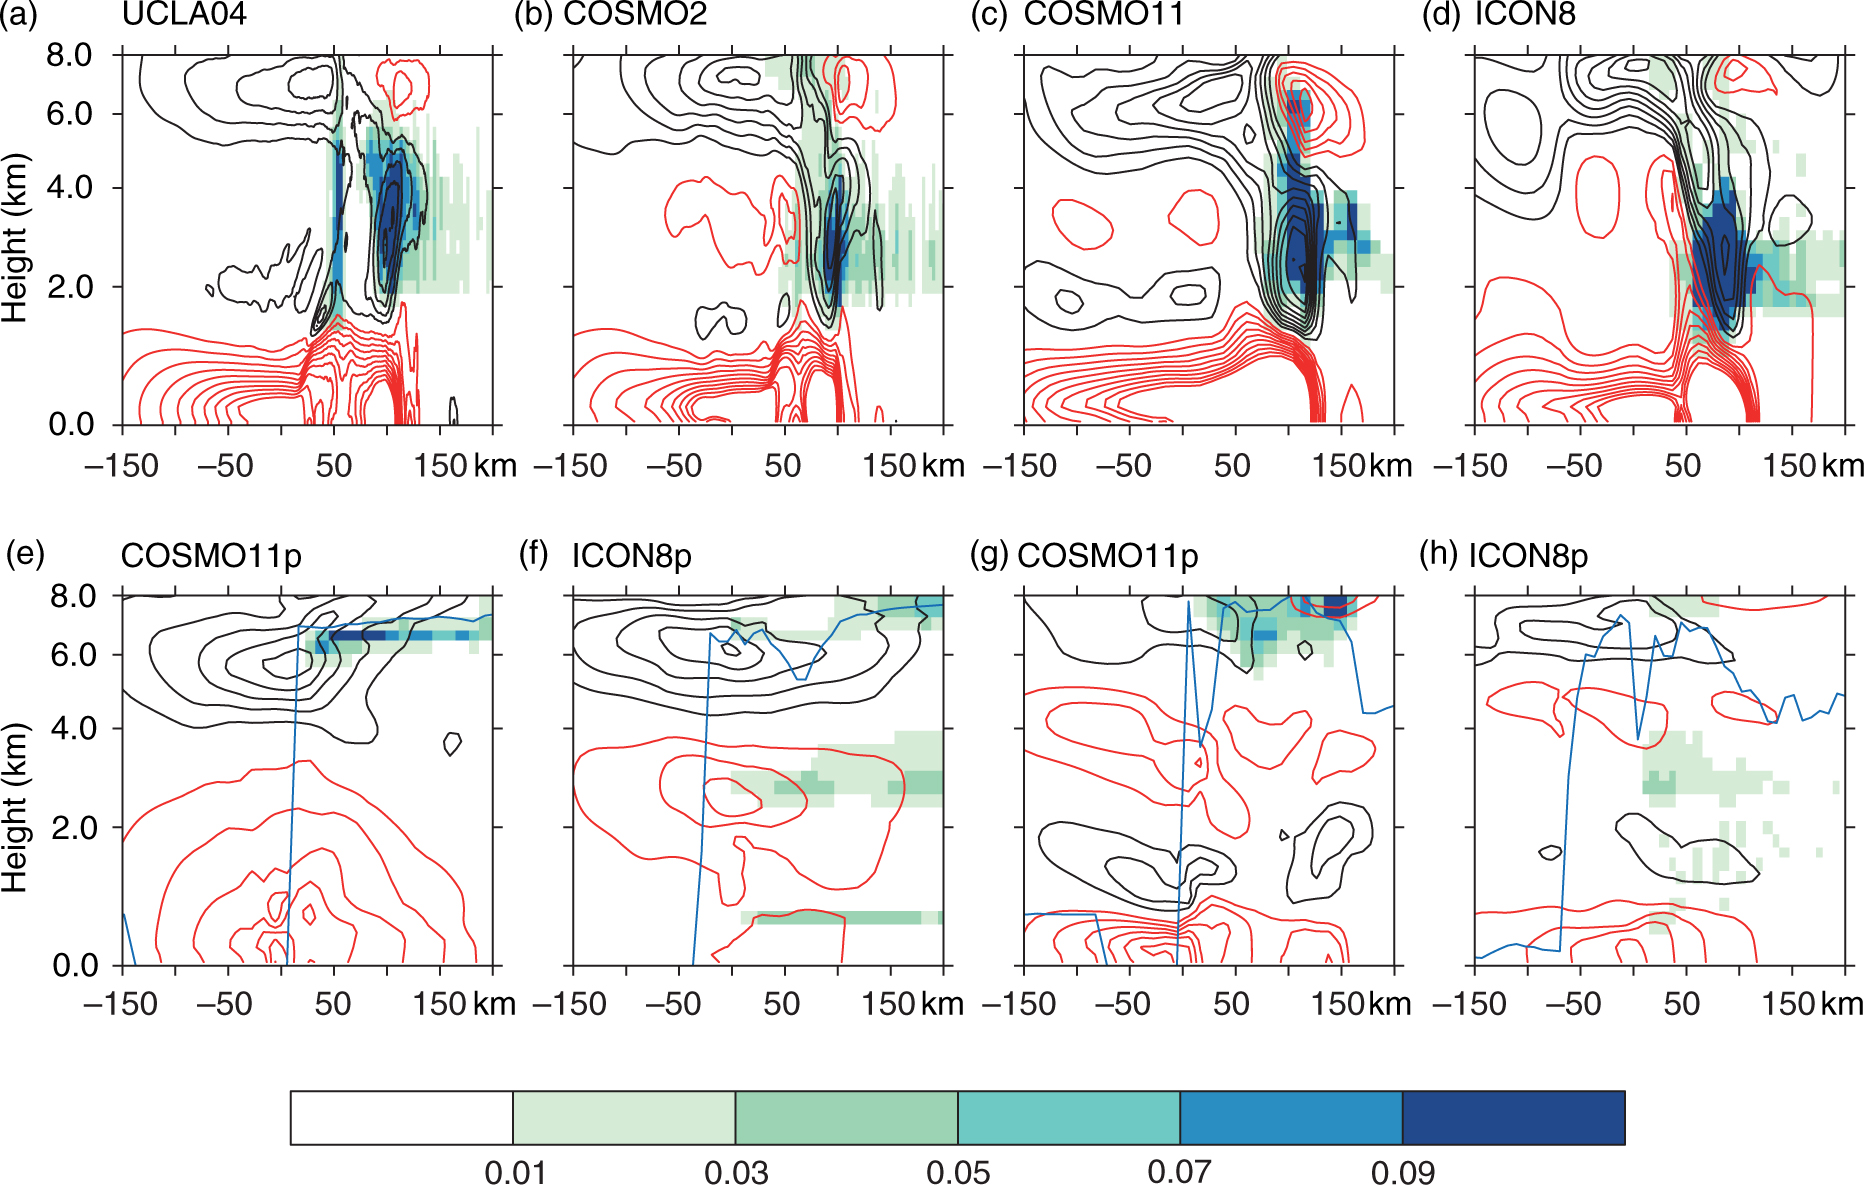
Fig. 4
Vertical cross sections (y-averaged) of resolved cloud water and cloud ice (shaded, g kg−1) and u wind velocity (contour lines each 0.5 m s−1, red positive, black negative) at time of maximum precipitation for the simulations with explicit convection: (a) UCLA04 (10.5 h), (b) COSMO2 (11 h), (c) COSMO11 (15 h), (d) ICON8 (14 h). Panels (e–h) are for the simulations with parameterised convection after (e, f) 6 and (g, h) 16.5 simulation hours. The blue line on (e–h) denotes the convective cloud top.
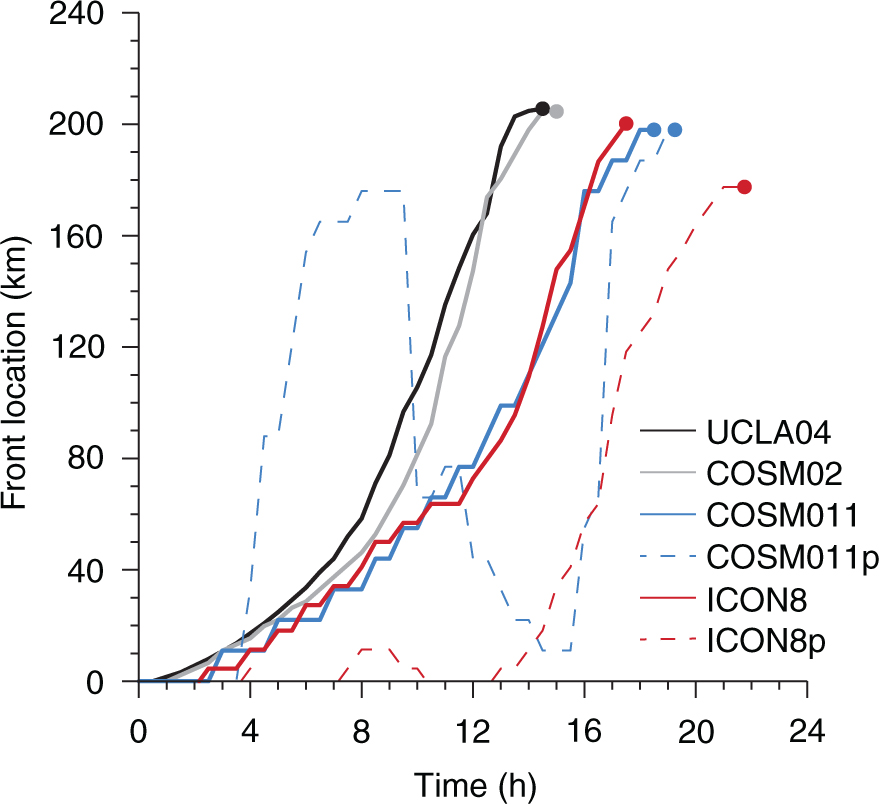
Fig. 5
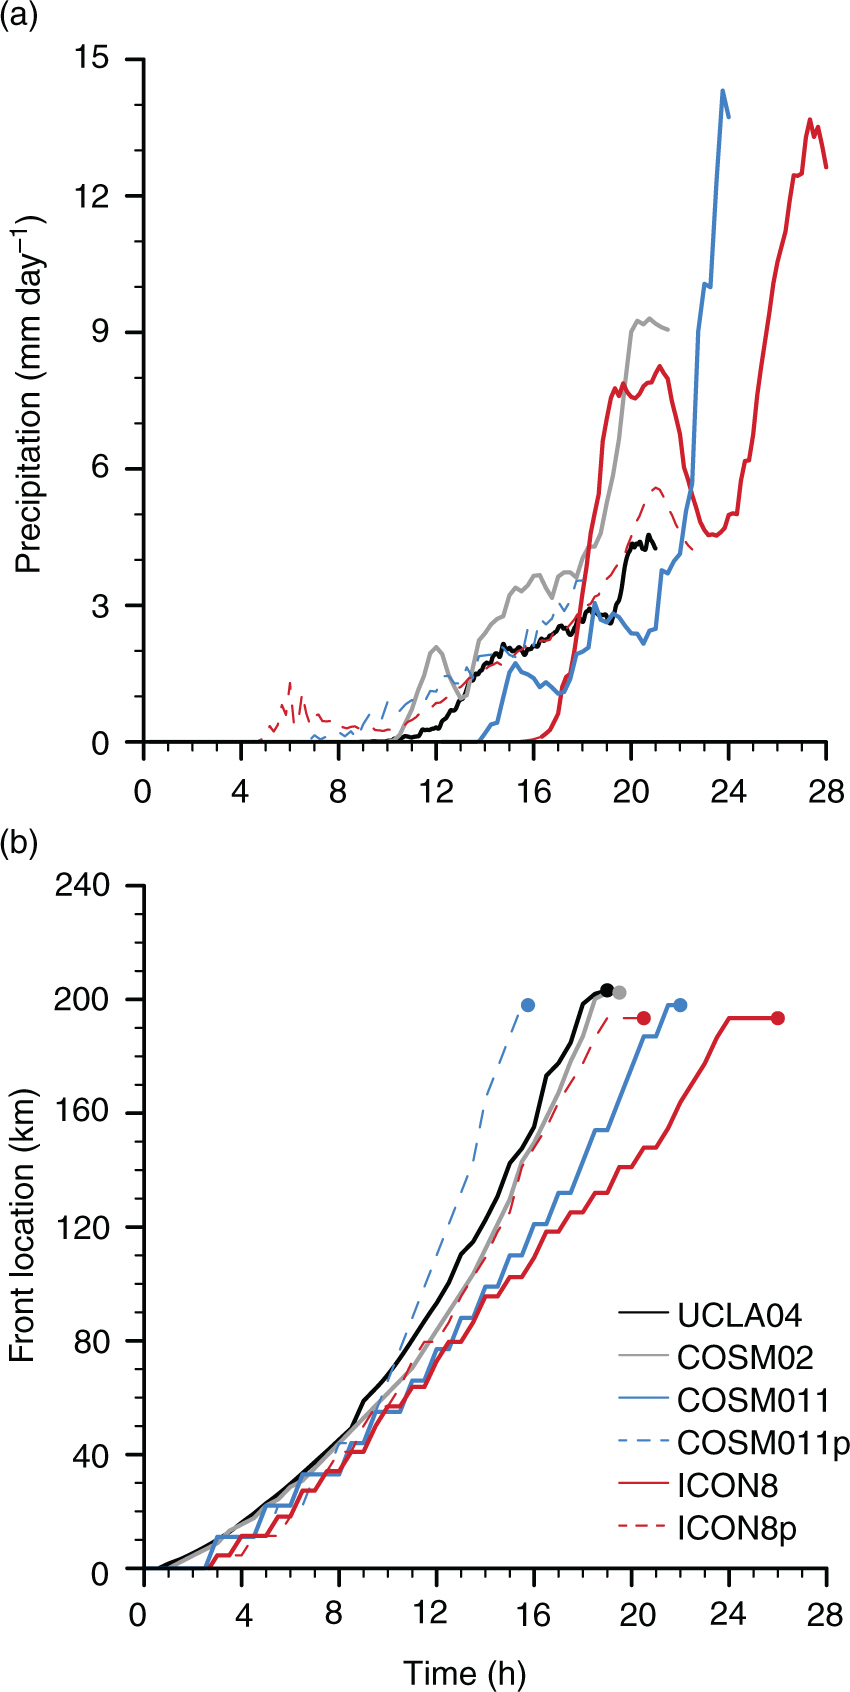
Time series of the location of the breeze front (km), measured from the coastline x=0 km, until the breeze front collides (dots) in the various experiments. Line style as in Fig. 3.
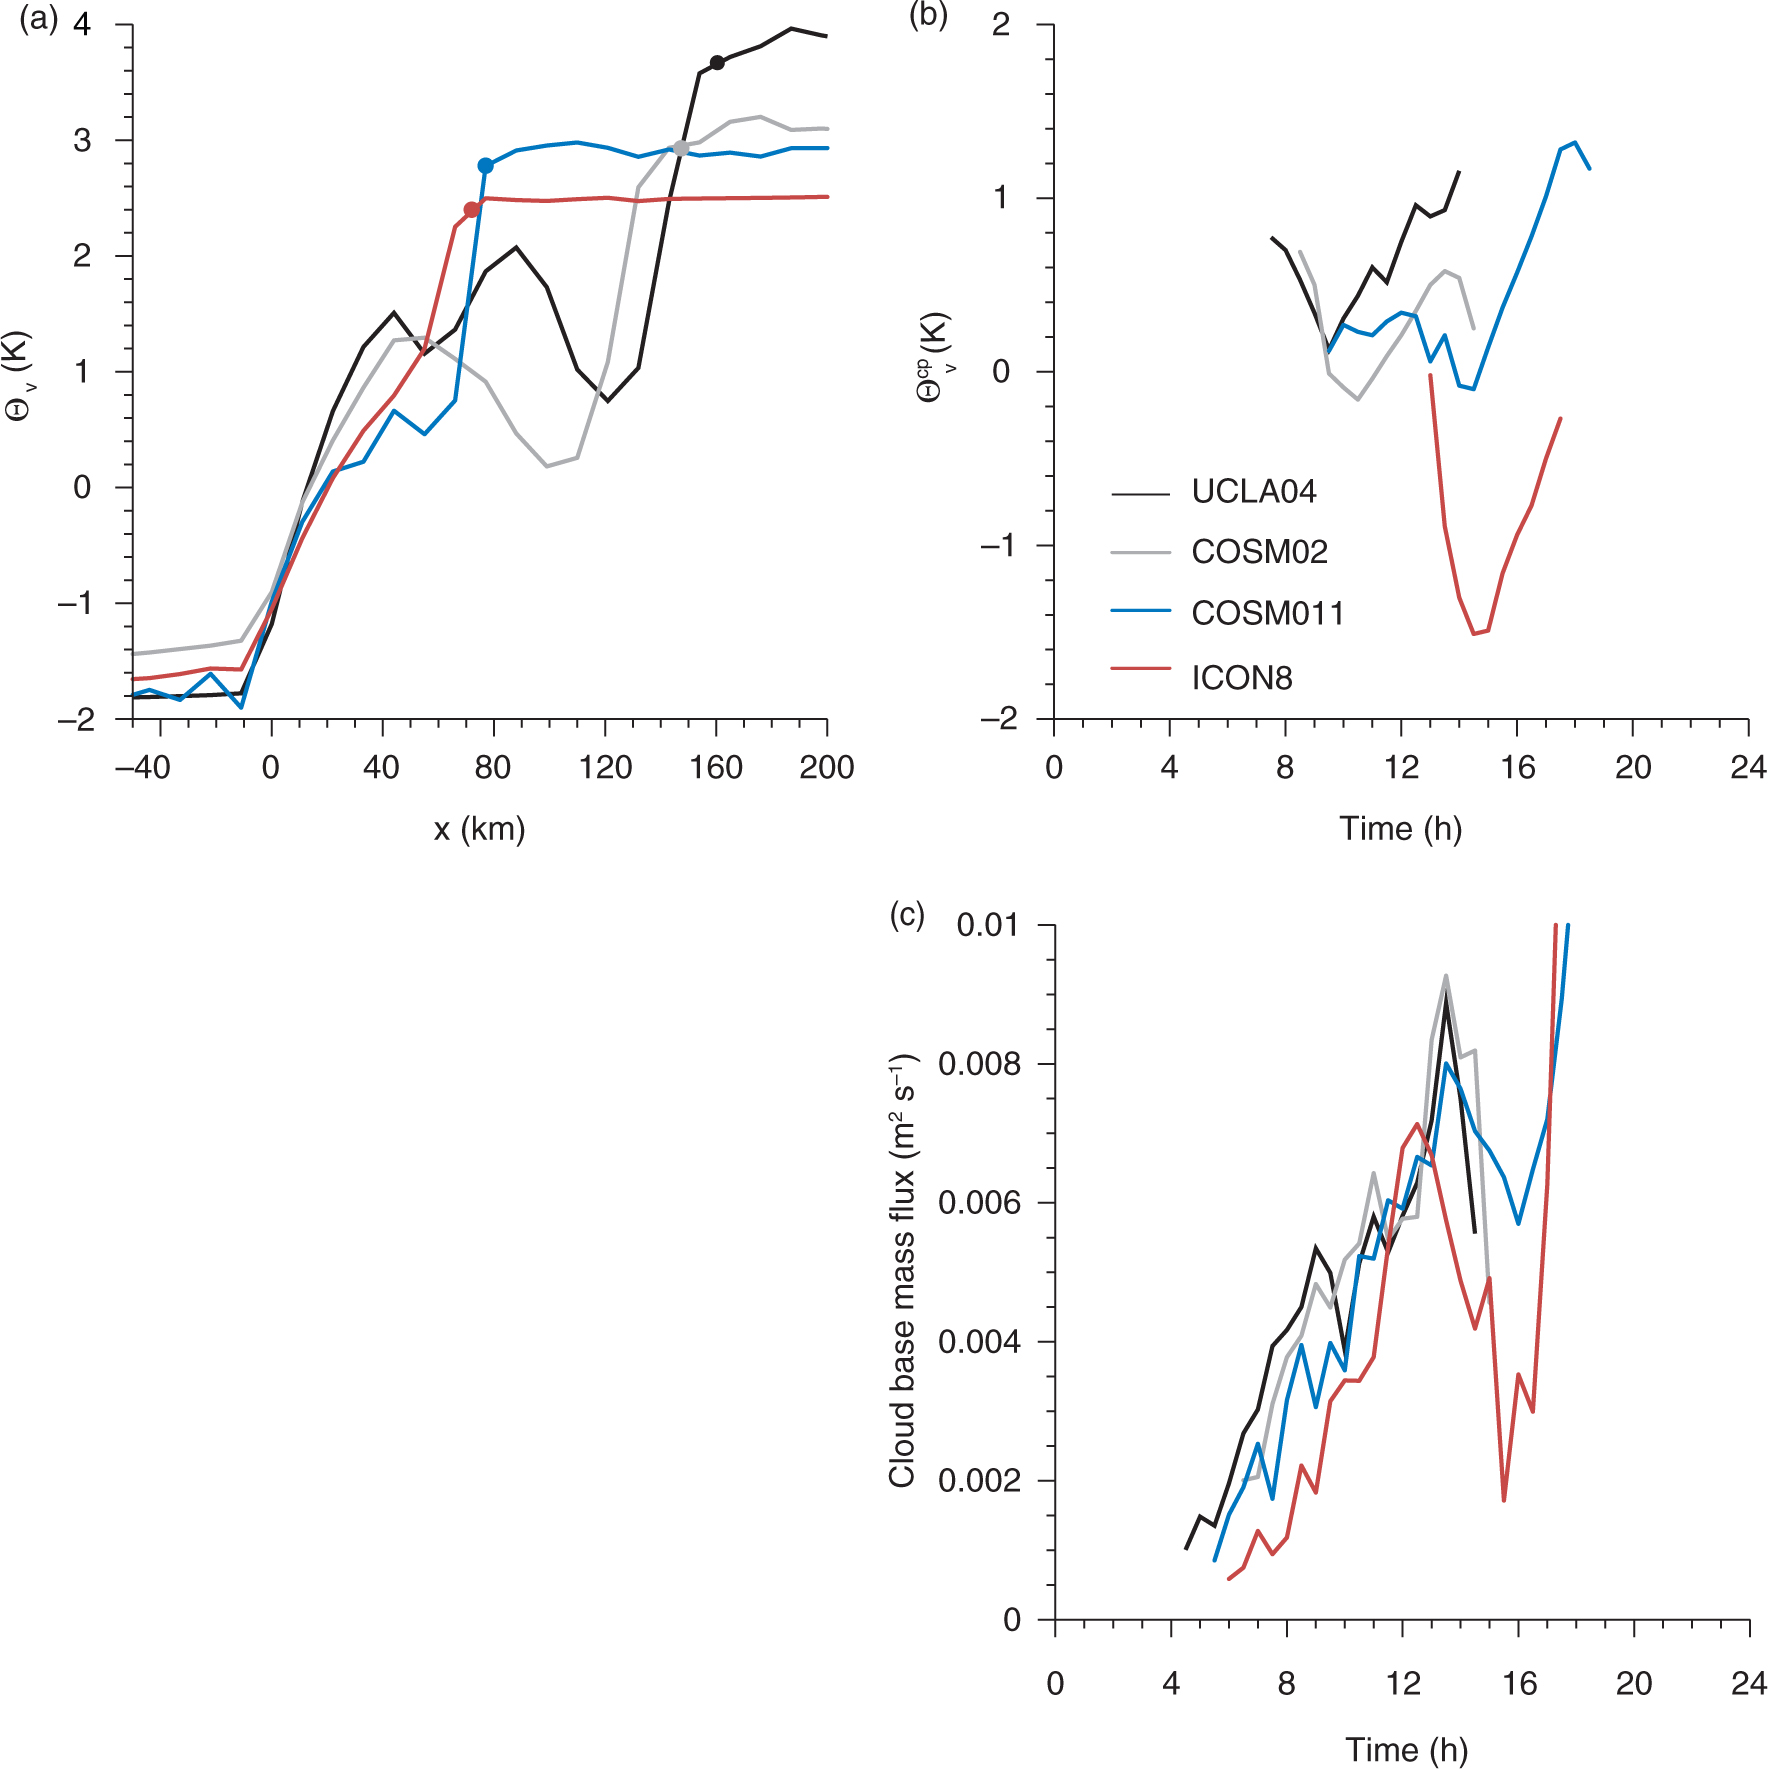
Fig. 6
Time series of (a) θ v (K) at 50 m height and 12 h and (b) (K), see text for details. Panel (c) shows the time series of the cloud base mass flux (m2 s−1). Simulations are UCLA04 (black), COSMO2 (grey), COSMO11 (blue) and ICON8 (red). All data were coarse-grained onto the COSMO11 grid.
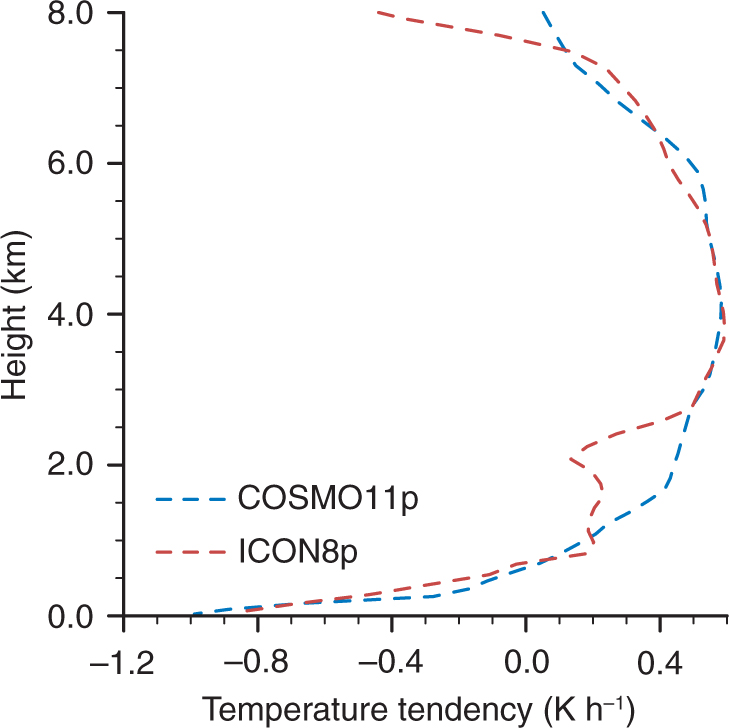
Fig. 7
Mean profile of the temperature tendency due to the convection scheme in COSMO11p and ICON8p. The time average is performed from the beginning of the simulation up to 2 h after the breeze fronts collide.
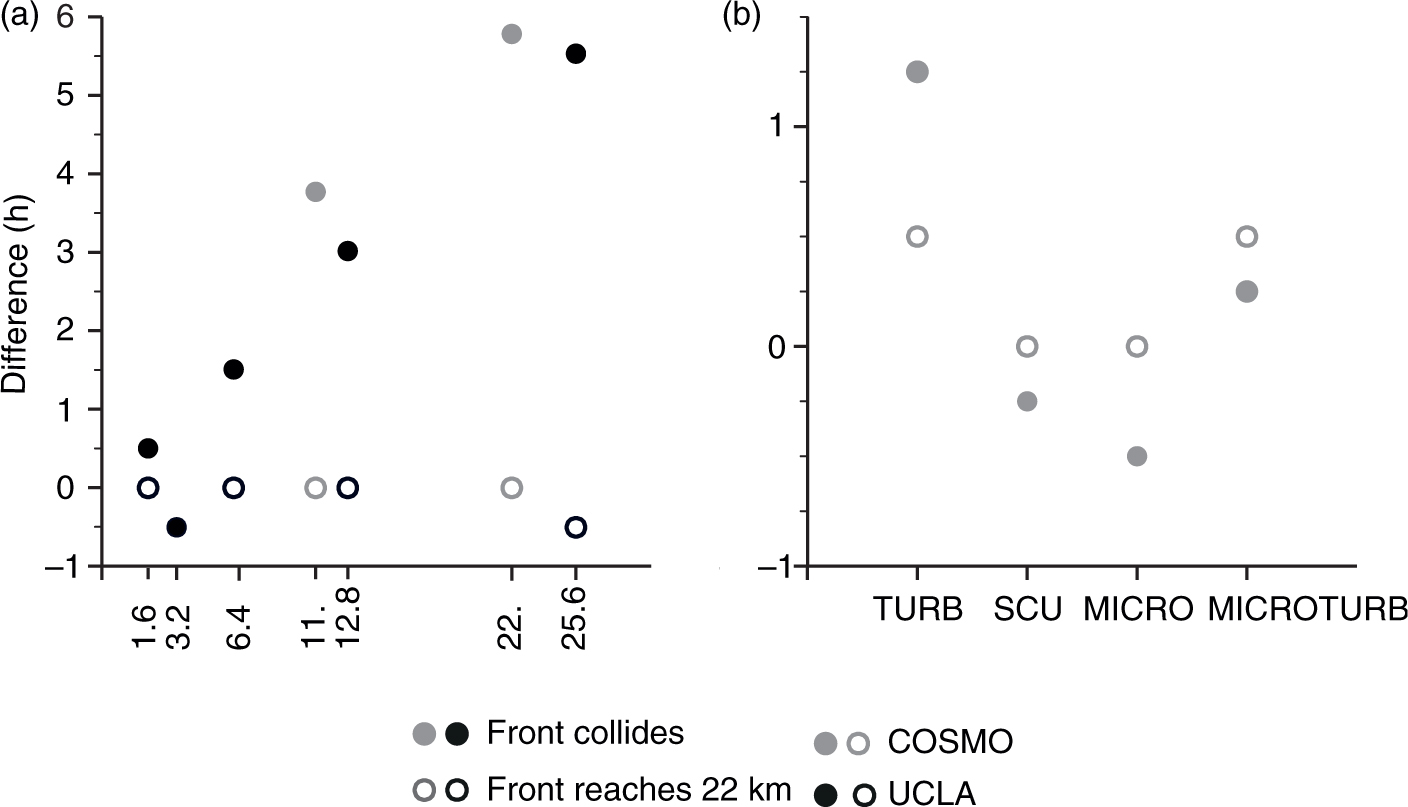
Fig. 8
Difference in time (h) it takes for the breeze front to reach 22 km (T 22, open circles) or to collide (T col, full circles) for pair of simulations. Panel (a) investigates resolution effect for simulations run with the UCLA-LES (black points) at 1.6, 3.2, 6.4, 12.8 and 25.6 km as compared to UCLA04 as well as with COSMO (grey points) at 11 and 22 km resolutions as compared to COSMO2. Panel (b) investigates effects of parameterisation choices in COSMO2: TURB for changing the turbulence scheme, SCU for shallow convection parameterisation turned on and MICRO for changing the microphysical scheme.
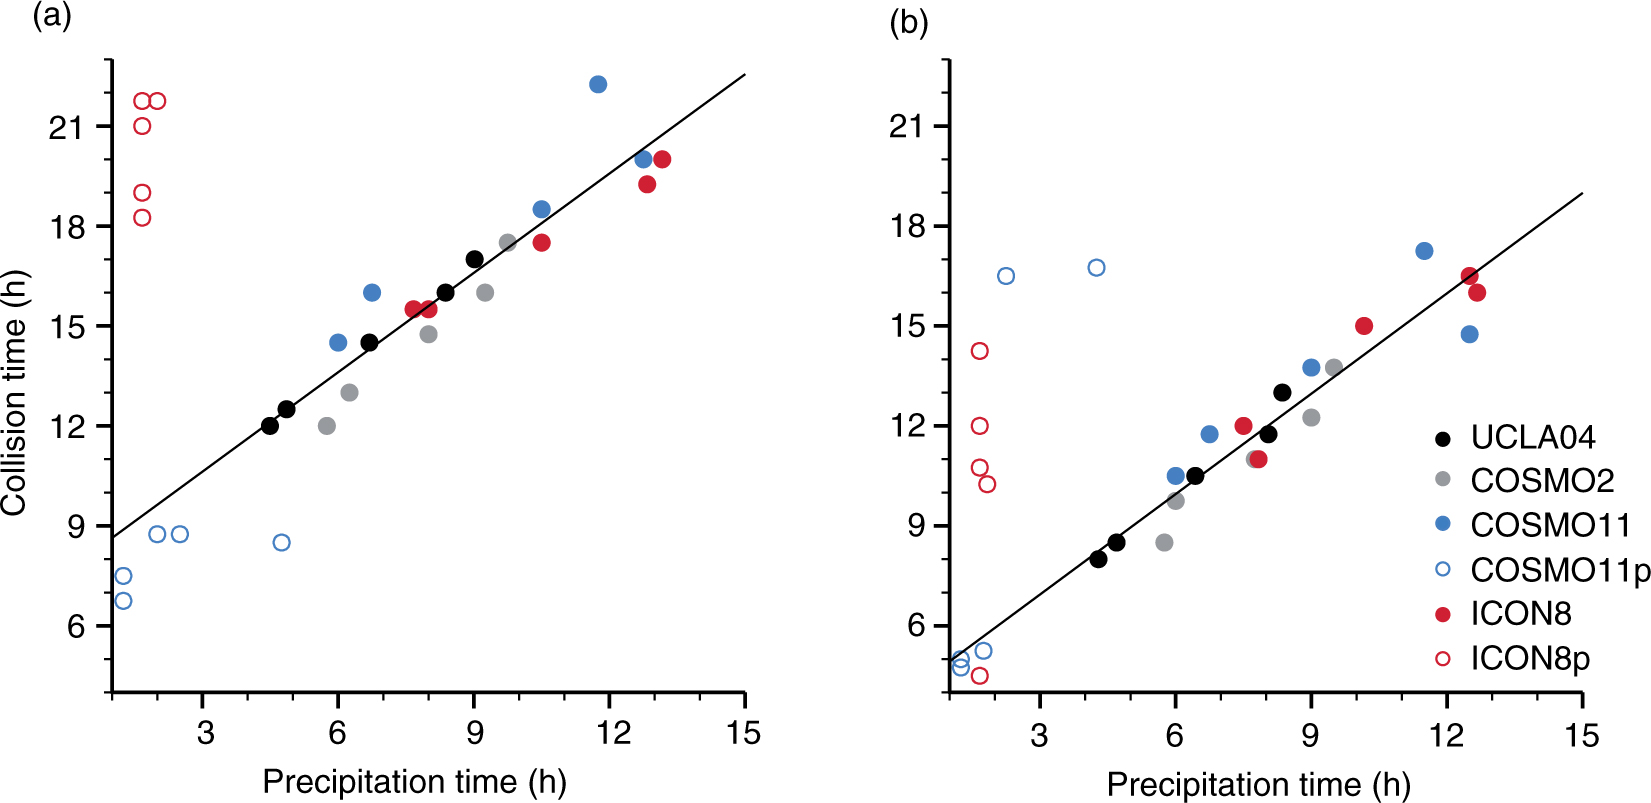
Fig. 9
Scatterplot of breeze front collision time T col (h) versus time precipitation exceeds 2 mm day−1 for simulations with various values of sensible or latent heat fluxes over land. Simulations in (a) are integrated over the full domain of 819.2 km by 404 km; simulations in (b) utilise a domain size of 409.6 km by 404 km.