
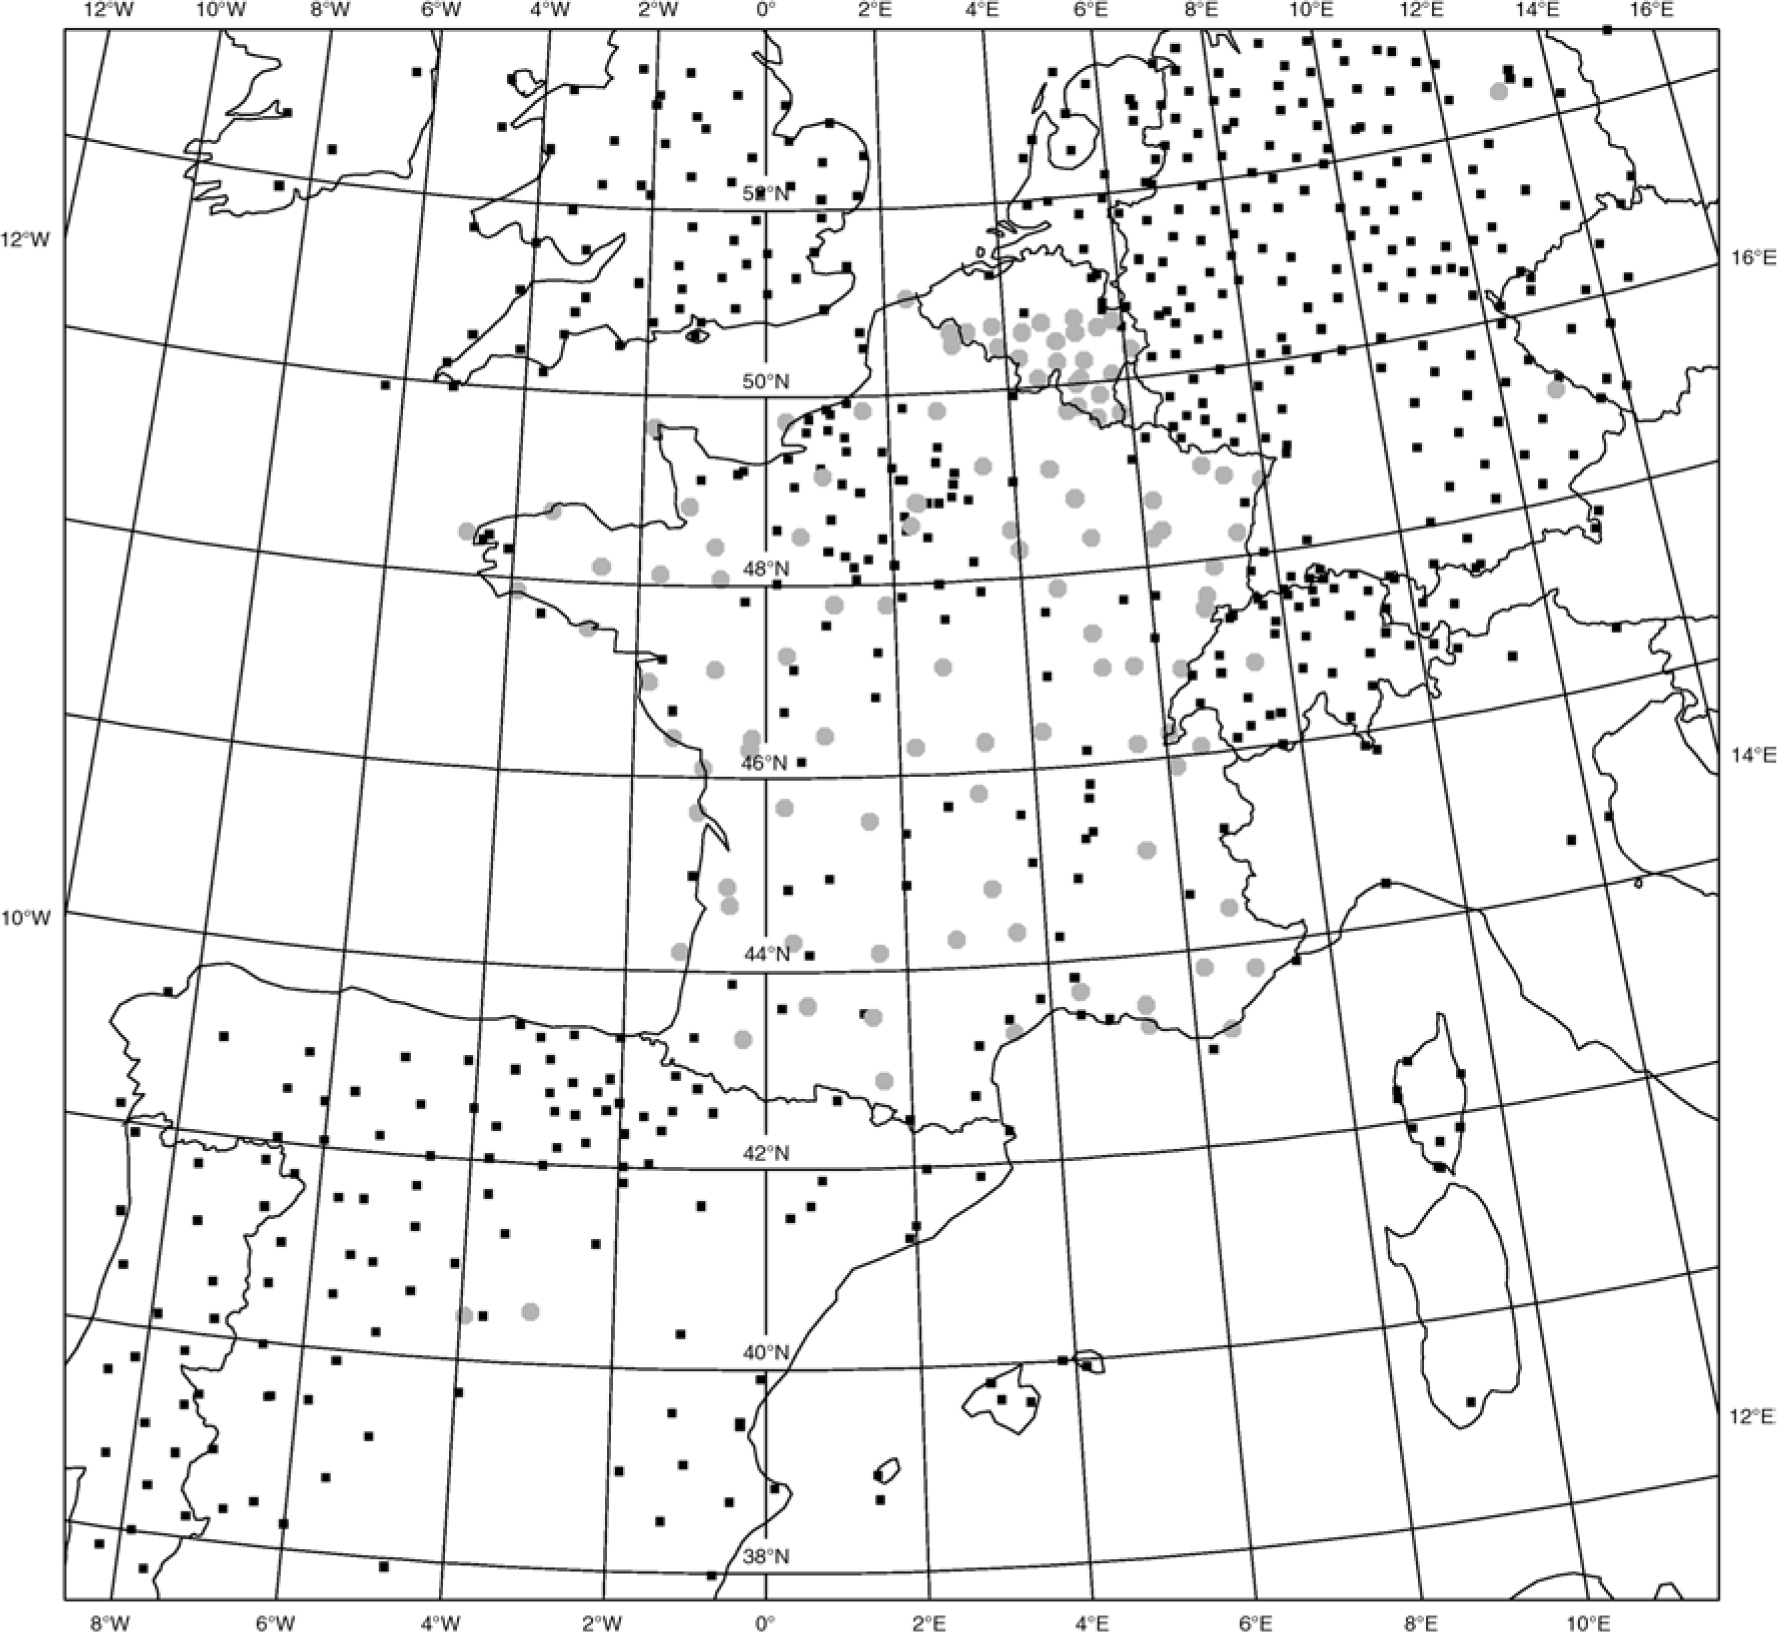
Fig. 1
Map of the domain of the AROME model with the GPS stations selected from assimilation on the 18 July 2013 at 03 UTC. The black squares correspond to the stations provided through the E-GVAP network (EGVAP). The grey circles correspond to the new stations processed by the University of Luxembourg (UL01). Note that except for stations located in Belgium, the UL01 stations are also processed by other analysis centres.
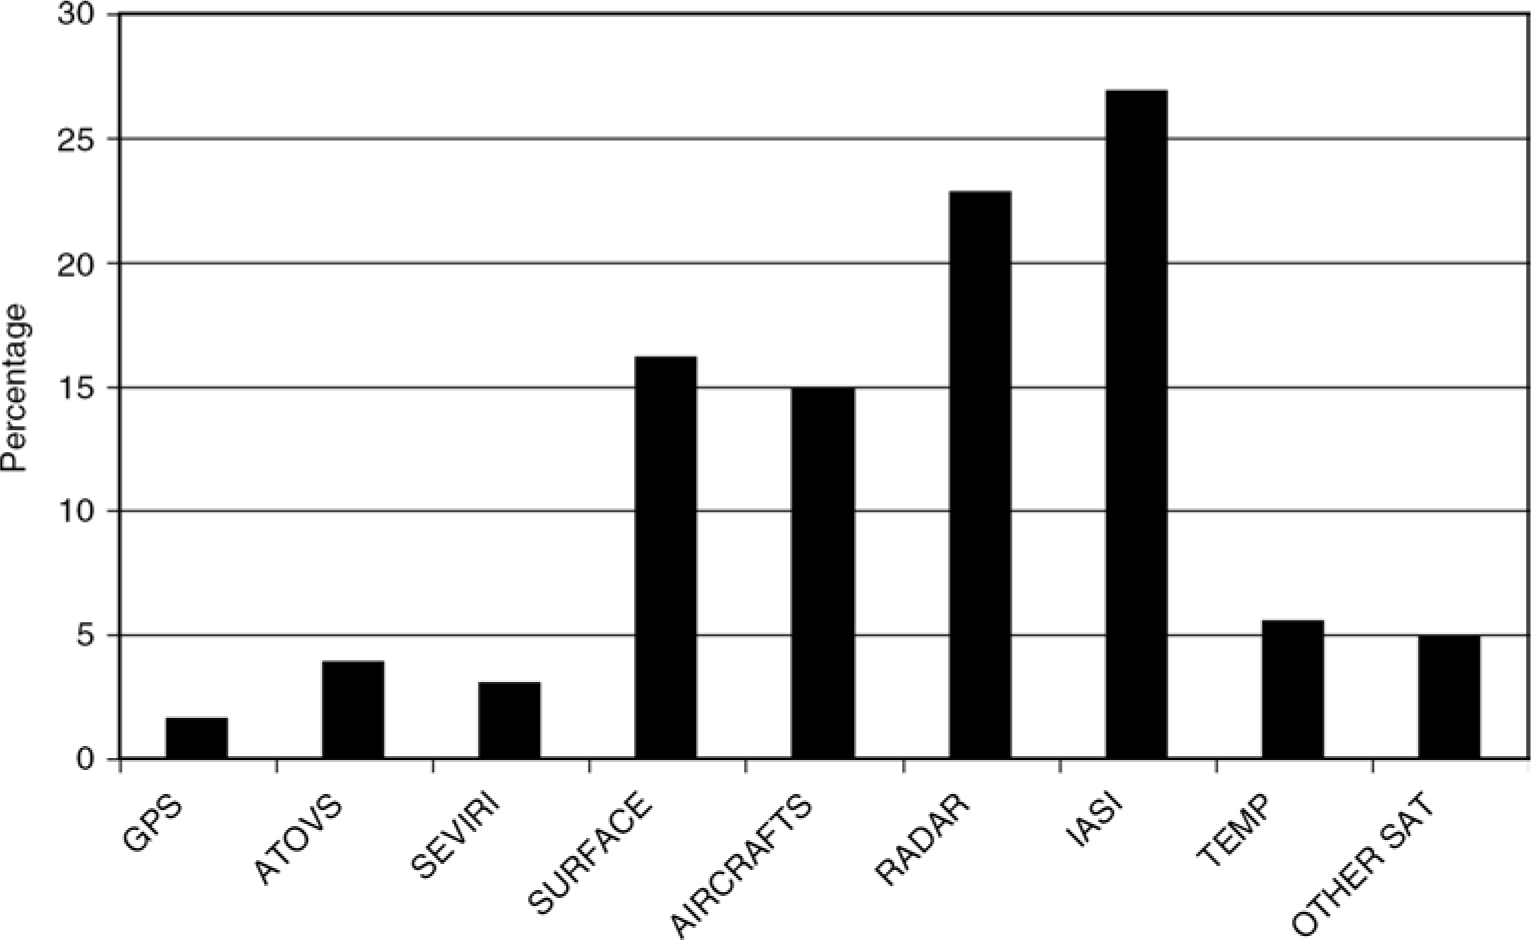
Fig. 2
Number of observation types (expressed in percentage) assimilated in the operational 3D-Var AROME system on 26 January 2014. The total number of observations is 309 393.
Table 1. Summary of the 3D-Var assimilation experiments in the AROME model undertaken with different observing systems. E-GVAP corresponds to ZTD data provided operationally through the EUMETNET programme E-GVAP. UL01 corresponds to a data set processed by the University of Luxembourg for the current study.
NOGPSAll observations minus E-GVAP ZTDEGVAPAll observations (operational configuration)UL01All observations plus UL01 ZTD
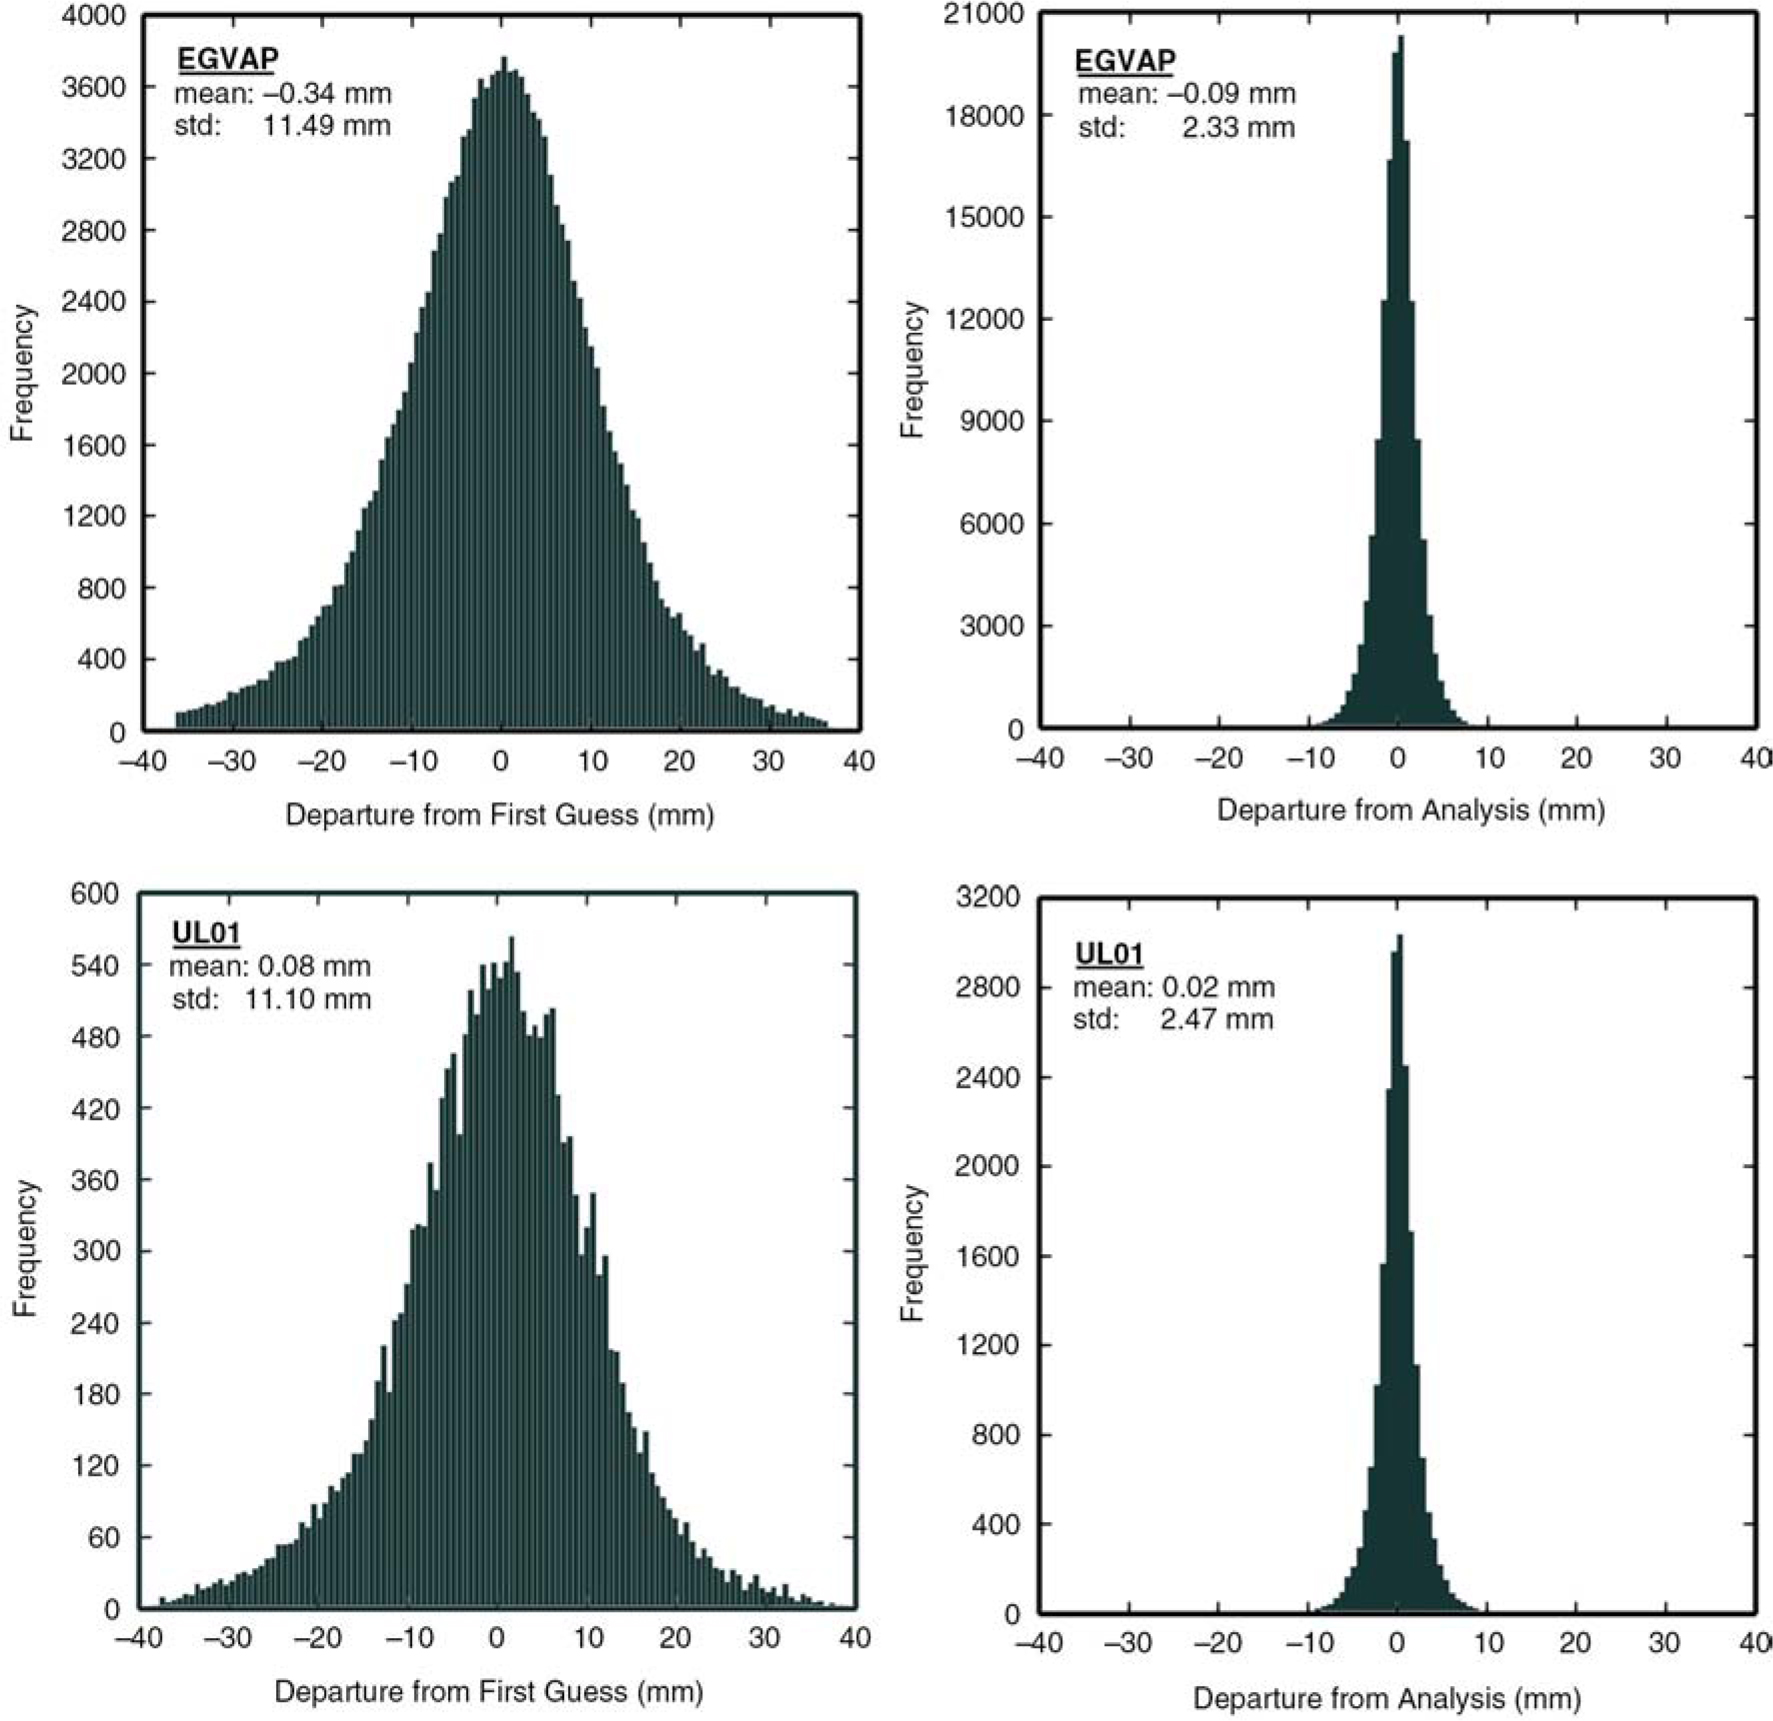
Fig. 3
Histograms of background (left) and analysis (right) departures for GTS ZTD from experiments EGVAP and UL01. Statistics are computed between 18 July 2013 and 21 August 2013. The upper row corresponds to E-GVAP stations (sample size: 147591) and the lower row corresponds to UL01 stations (sample size: 20572).
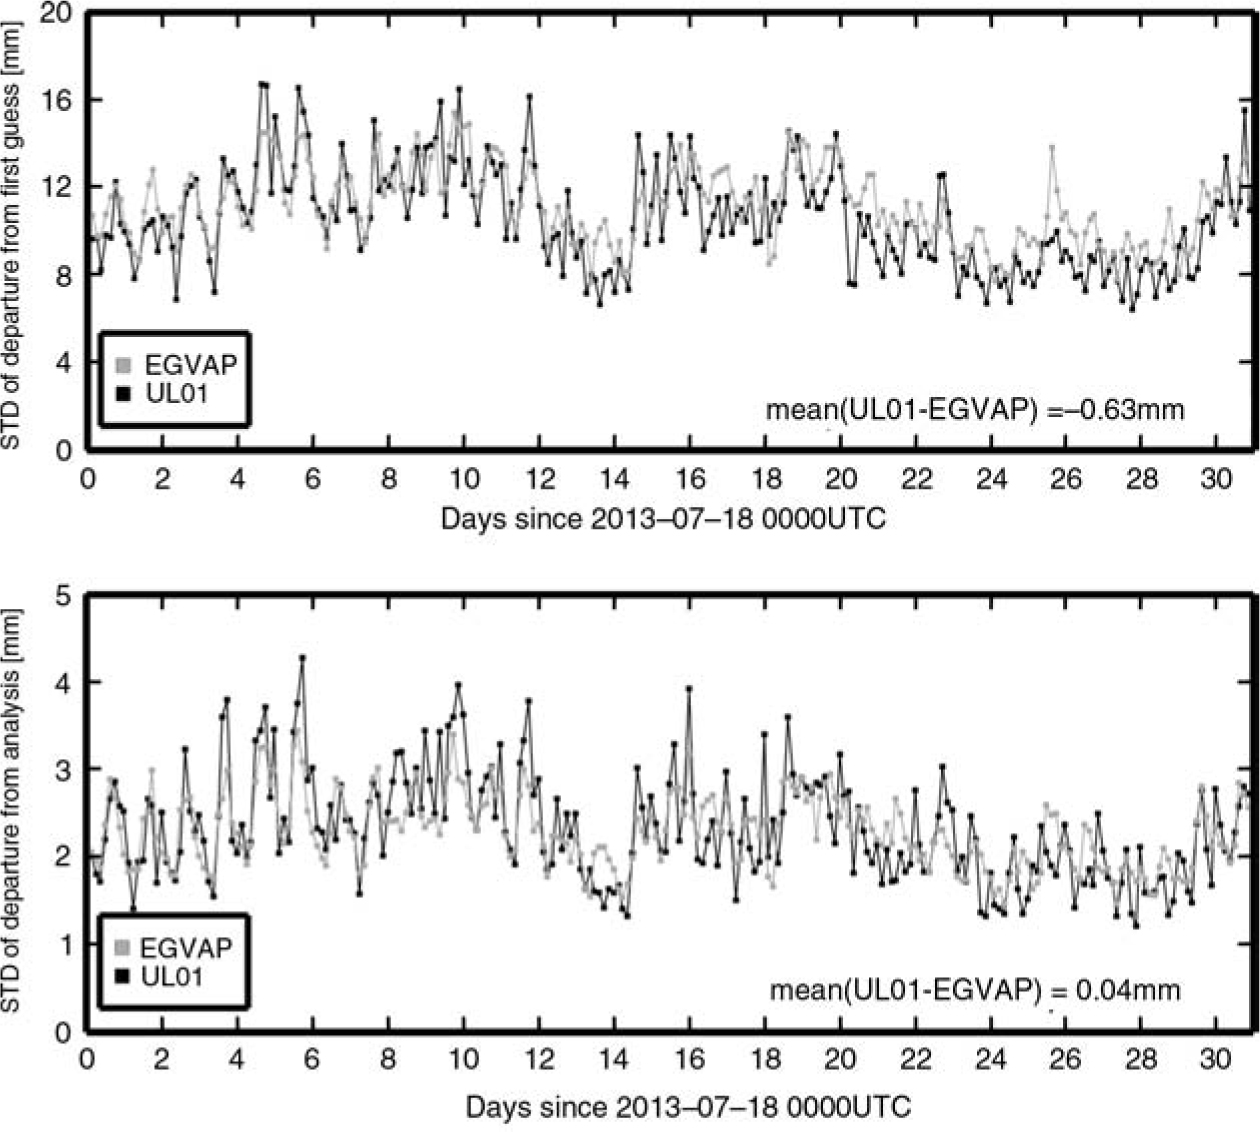
Fig. 4
Time series of background and analyses departures between 18 July 2013 and 21 August 2013 for EGVAP and UL01 stations. The upper panel corresponds to the background departures (OmB) and the lower panel corresponds to the analysis departures (OmA).
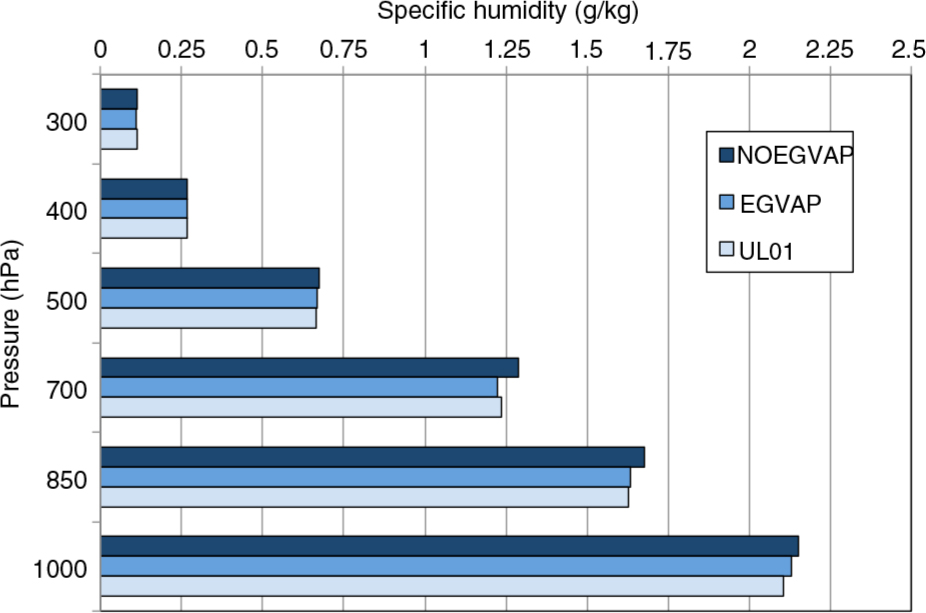
Fig. 5
Statistics of background departures for specific humidity from radiosoundings (STD errors in g/kg) computed from 18 July to 20 August 2013.
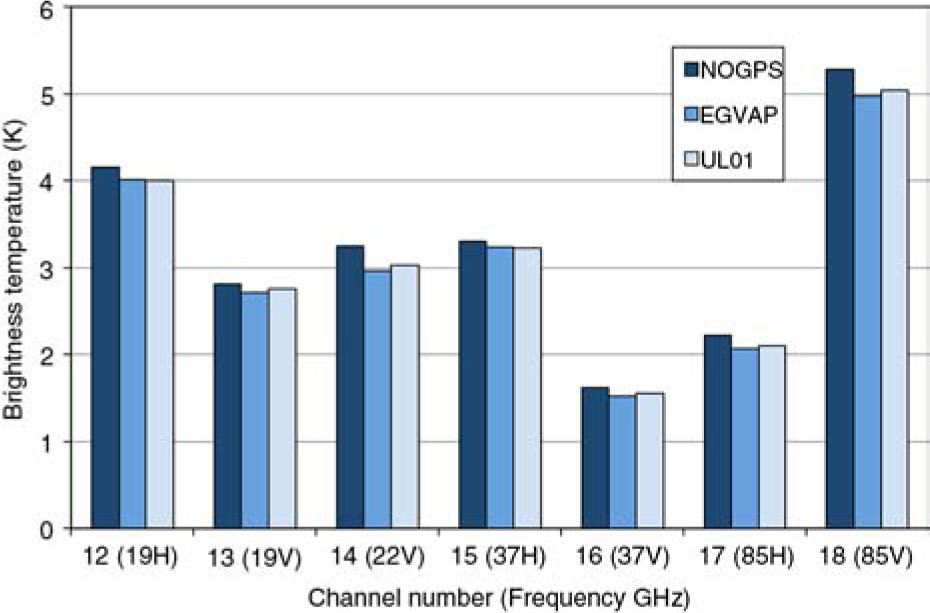
Fig. 6
Statistics of background departures for the brightness temperature of the microwave radiometer SSMI/S on board DMSP F18 (STD errors in K) computed from 18 July to 20 August 2013.
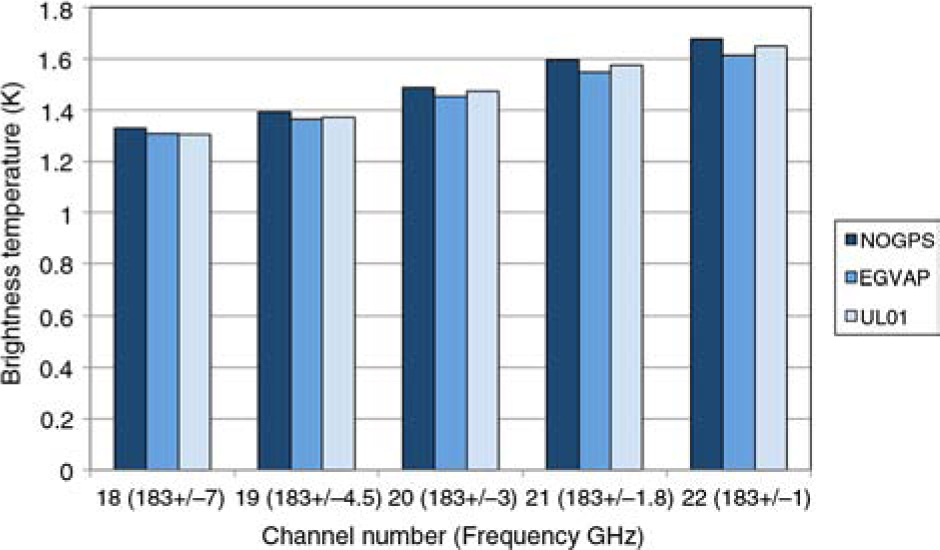
Fig. 7
Statistics of background departures for the brightness temperature of the microwave sounder ATMS on board Suomi-NPP (STD errors in K) computed from 18 July to 20 August 2013.
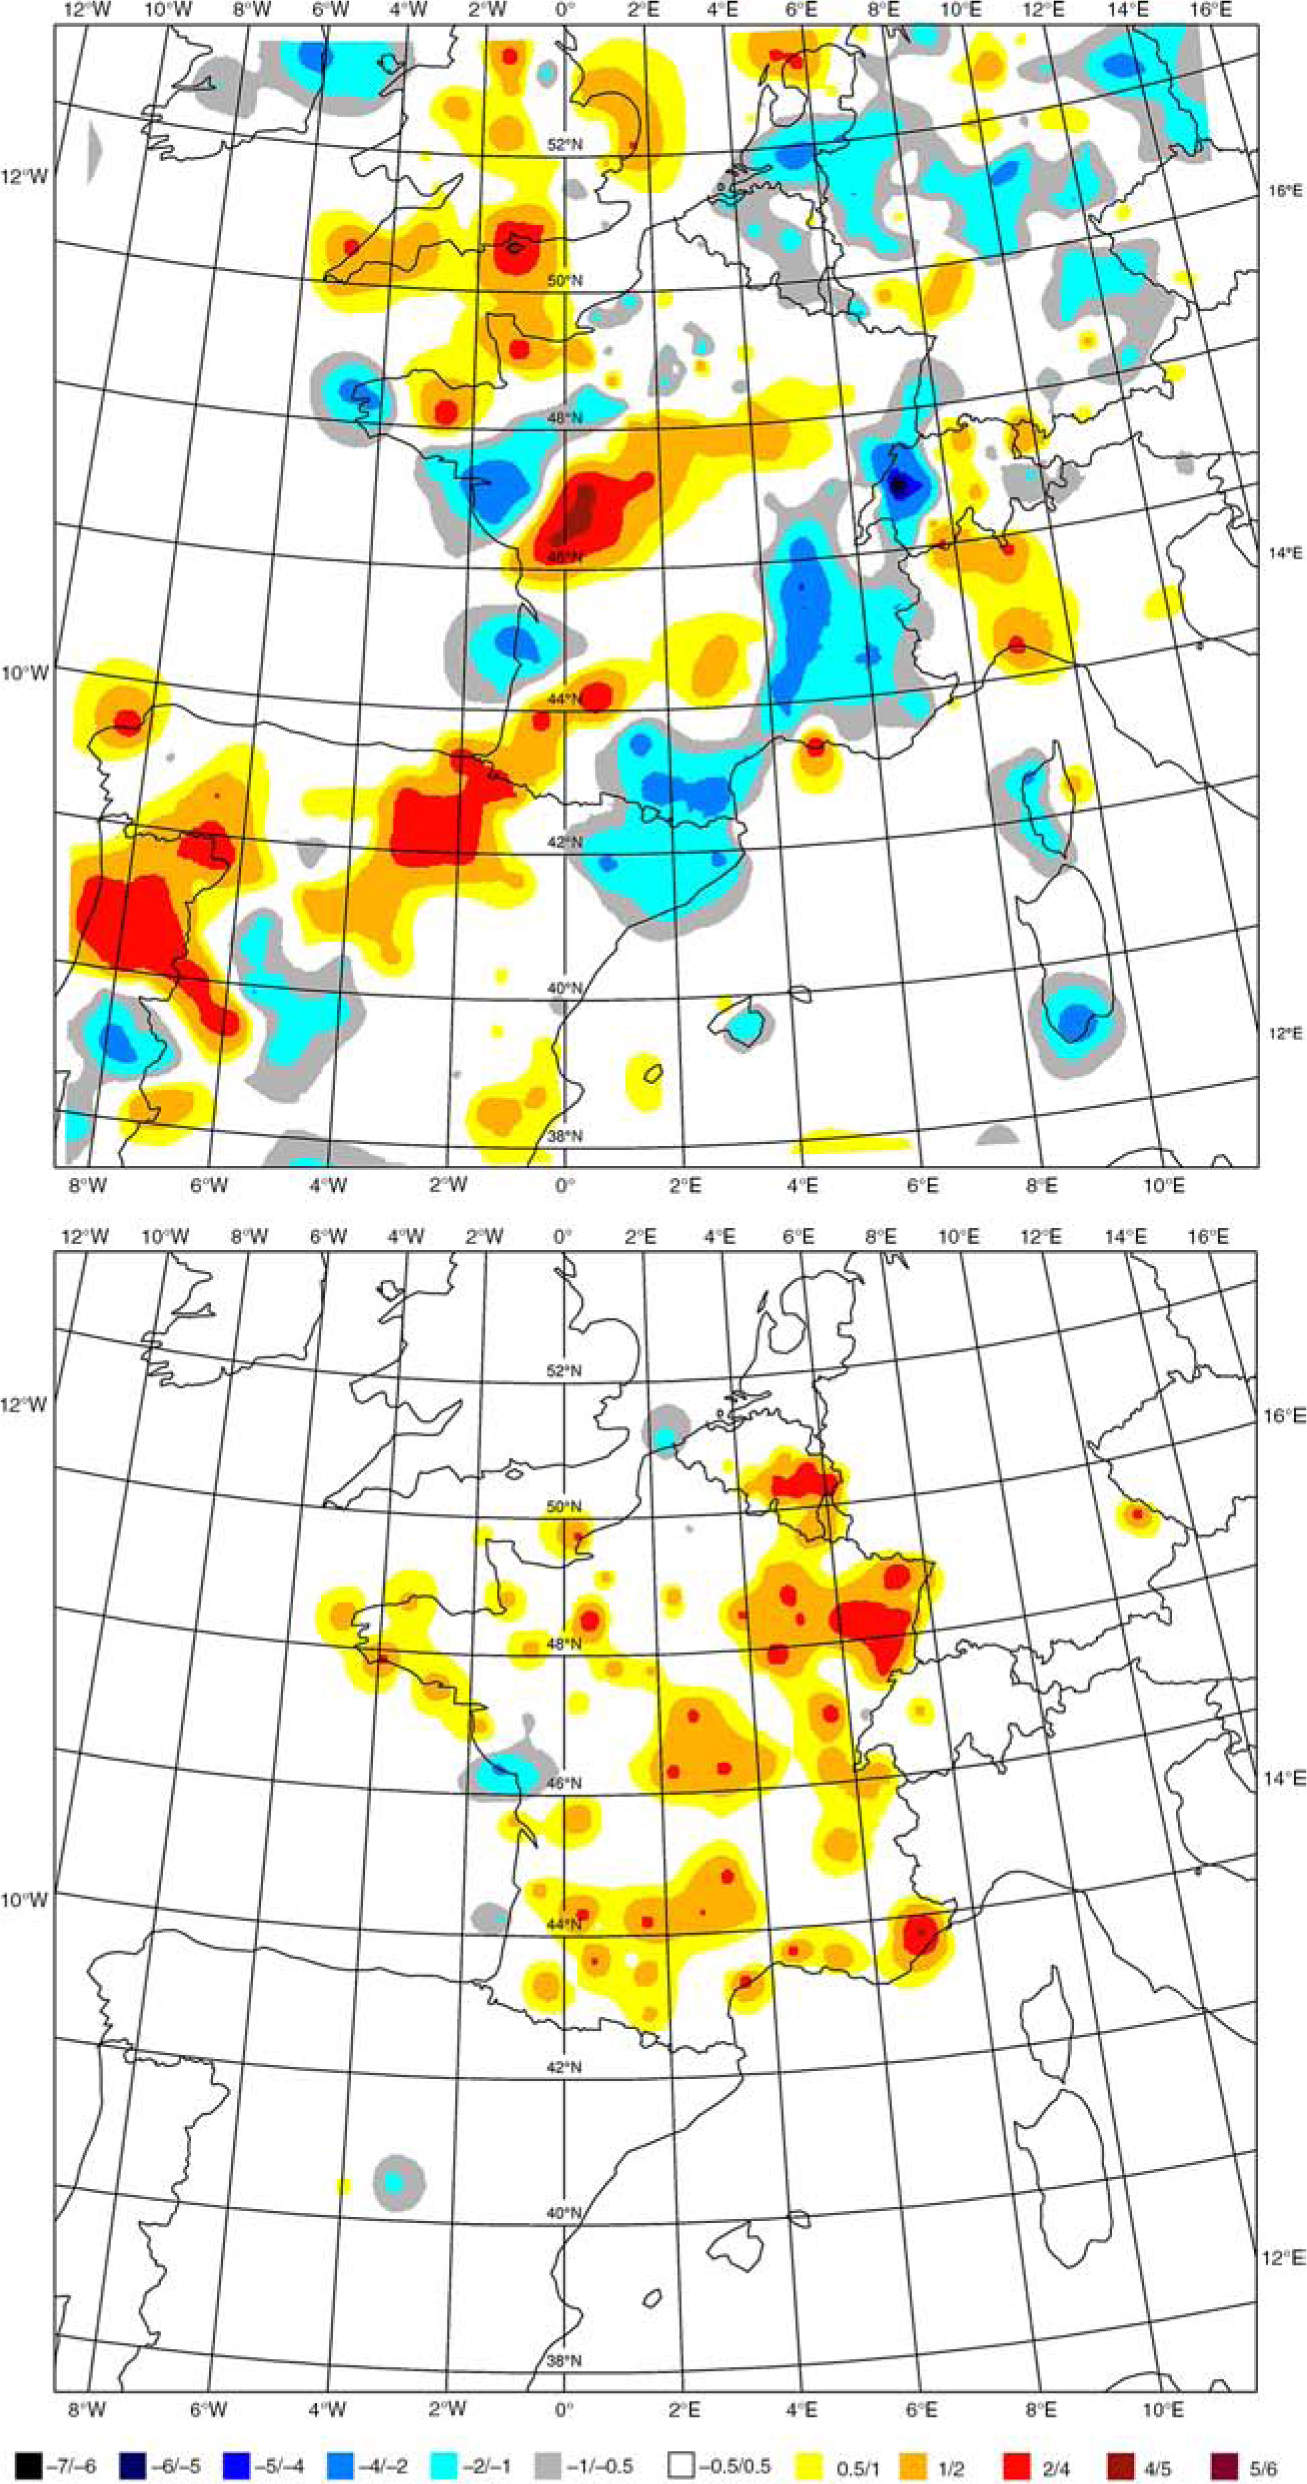
Fig. 8
Differences in Integrated Water Vapour (IWV) analyses between experiments EGVAP and NOGPS (top panel) and UL01 and EGVAP (bottom panel) on the 18 July 2013 at 0300 UTC (unit is mm).
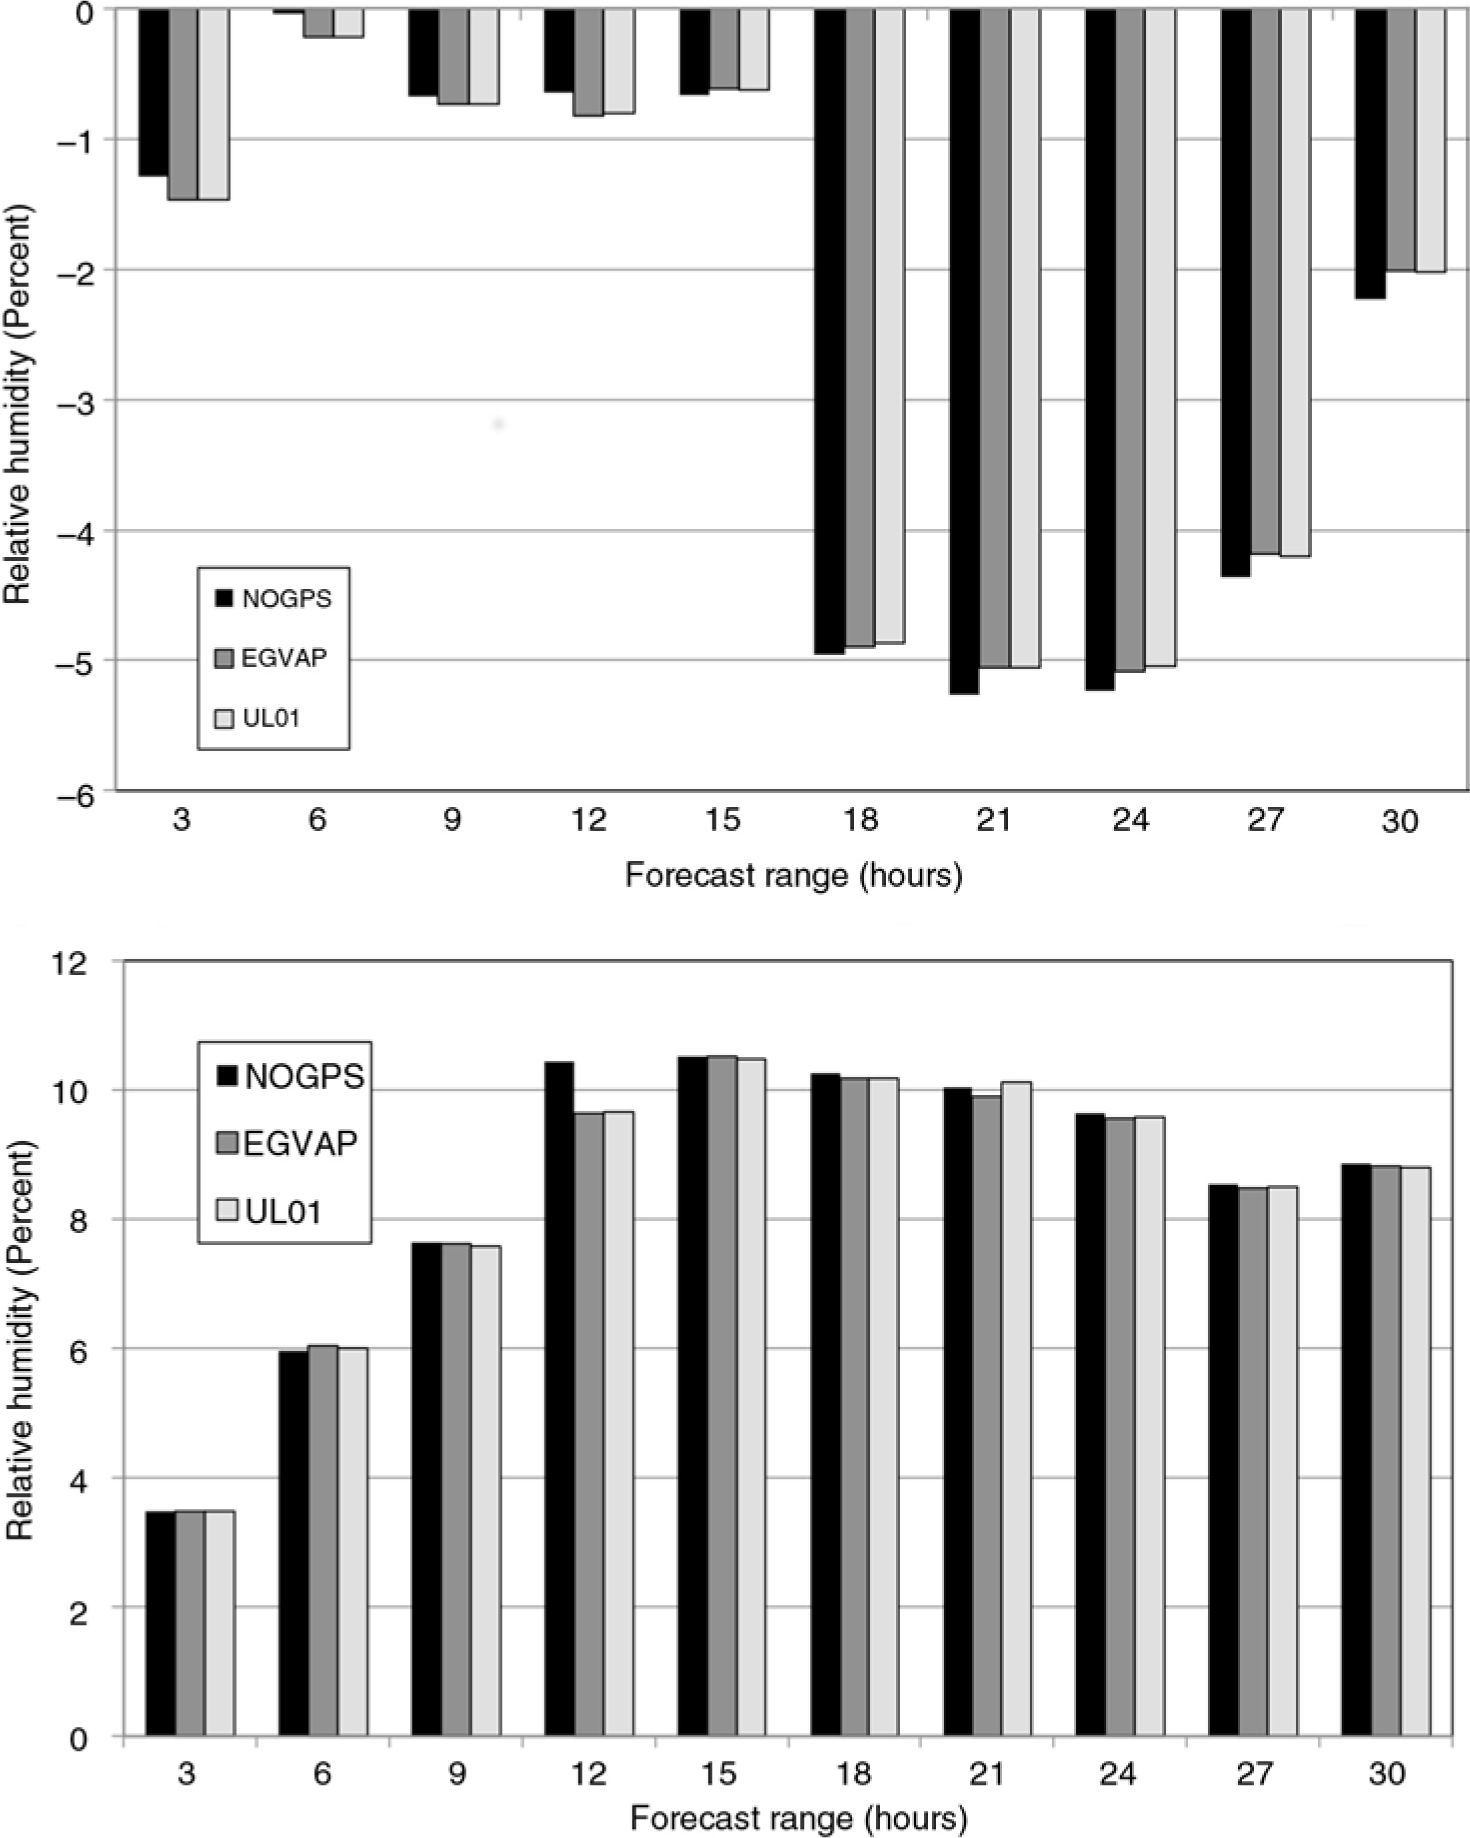
Fig. 9
Mean (top panel) and standard deviation (bottom panel) forecast errors of screen-level relative humidity (%) according to forecast range (hours) for the three experiments NOGPS, EGVAP and UL01. The scores are averaged from 20 July to 20 August 2013 and are computed against screen-level relative humidity analyses.
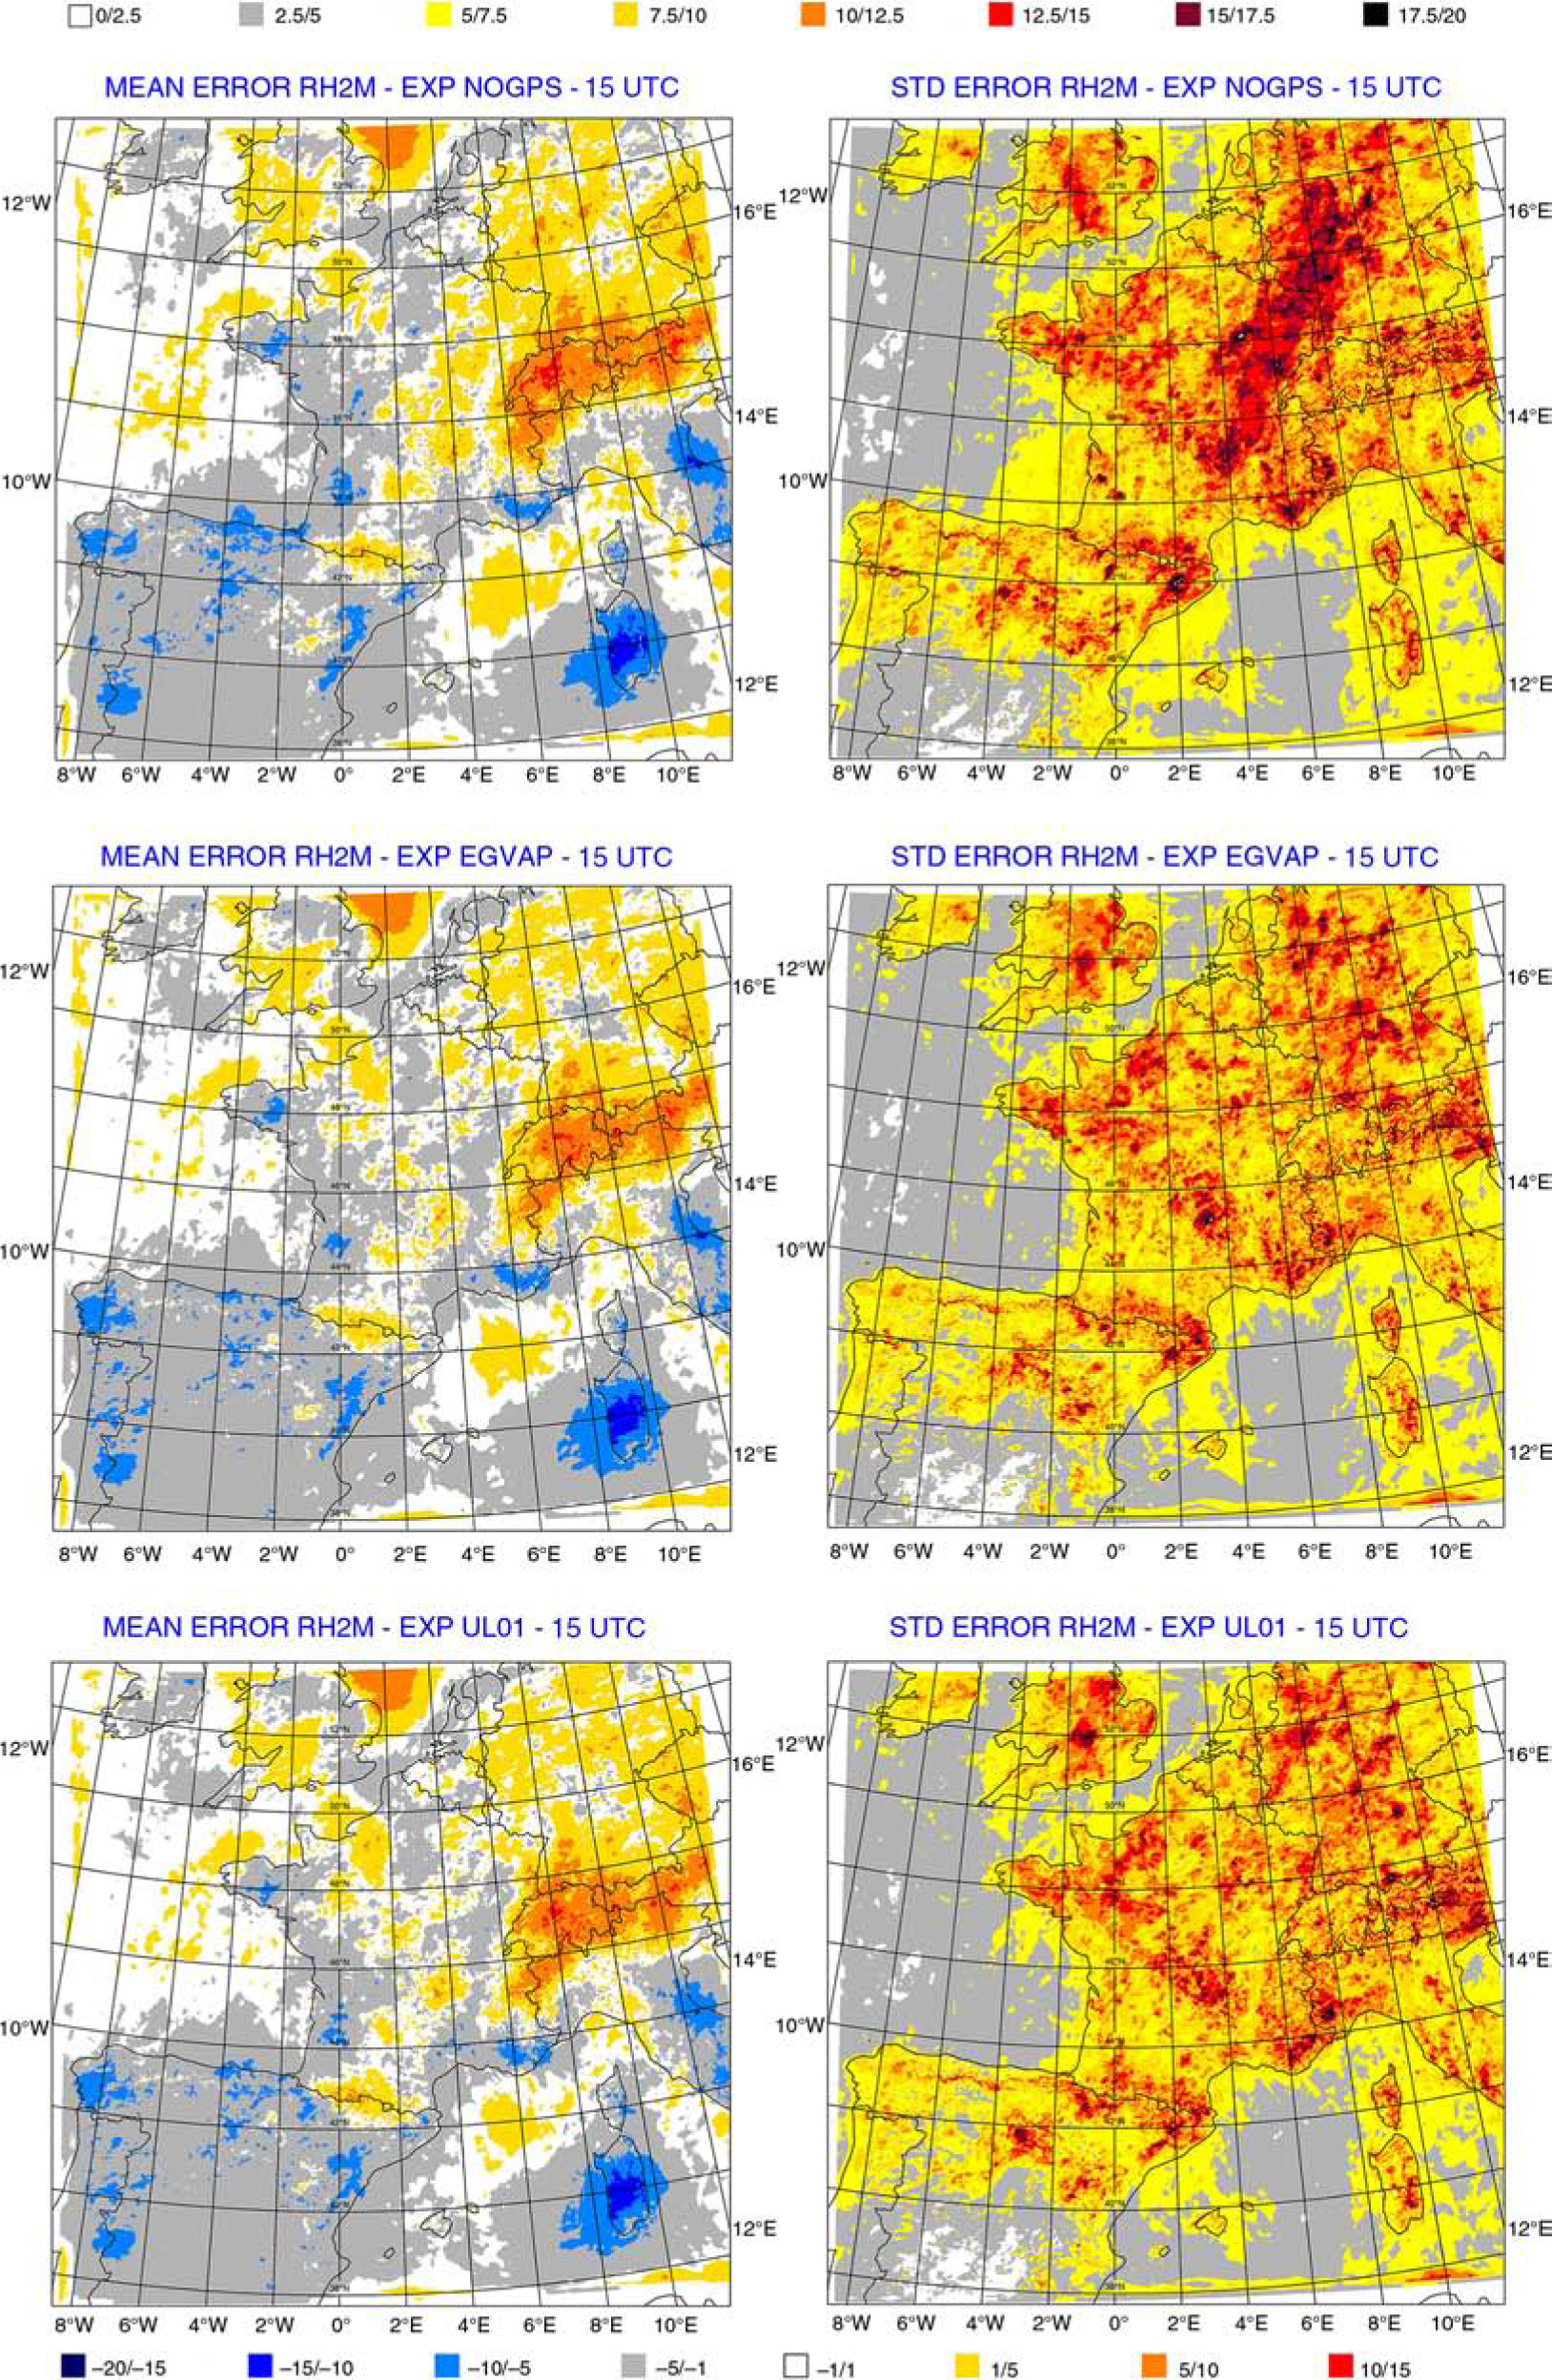
Fig. 10
Mean and standard deviation of screen-level relative humidity 12-hour forecast errors (15 UTC) in percentages for experiments NOGPS (top panels), EGVAP (middle panels) and UL01 (lower panels) averaged from 20 July to 20 August 2013.
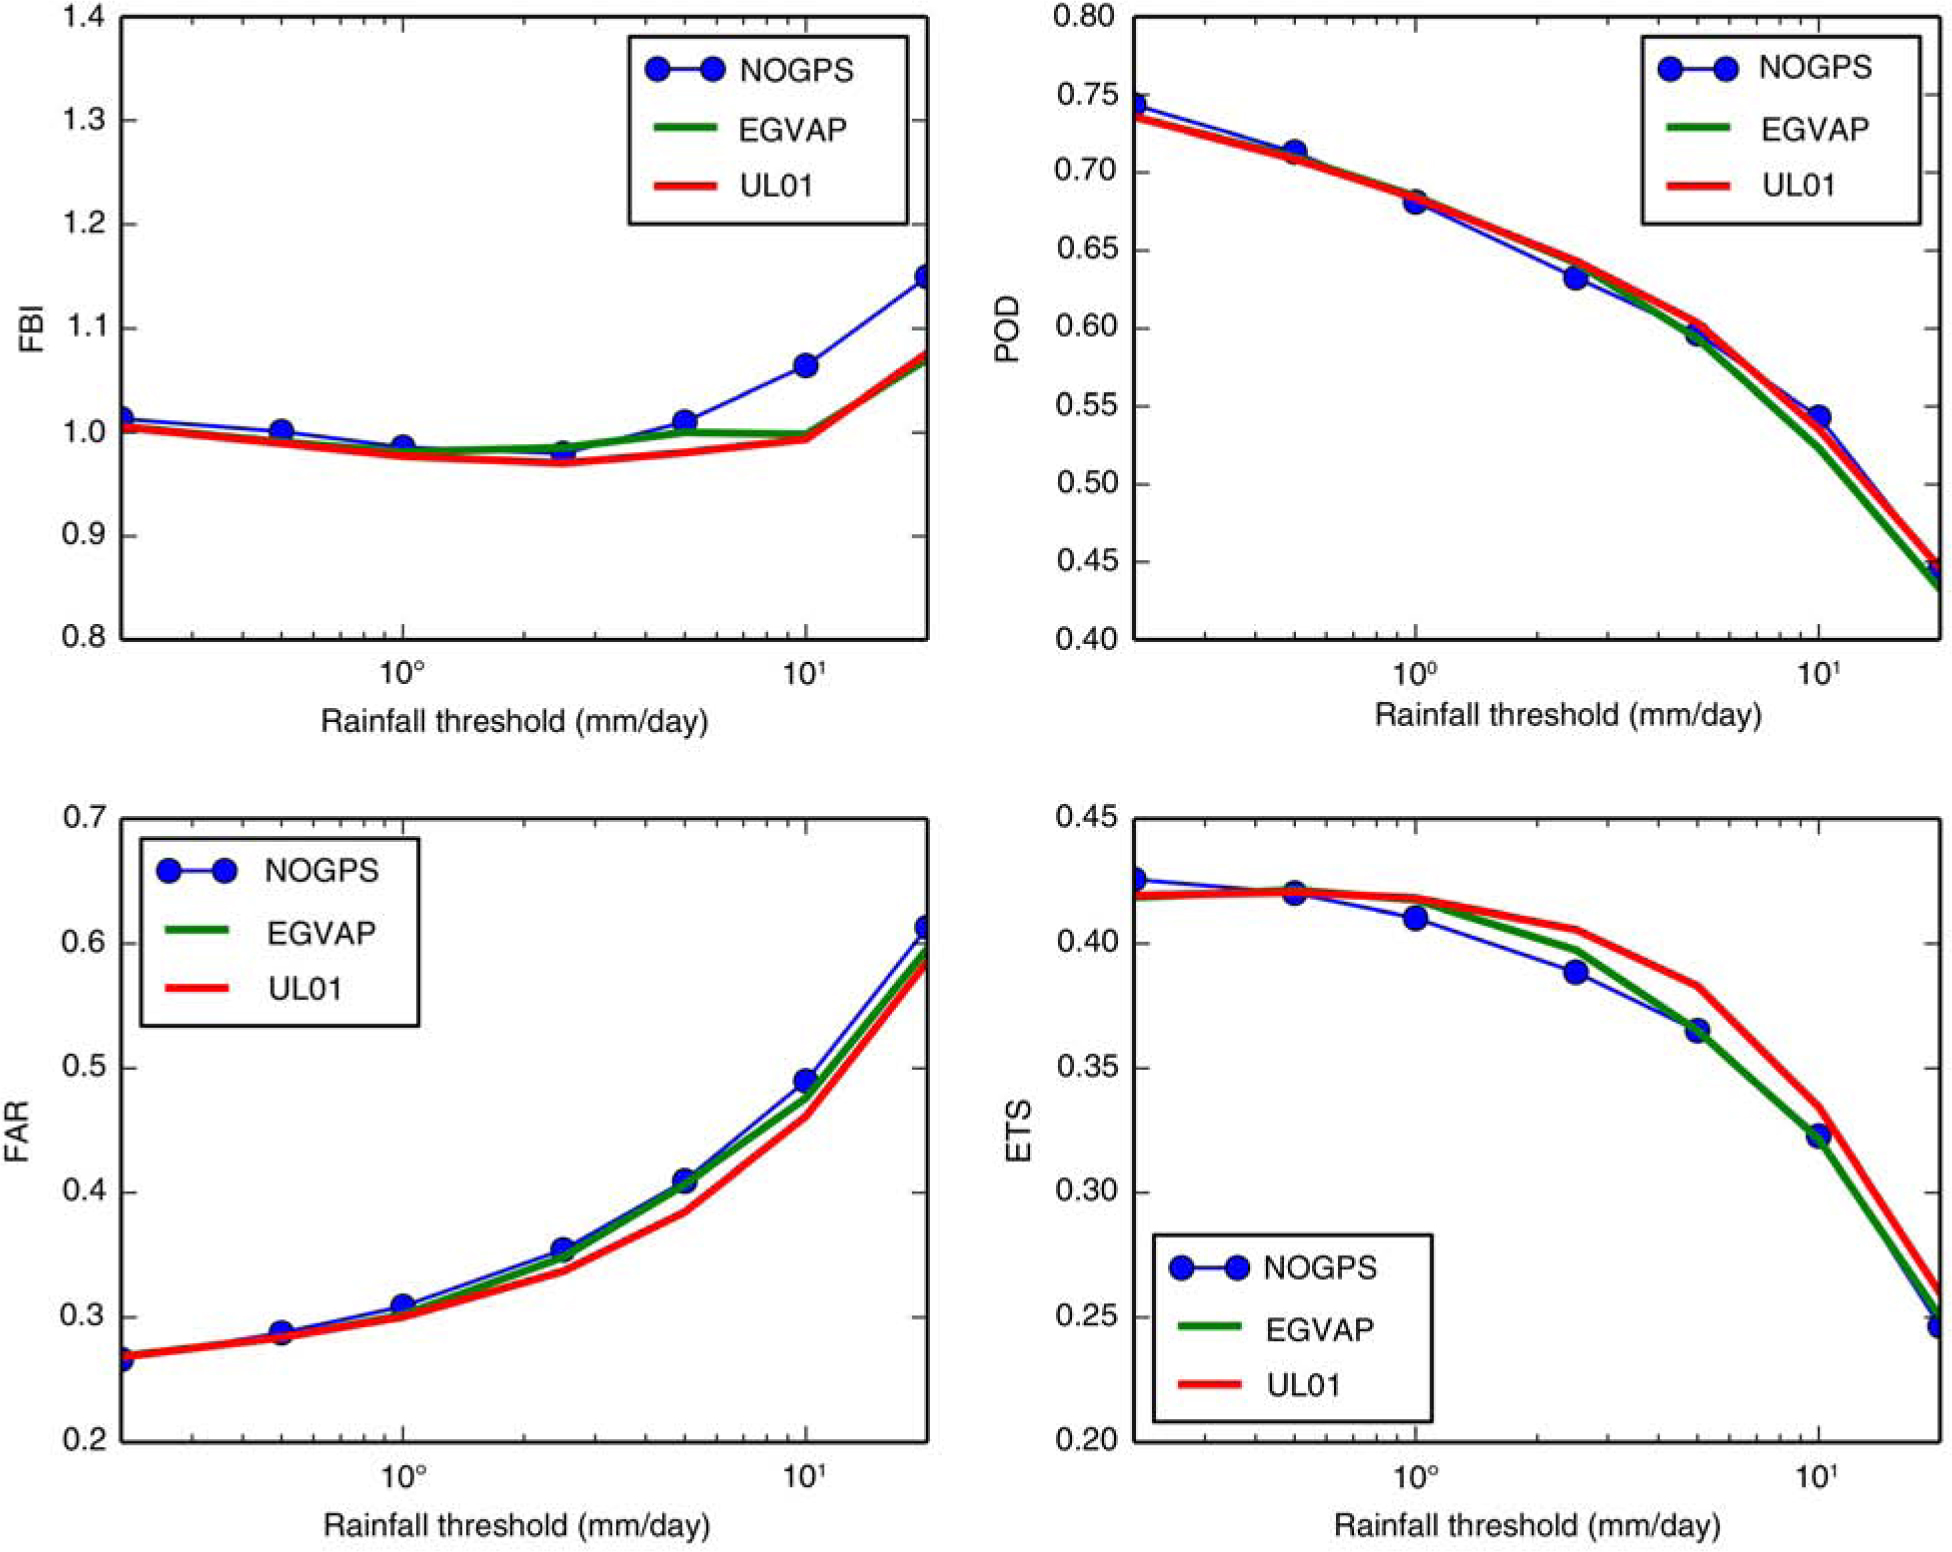
Fig. 11
Categorical scores (FBI: Frequency Bias Index; POD: Probability of Detection; FAR: False Alarm Ratio; ETS: Equitable Threat Score) for daily accumulated precipitation AROME forecasts from the three experiments: NOGPS, EGVAP, UL01 compared with ANTILOPE precipitation analyses over France (period of interest: 18 July–21 August 2013).
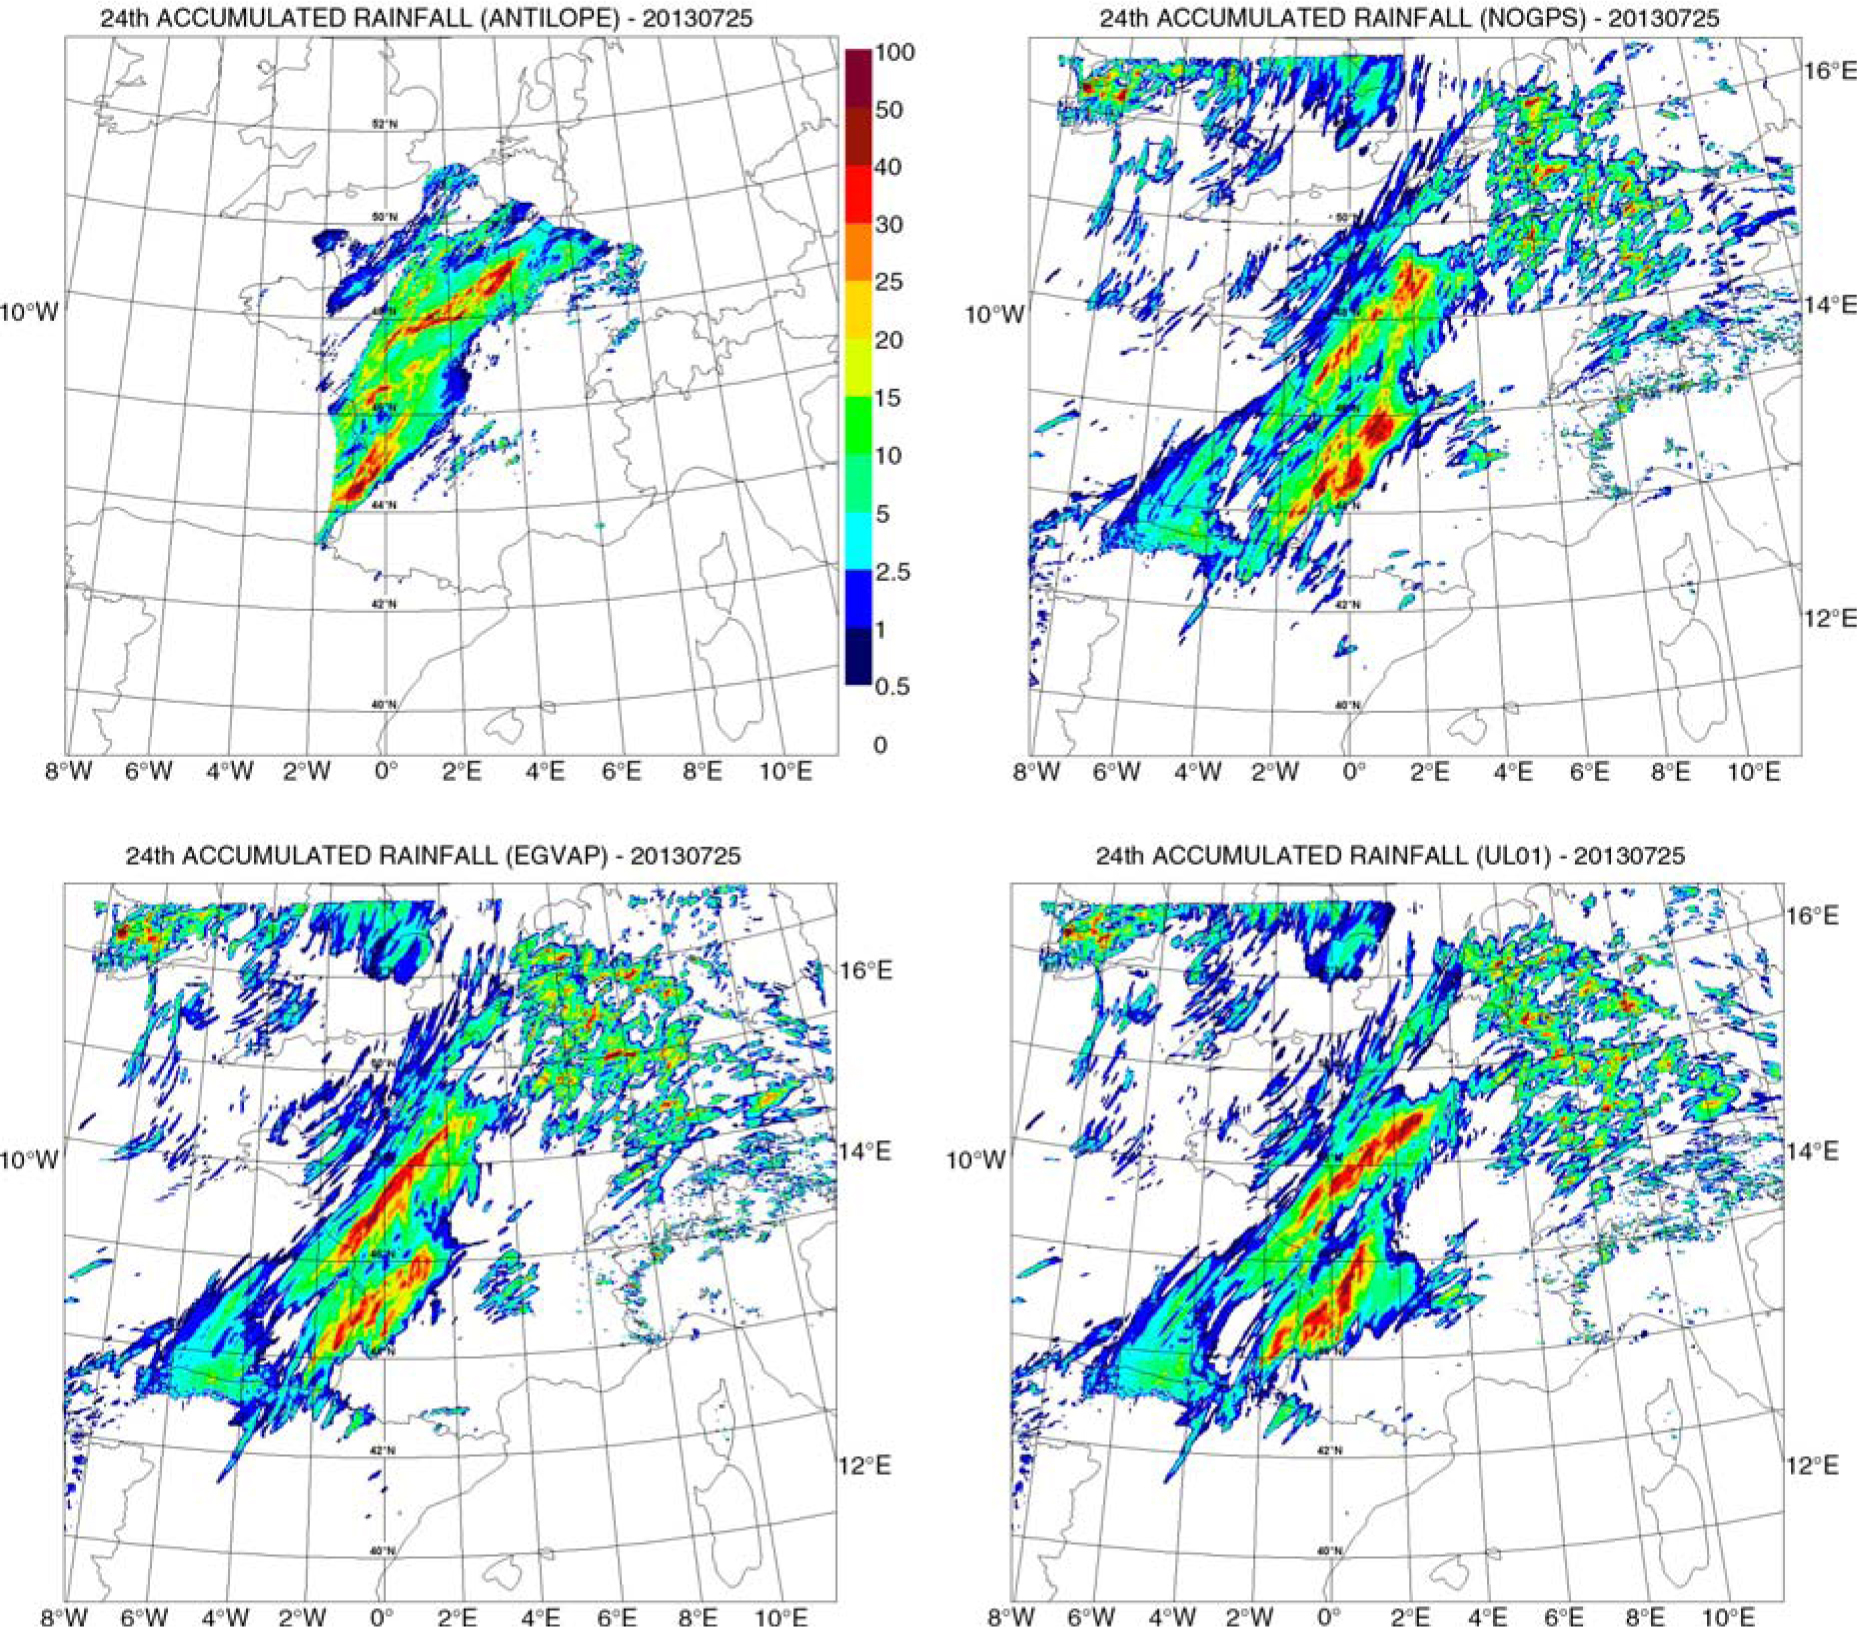
Fig. 12
Daily accumulated precipitation in mm as analysed by ANTILOPE and simulated by the AROME model starting from different atmospheric analyses on 25 July 2013: analysis (upper left), experiment NOGPS (upper right), experiment EGVAP (lower left), experiment UL01 (lower right).
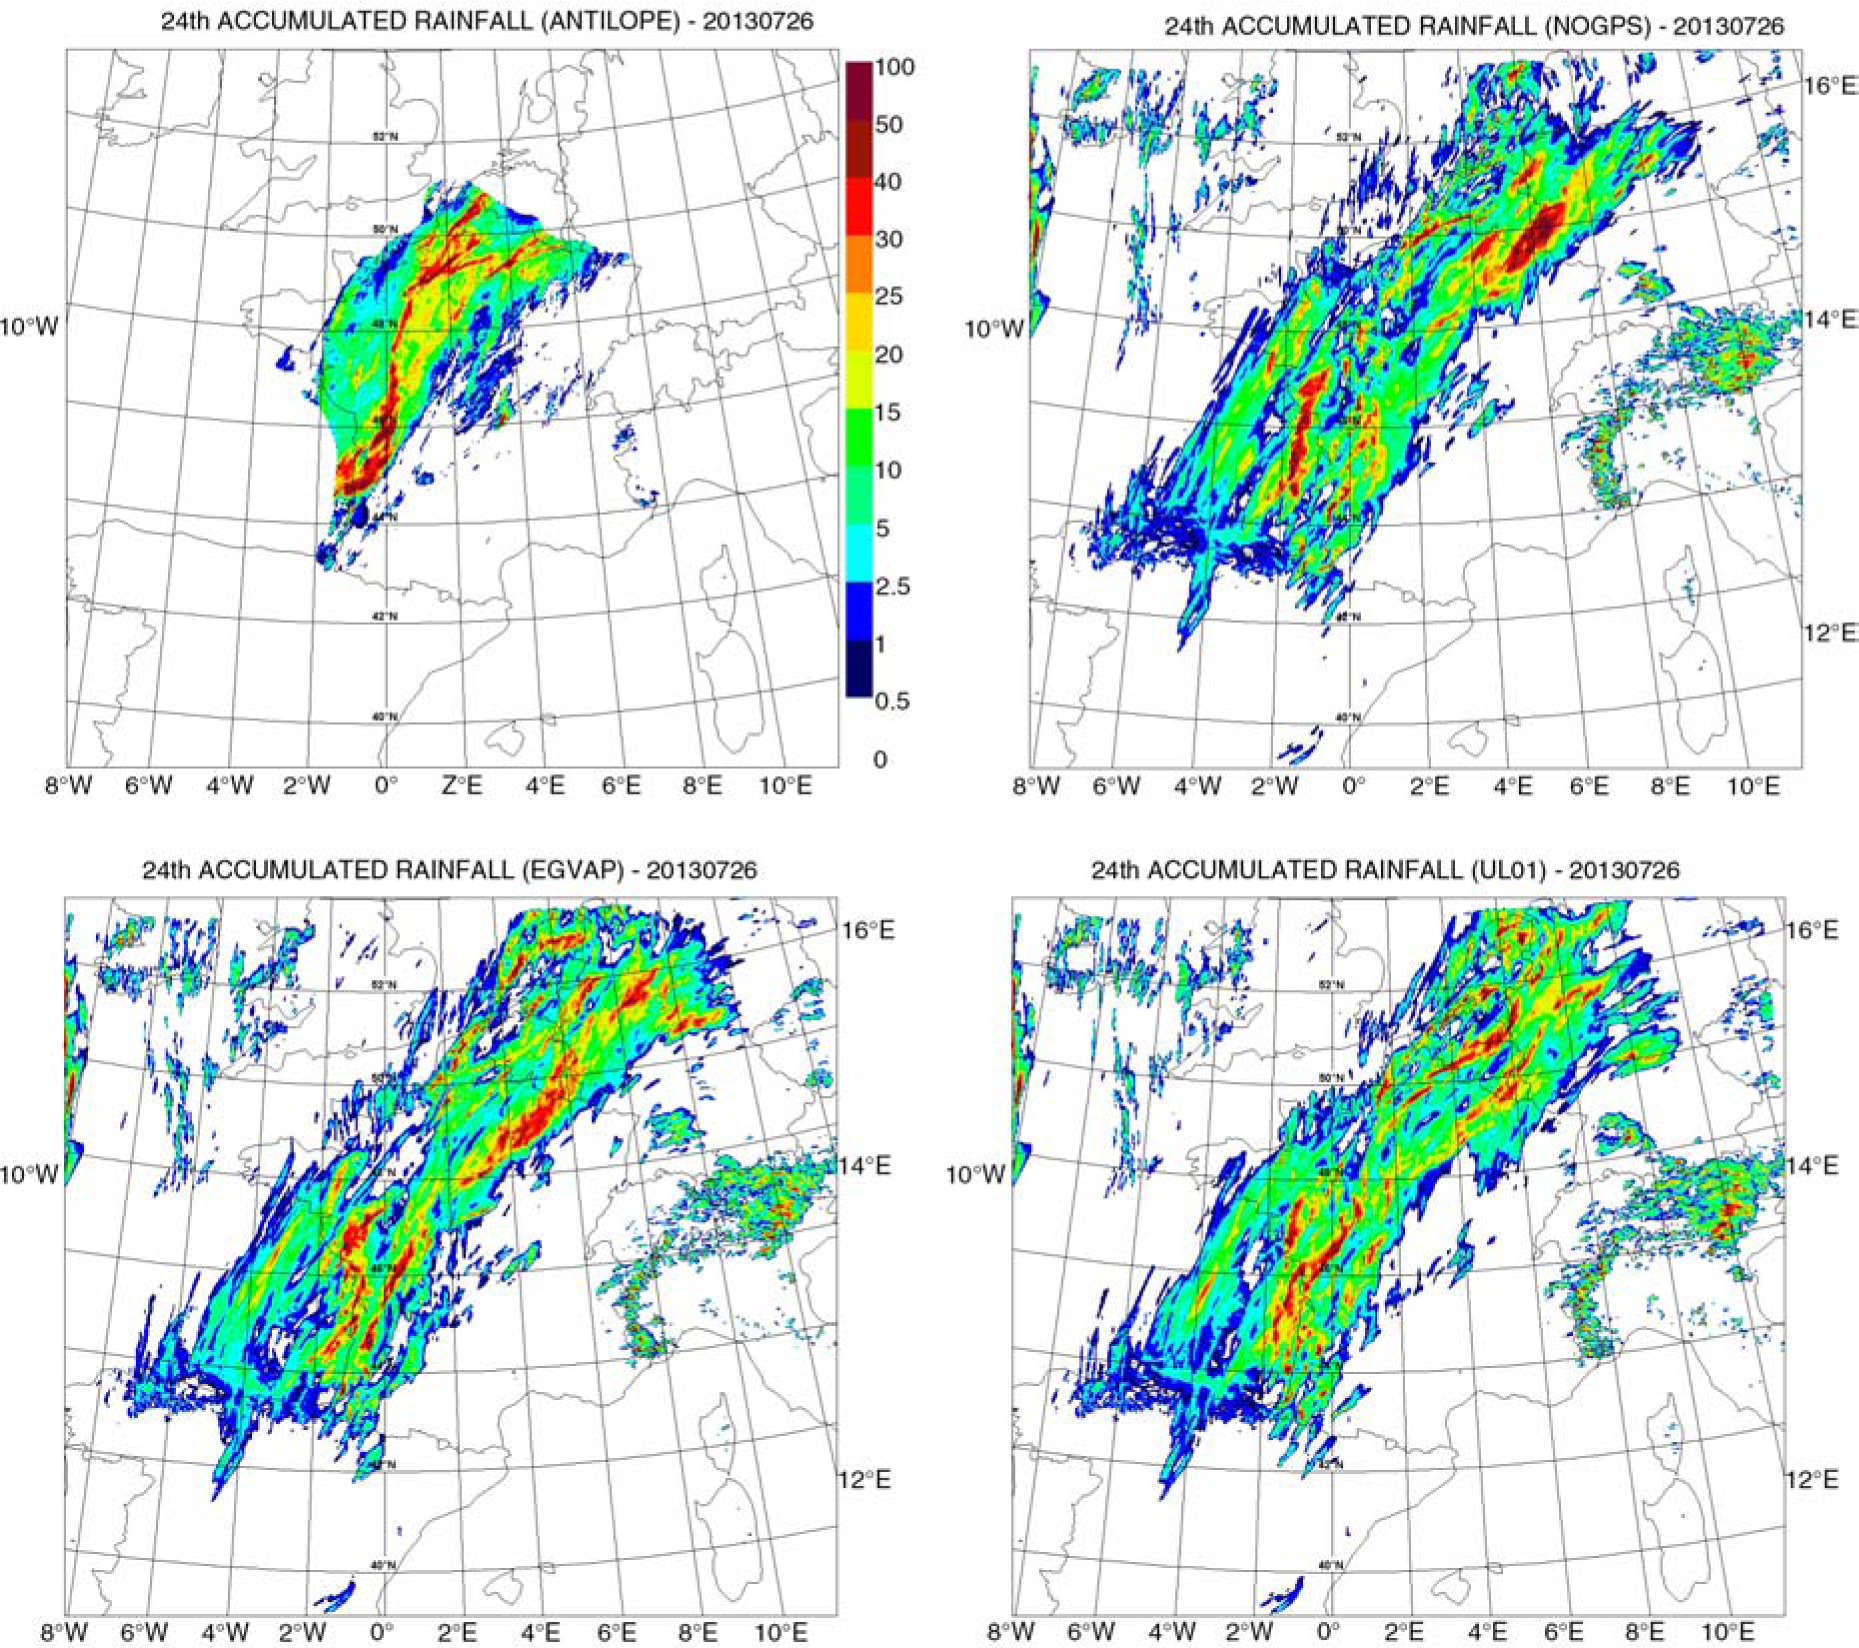
Fig. 13
Daily accumulated precipitation in mm as analysed by ANTILOPE and simulated by the AROME model starting from different atmospheric analyses on 26 July 2013: analysis (upper left), experiment NOGPS (upper right), experiment EGVAP (lower left), experiment UL01 (lower right).
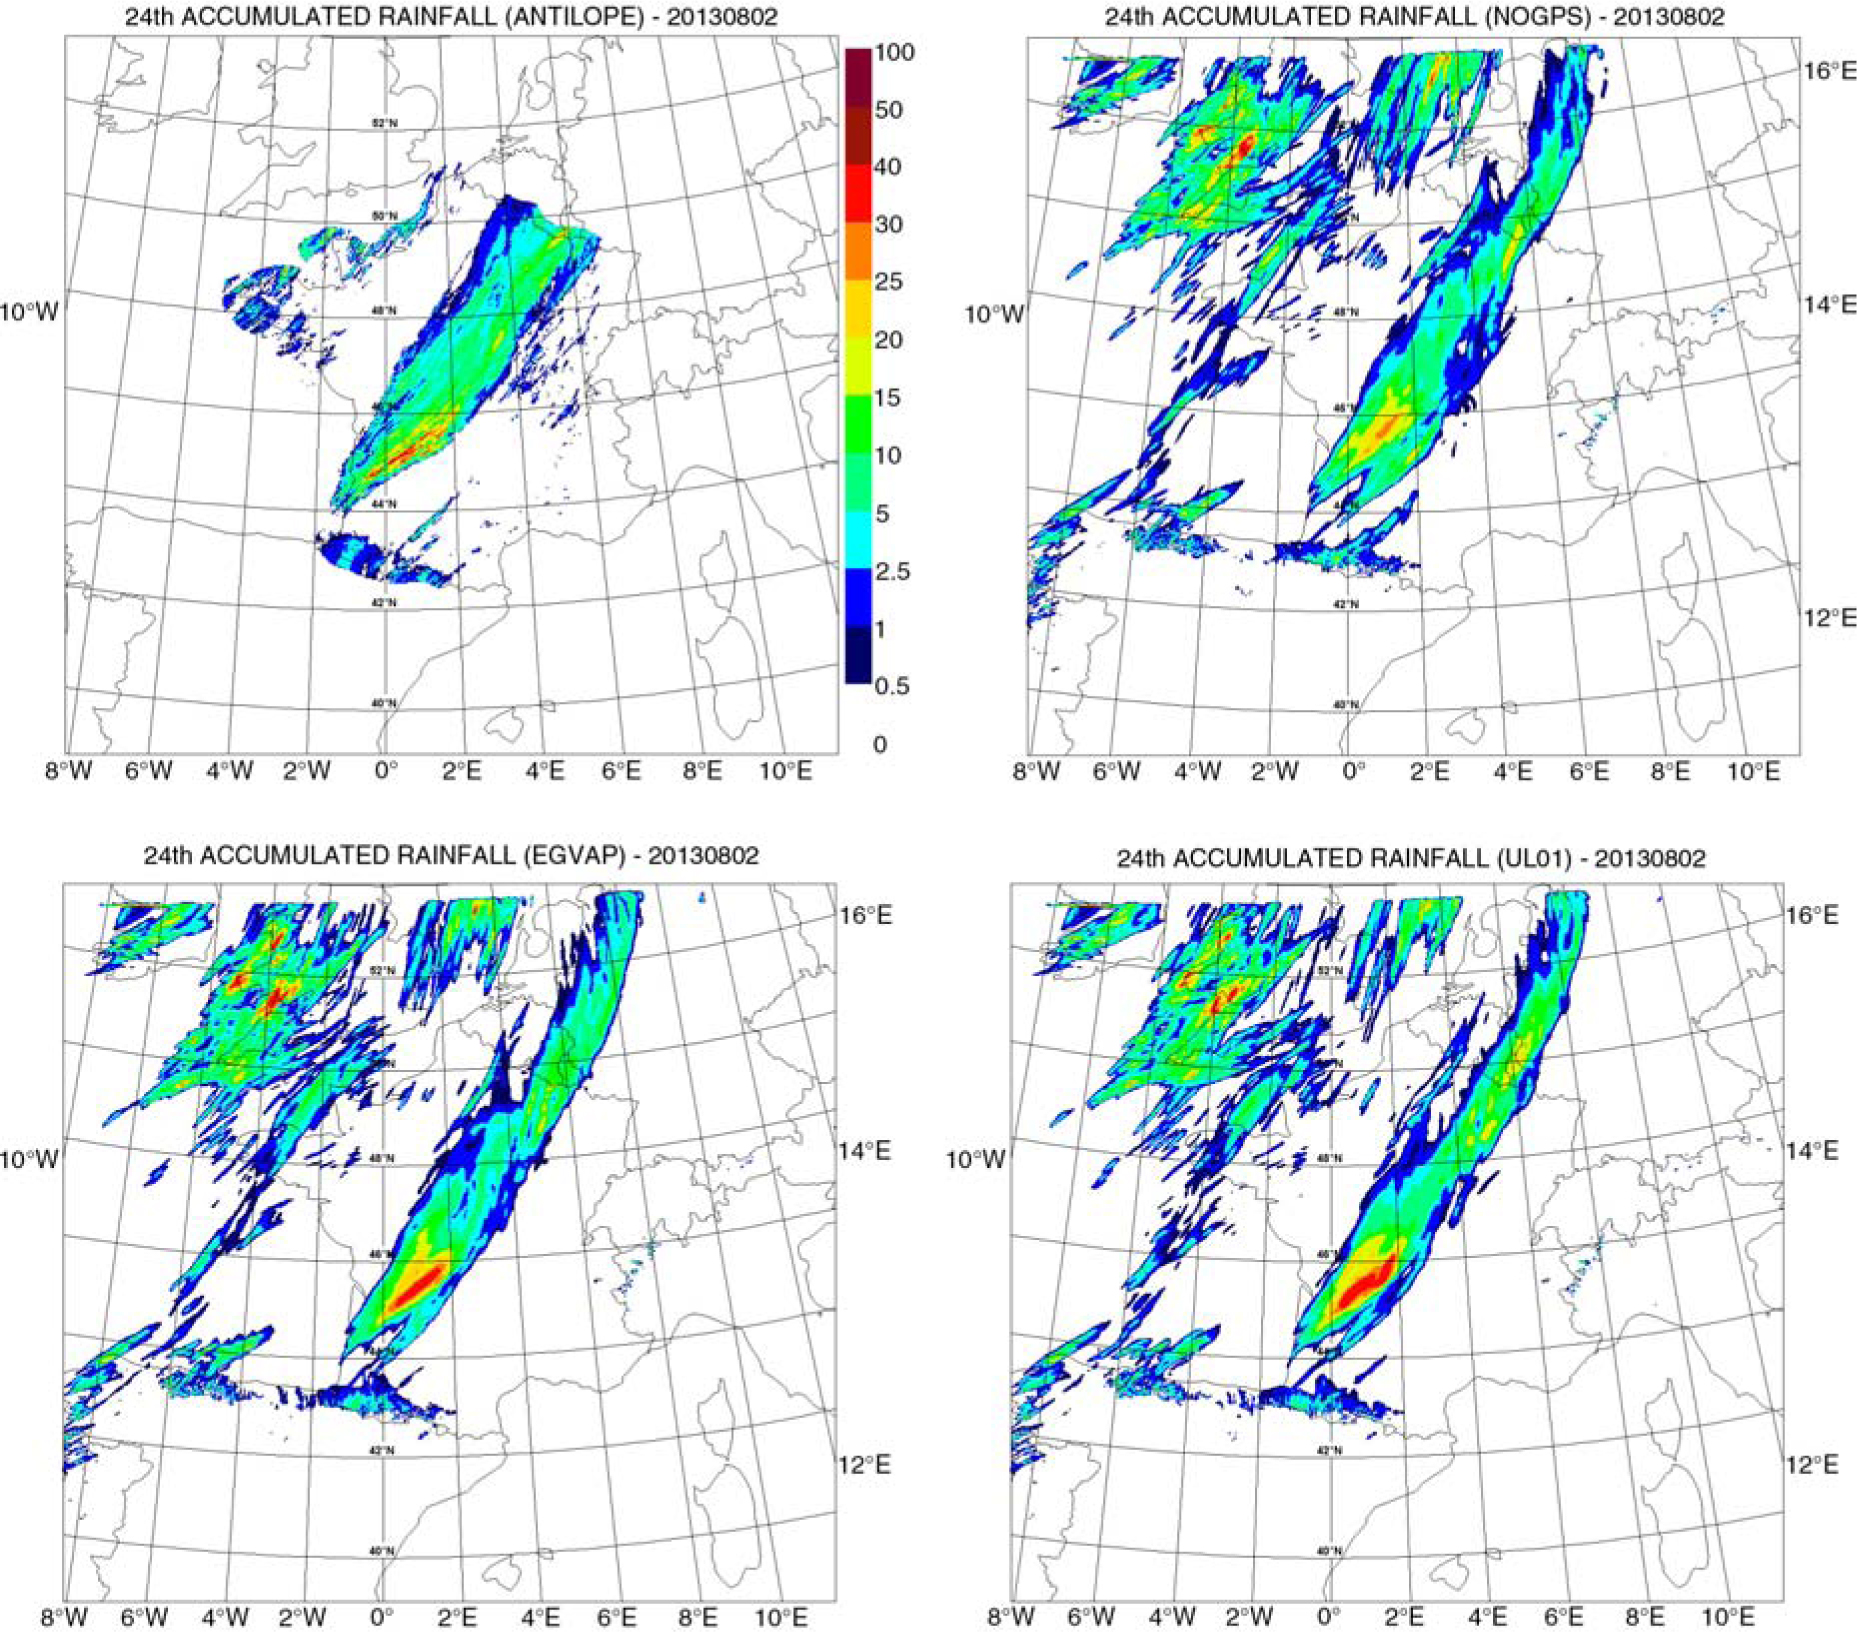
Fig. 14
Daily accumulated precipitation in mm as analysed by ANTILOPE and simulated by the AROME model starting from different atmospheric analyses on 2 August 2013: analysis (upper left), experiment NOGPS (upper right), experiment EGVAP (lower left), experiment UL01 (lower right).