
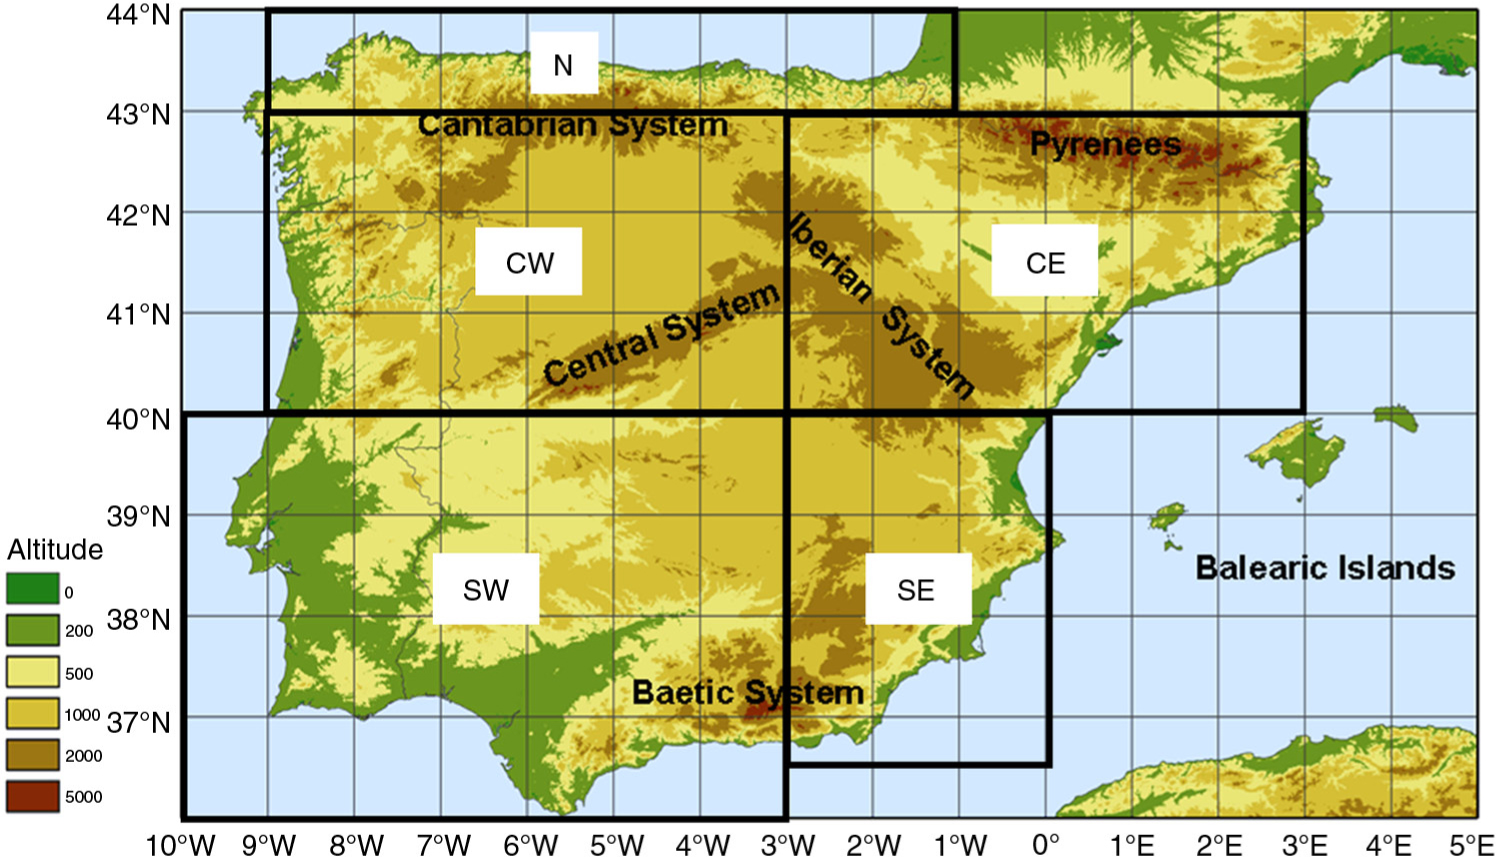
Fig. 1
Orographic map of the Iberian Peninsula (altitude in m), along with the main mountain ranges, and the subsectors for regional assessments (see also Table 1).
Table 1. List of the Iberian subsectors, also defined by their latitude and longitude ranges
N – Northern Iberia43.0–44.0°N1.0–9.0°WCW – Central-western Iberia40.0–43.0°N3.0–9.0°WSW – South-western Iberia36.0–40.0°N3.0–10.0°WCE – Central-eastern Iberia40.0–43.0°N3.0°W–3.0°ESE – South-eastern Iberia36.0–40.0°N3.0°W–0.0°
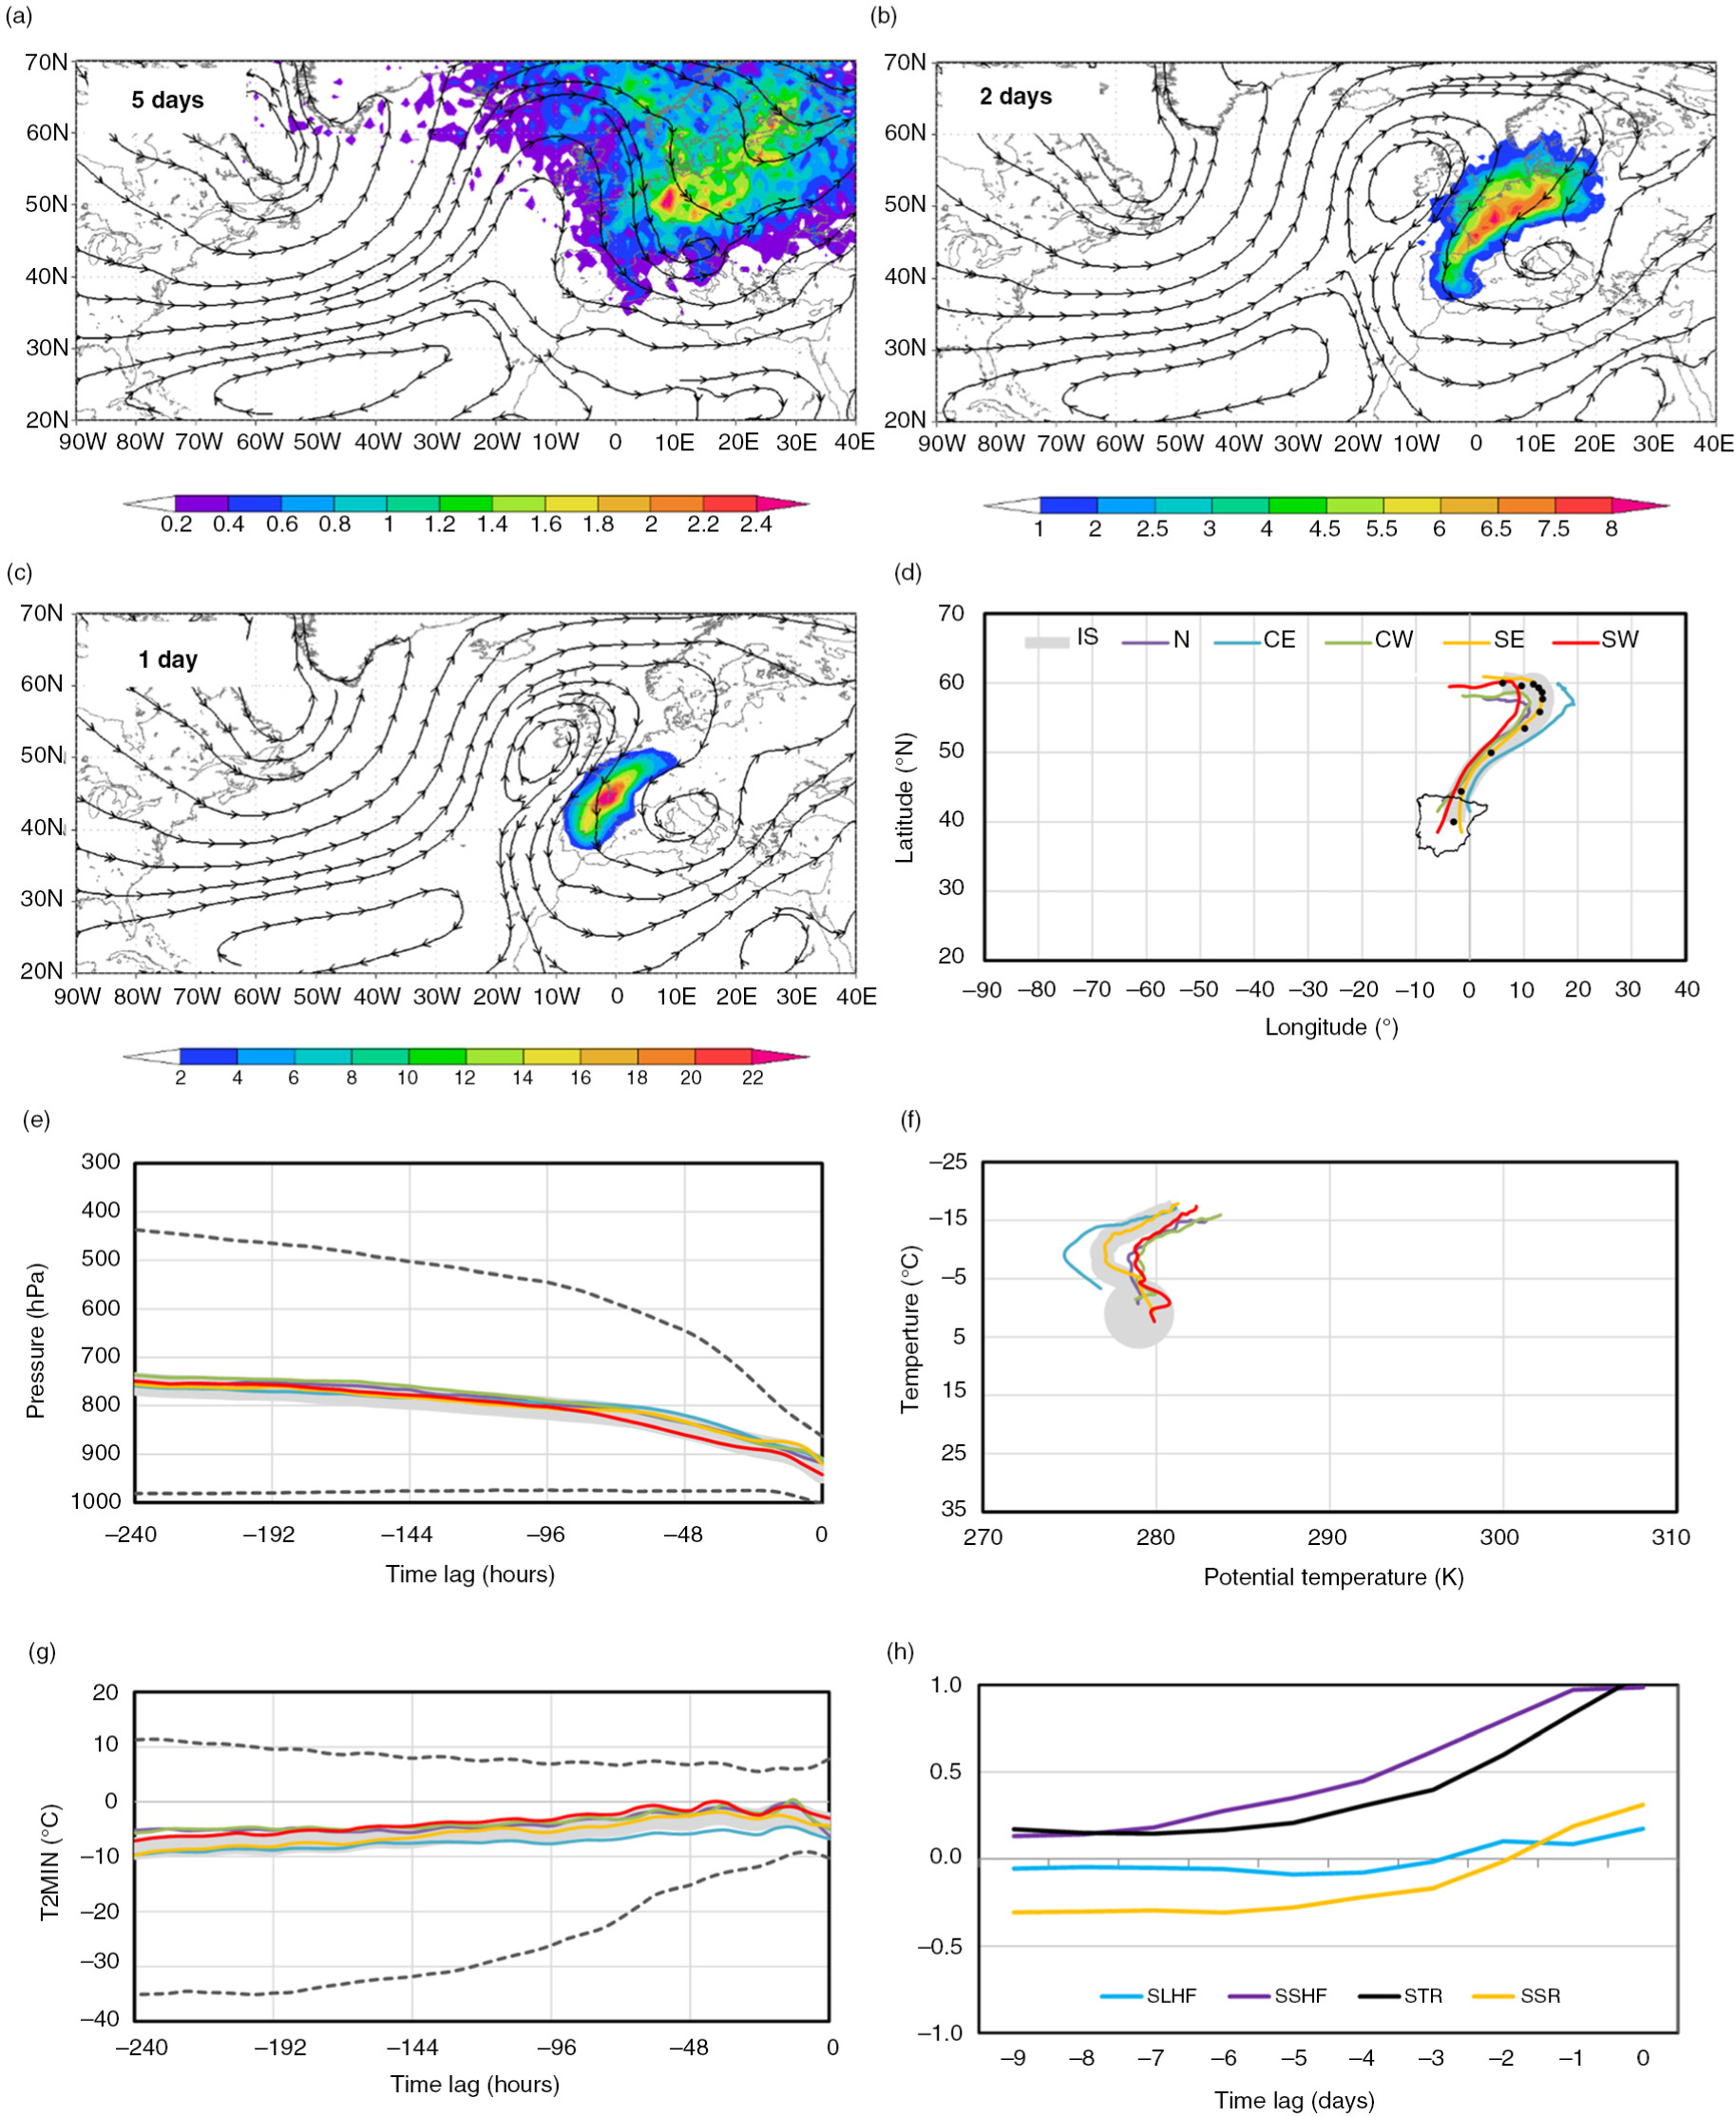
Fig. 2
Wintertime (DJF) extremely cold episodes, WCE, for the period of 1979–2012 (34 yr). (a–c): Trajectory density patterns (in number of trajectories per 1000 km2, note the different scales), along with the respective composites of 850 hPa streamlines, for the indicated time lags (5, 2 and 1 d before the episode onset). (d–g): Median evolution of the outlined variables along the trajectories for the whole IS (Iberian sector, thick grey line) and for each subsector separately (cf. Fig. 1 and Table 1). The corresponding 5th/95th percentiles for the IS are also displayed in the chronograms (dashed lines in e and g). Black circles in (d) indicate days (from 10 days before onset to onset), while the grey circle in (f) indicates the trajectory at the episode onset. (h): Medians of SLHF, SSHF, STR and SSR anomalies (dimensionless) along the air parcel trajectories (positive SLHF, SSHF and STR directed from surface to atmosphere, positive SSR directed towards the surface).
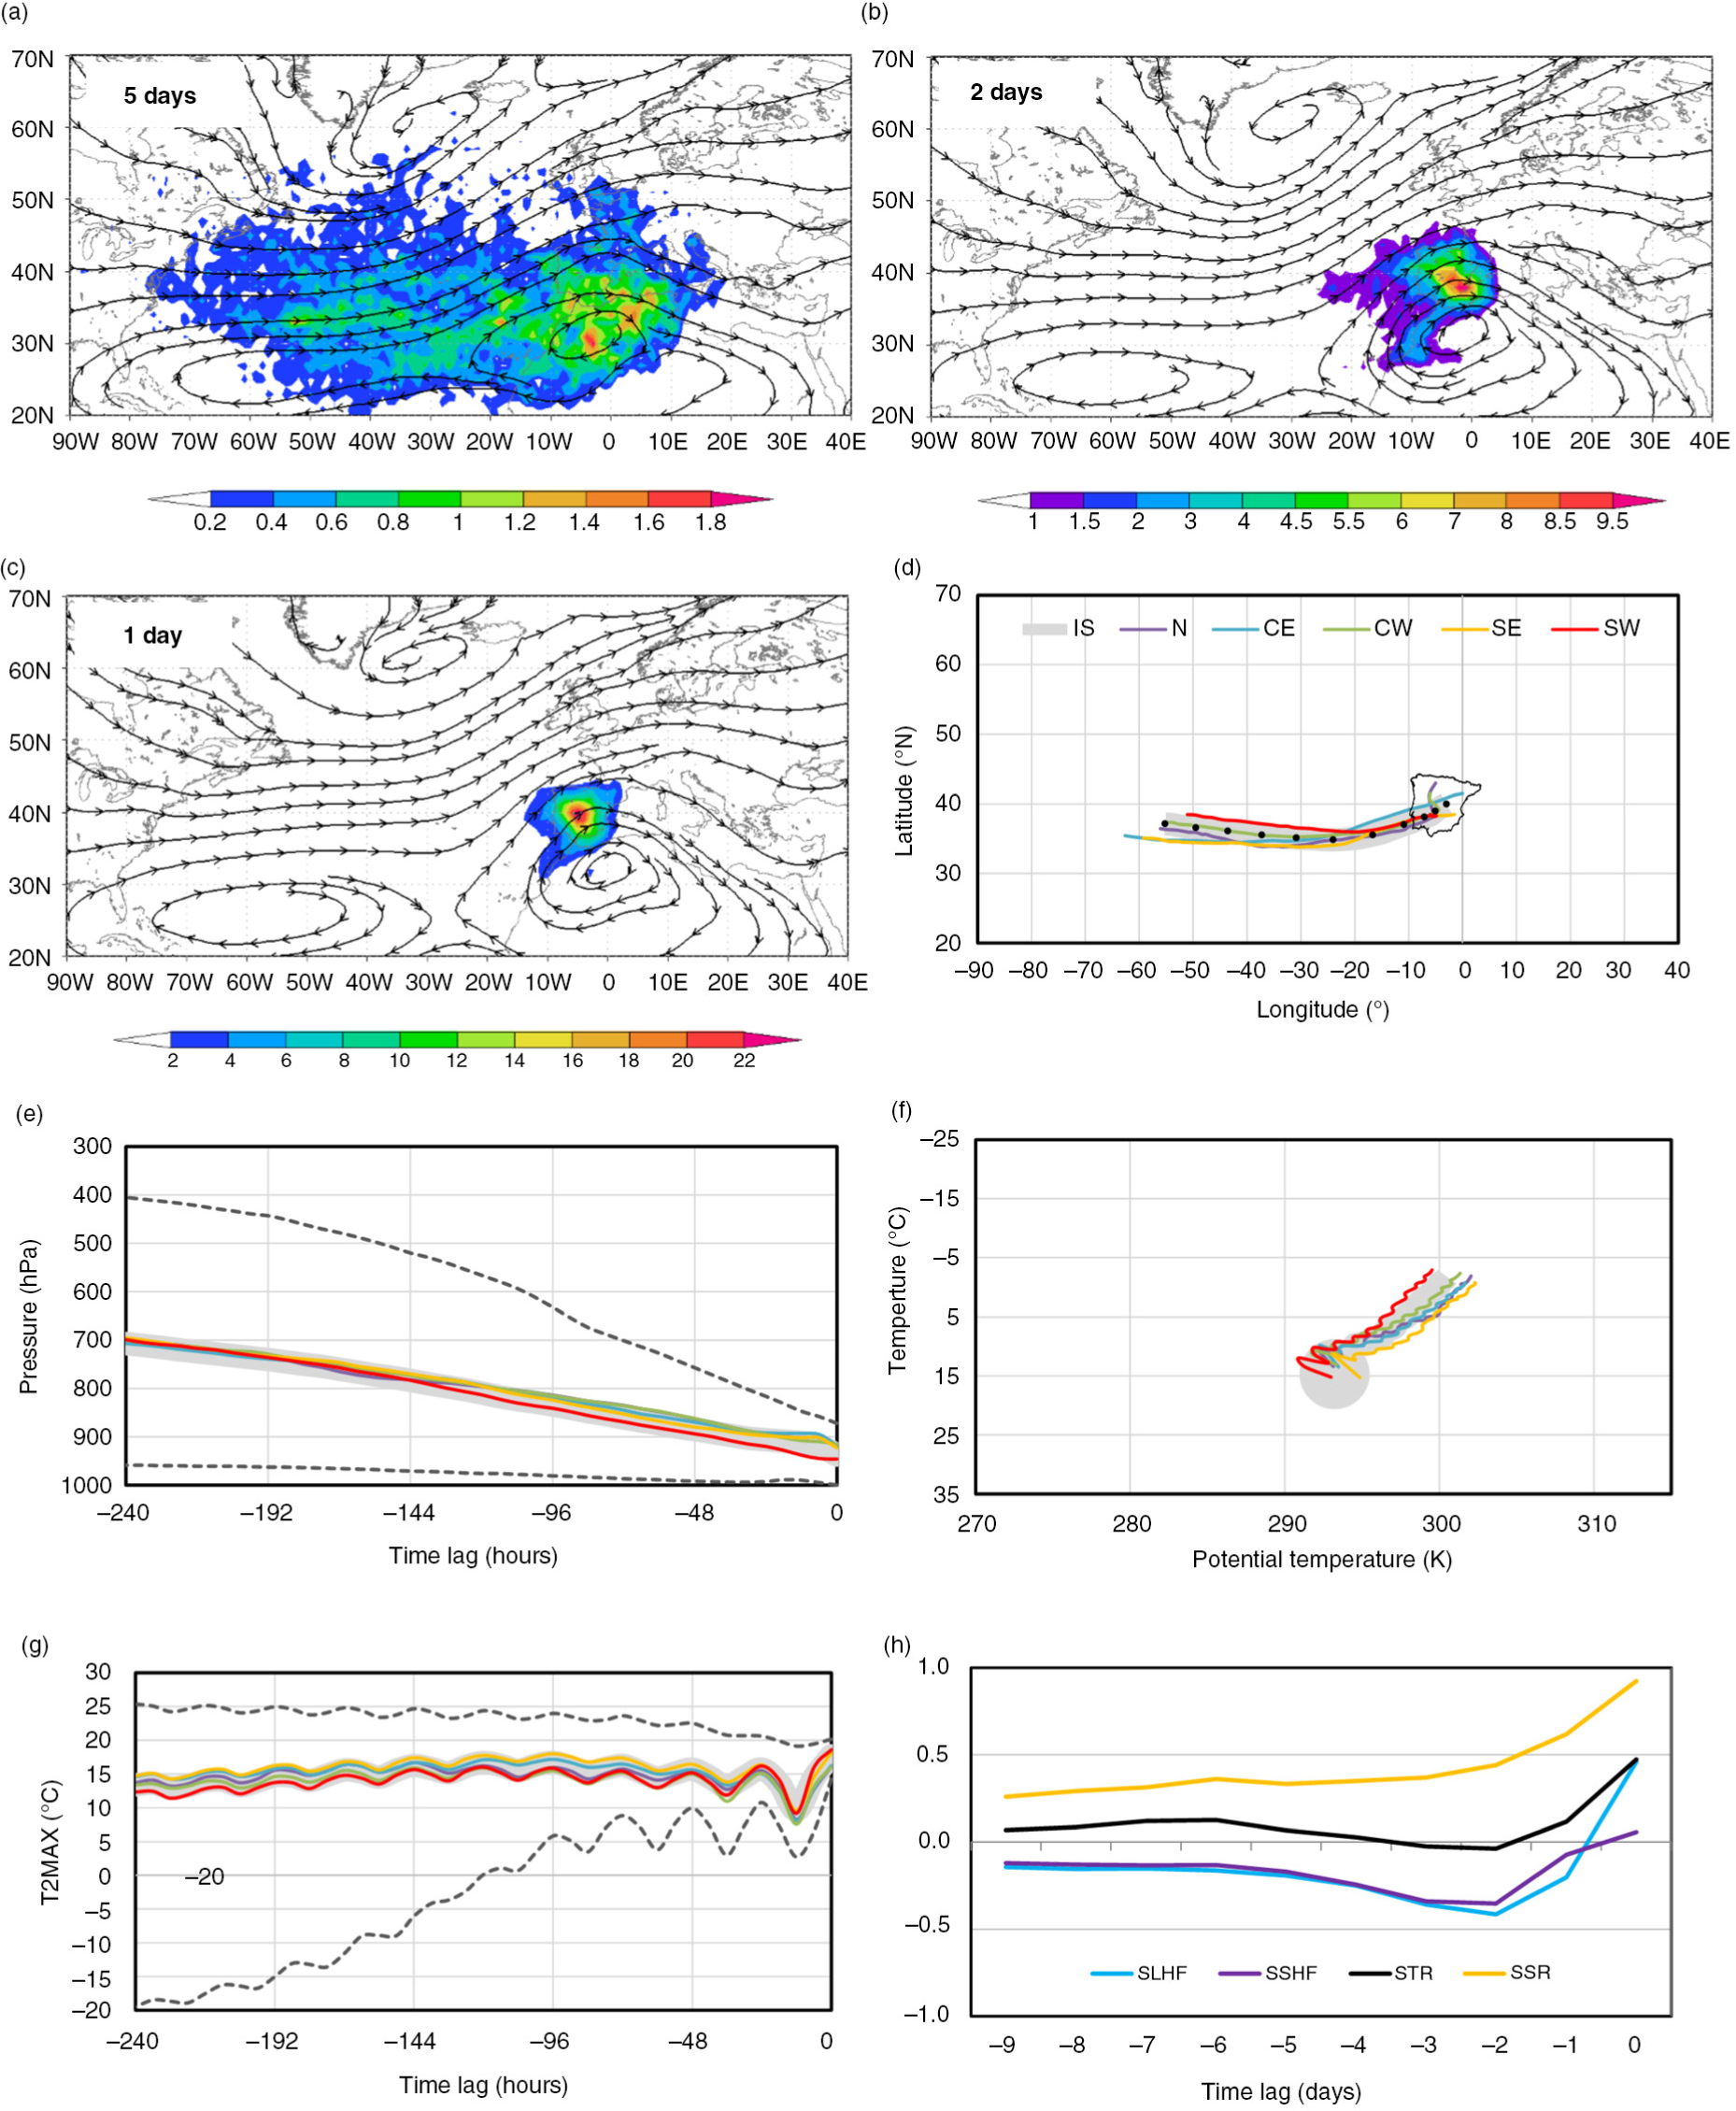
Fig. 3
As in Fig. 2, but for wintertime (DJF) extremely warm episodes, WWE.
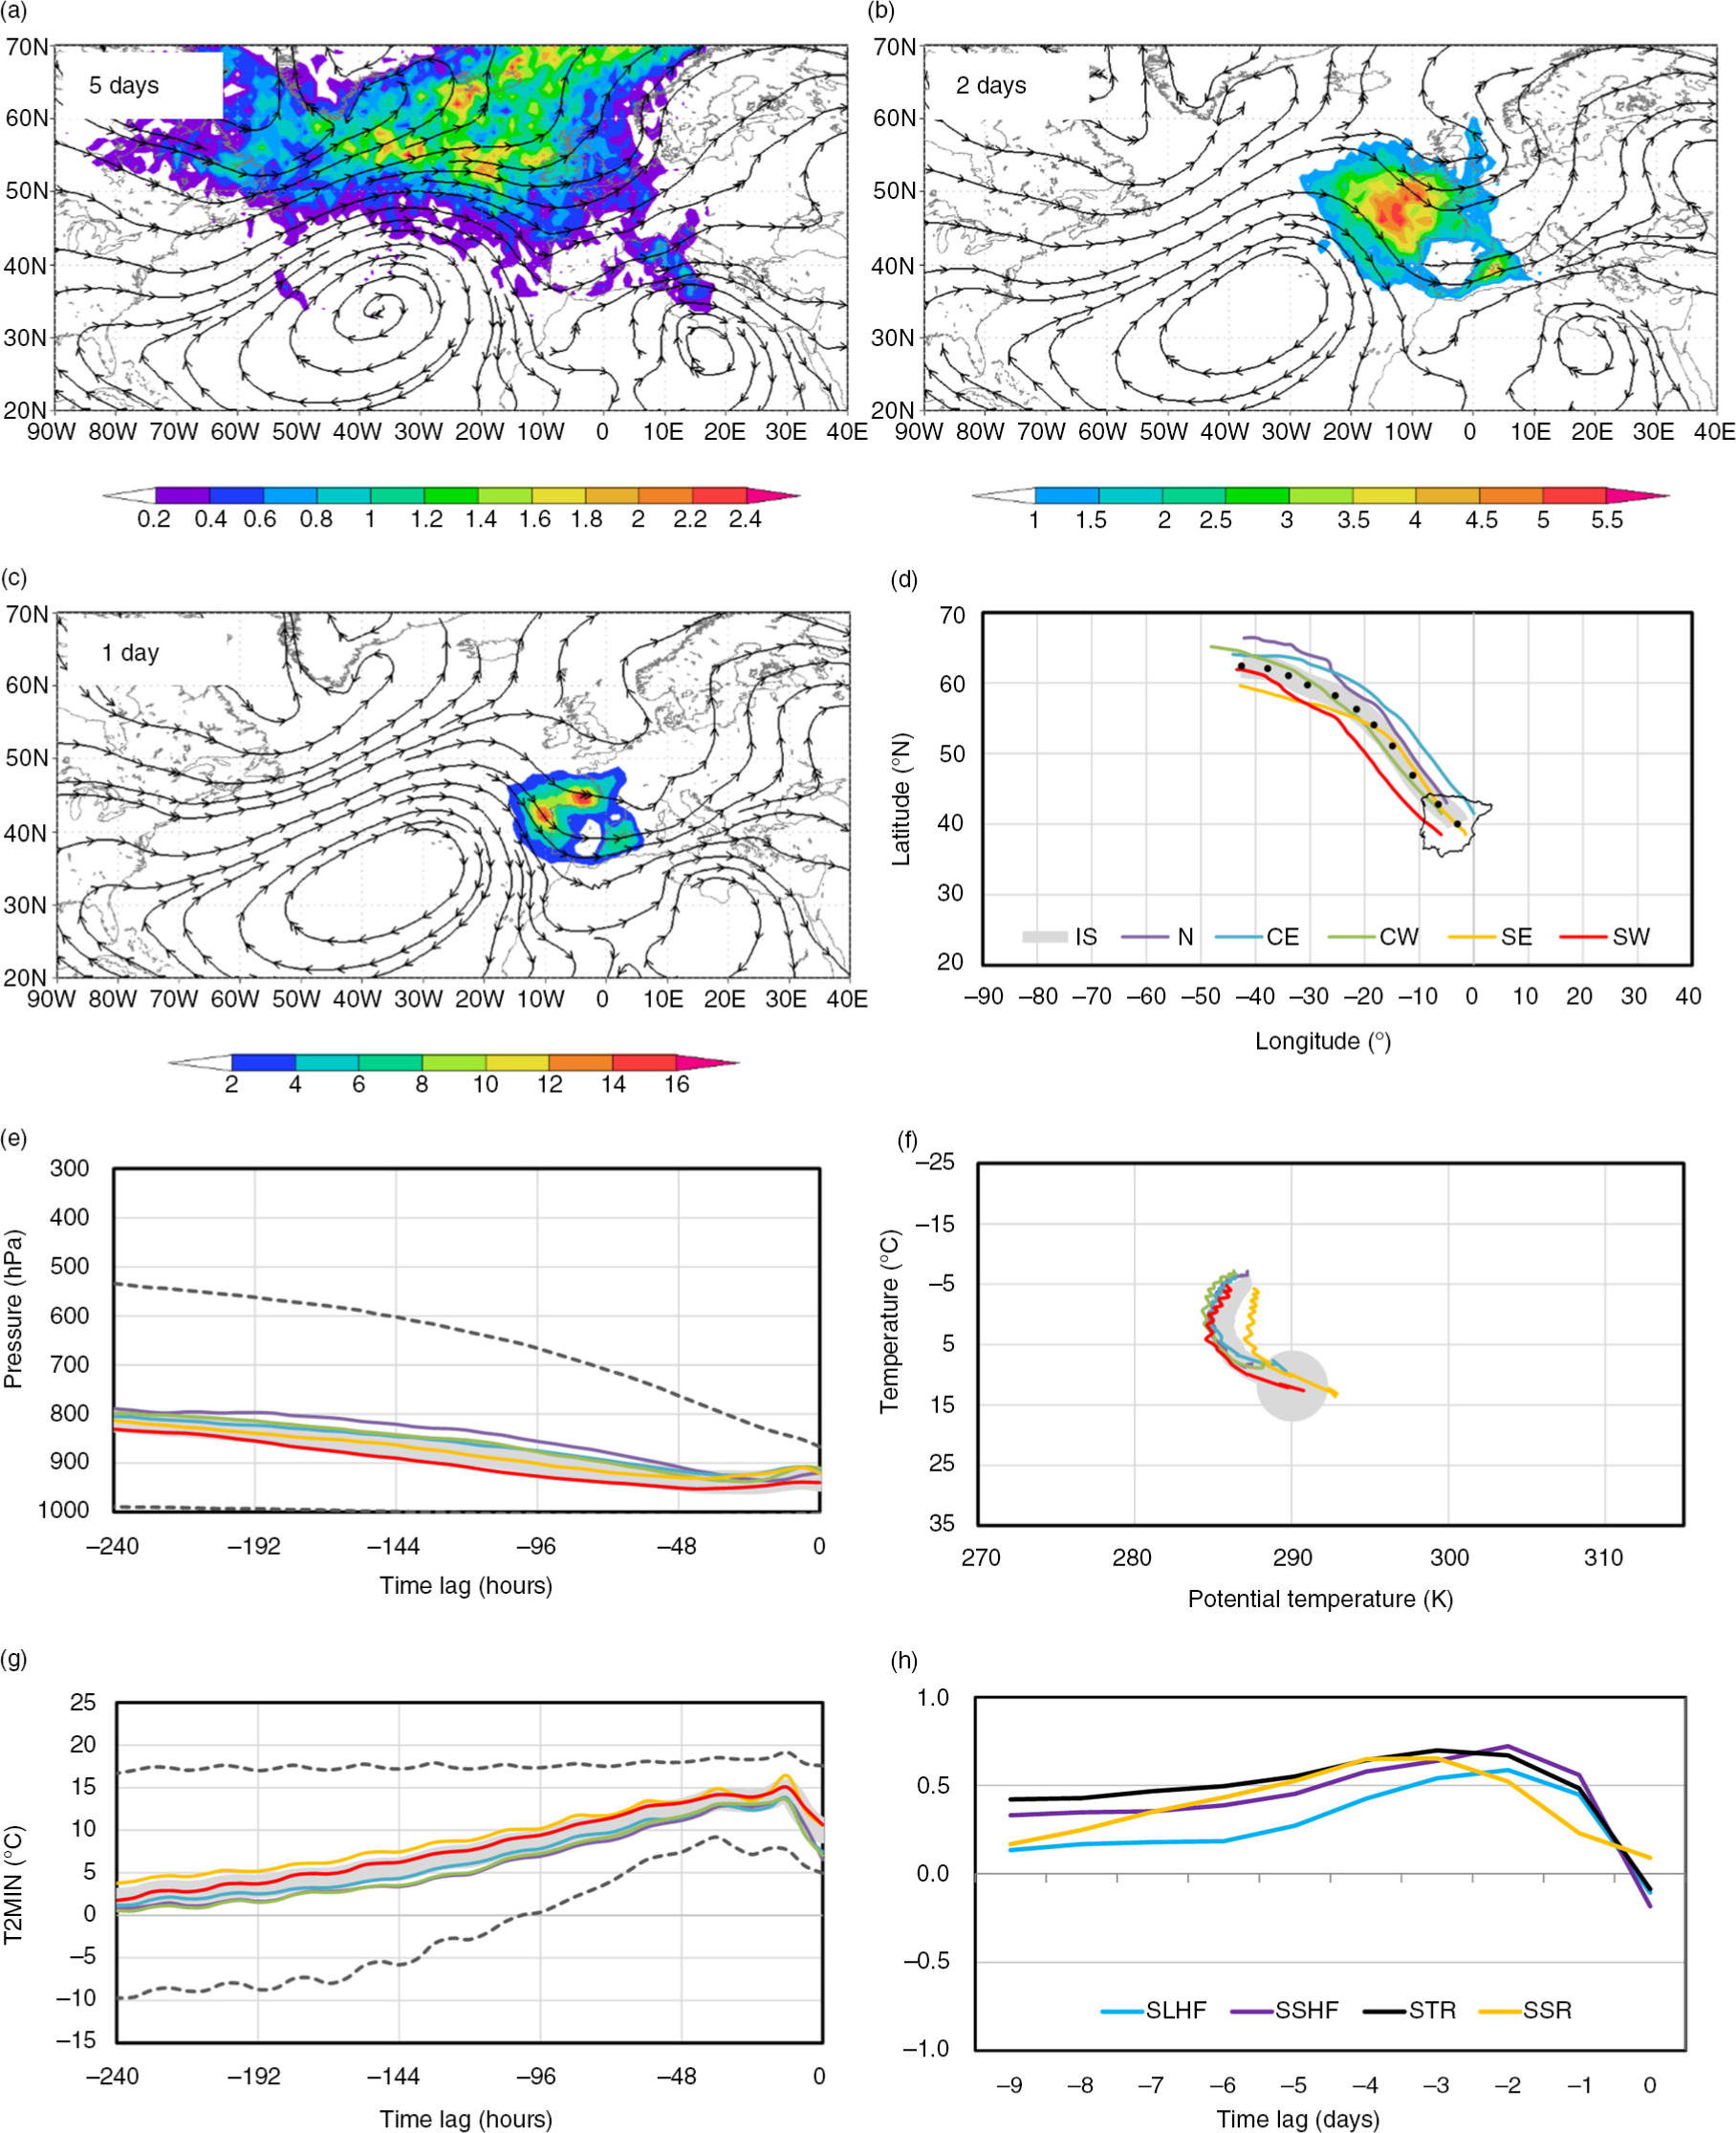
Fig. 4
As in Fig. 2, but for summertime (JJA) extremely cold episodes, SCE.
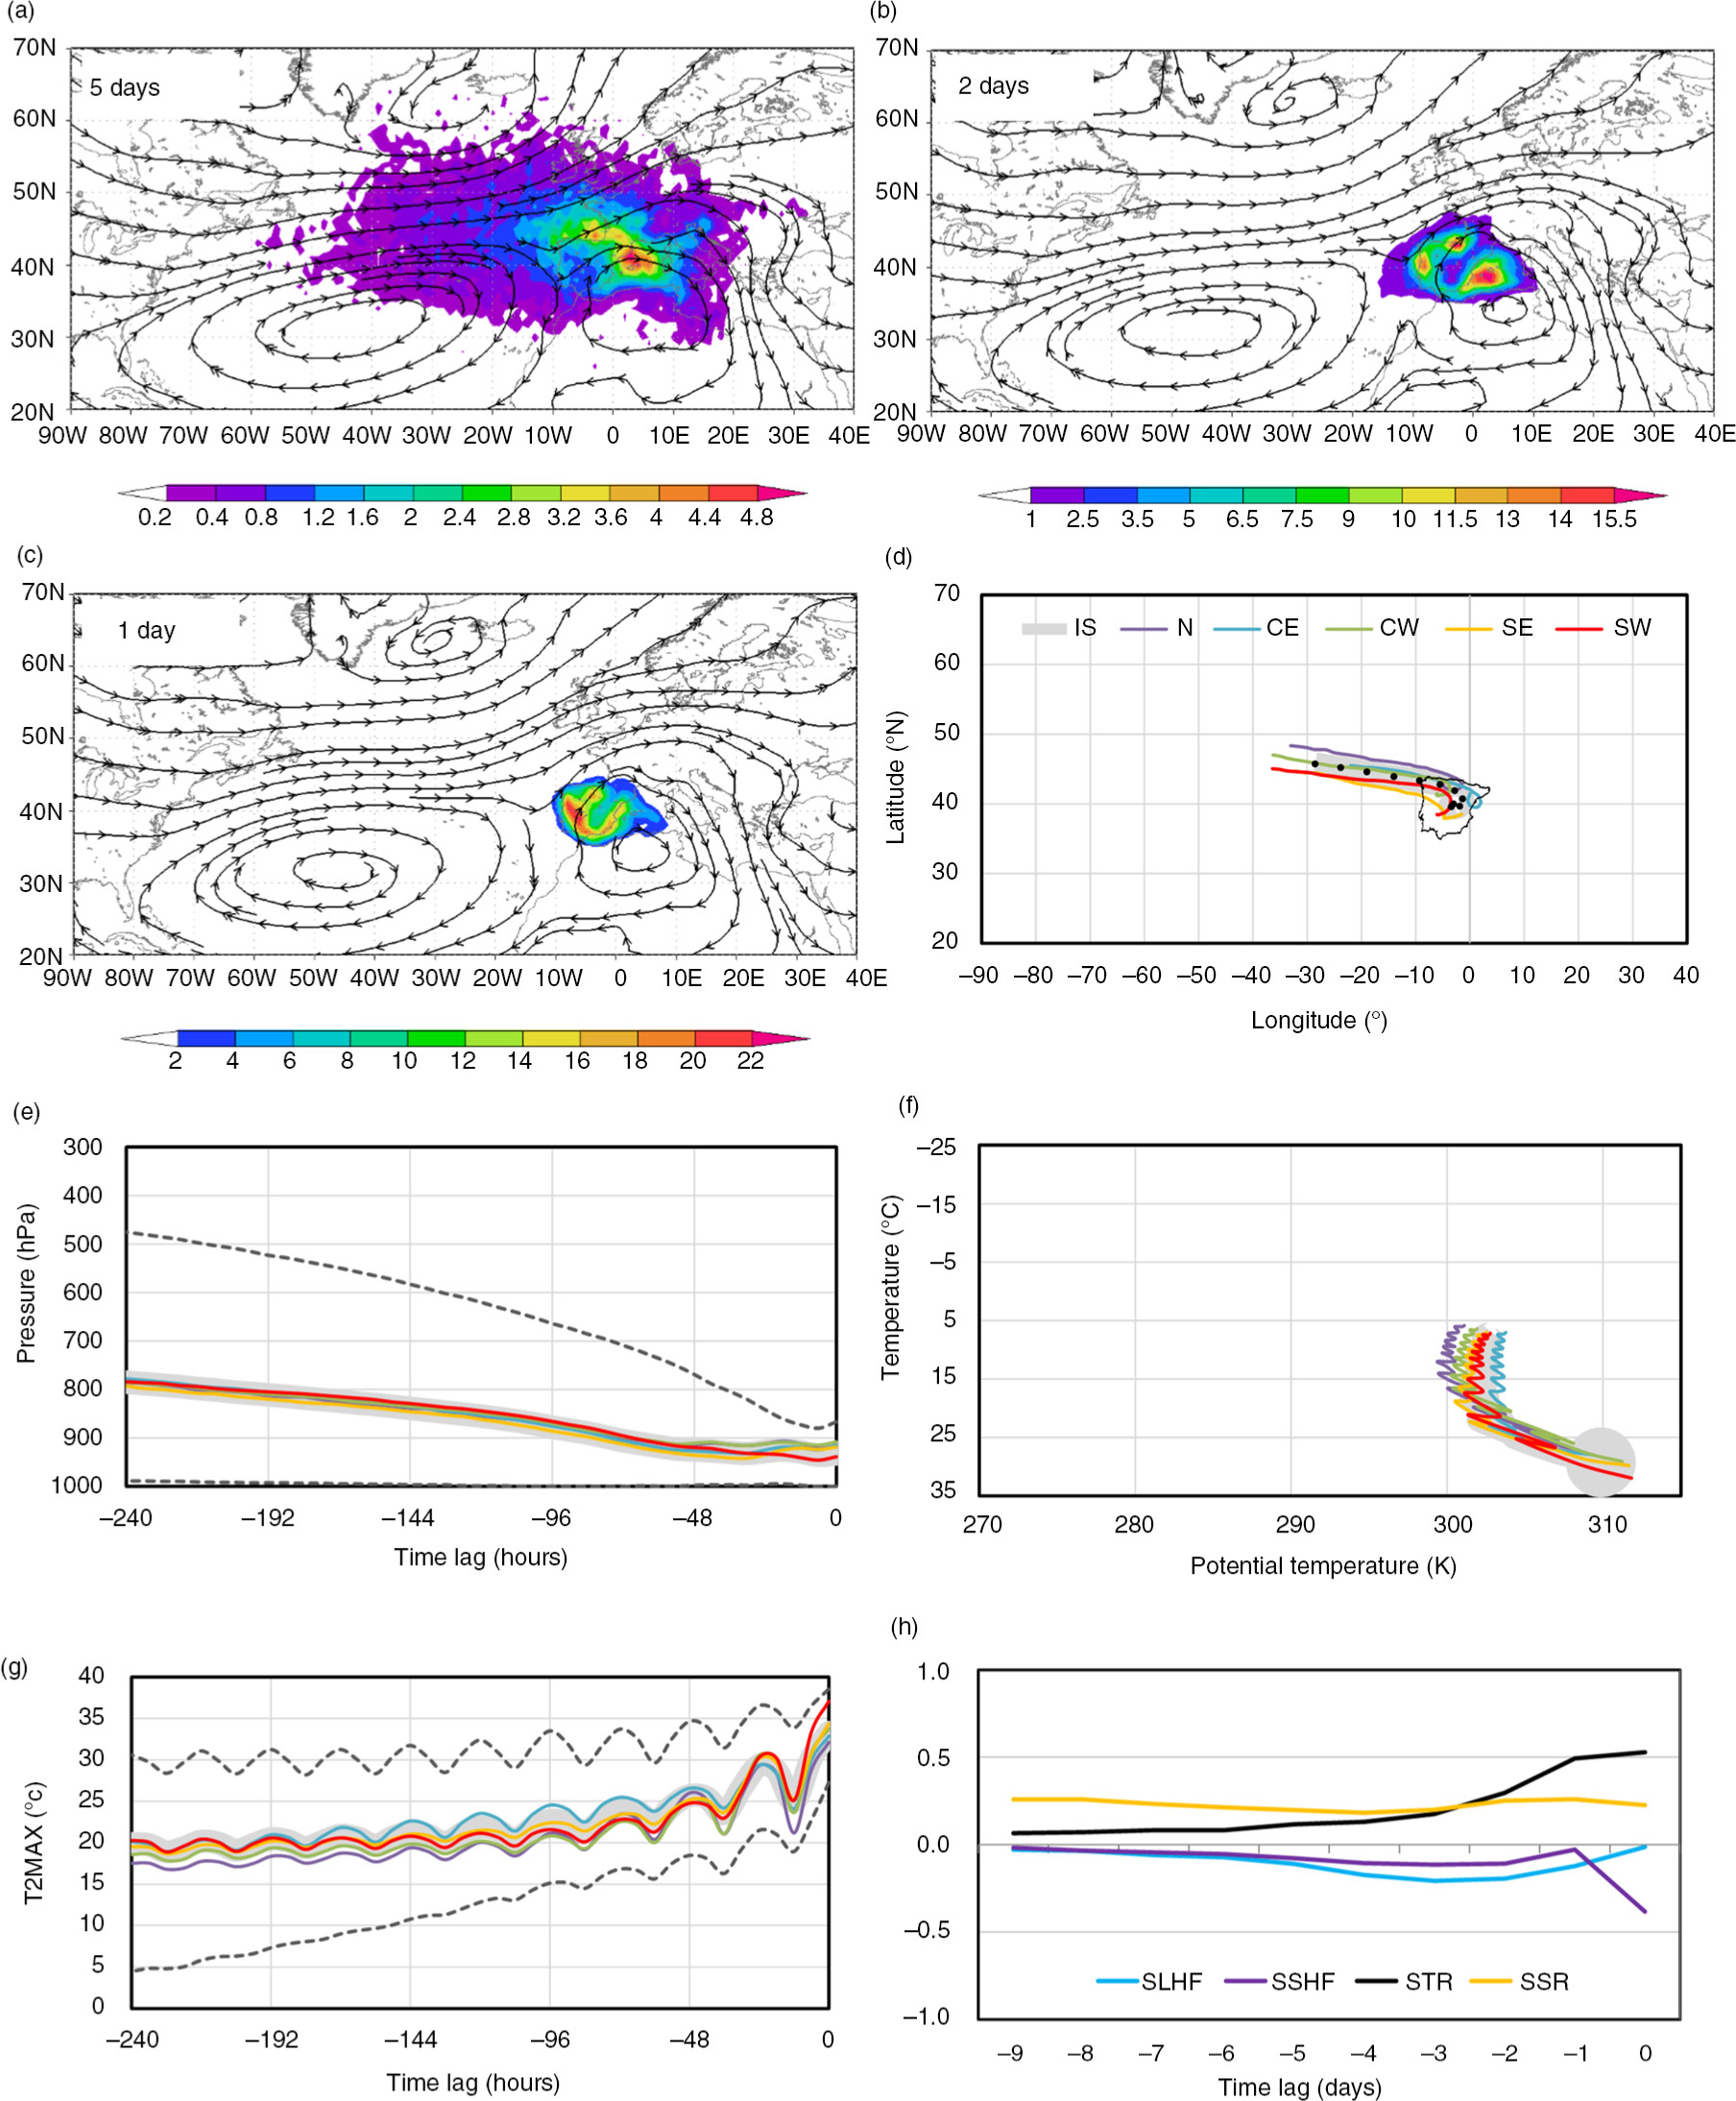
Fig. 5
As in Fig. 2, but for summertime (JJA) extremely warm episodes, SWE.
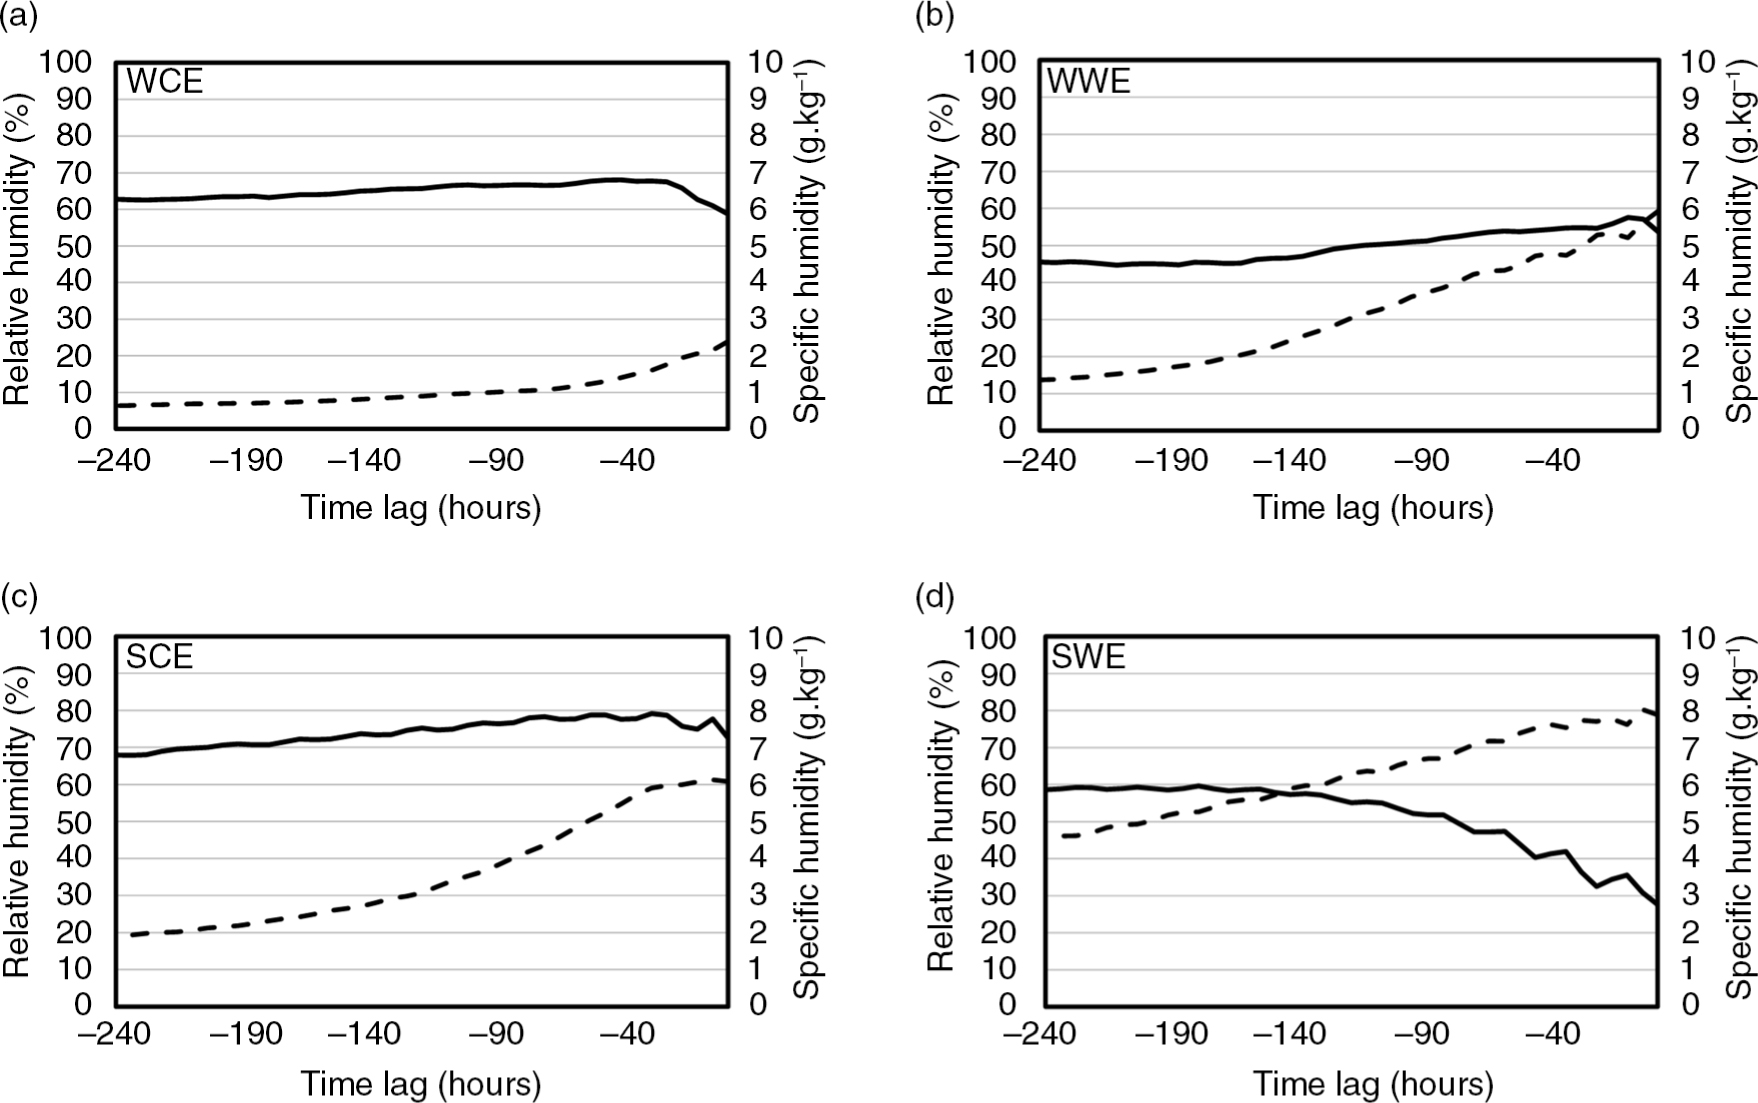
Fig. 6
Time series of the median of relative humidity (solid line) and specific humidity (dashed line) along the 10-d trajectories for each extreme episode: WCE, WWE, SCE and SWE for the entire Iberian sector.
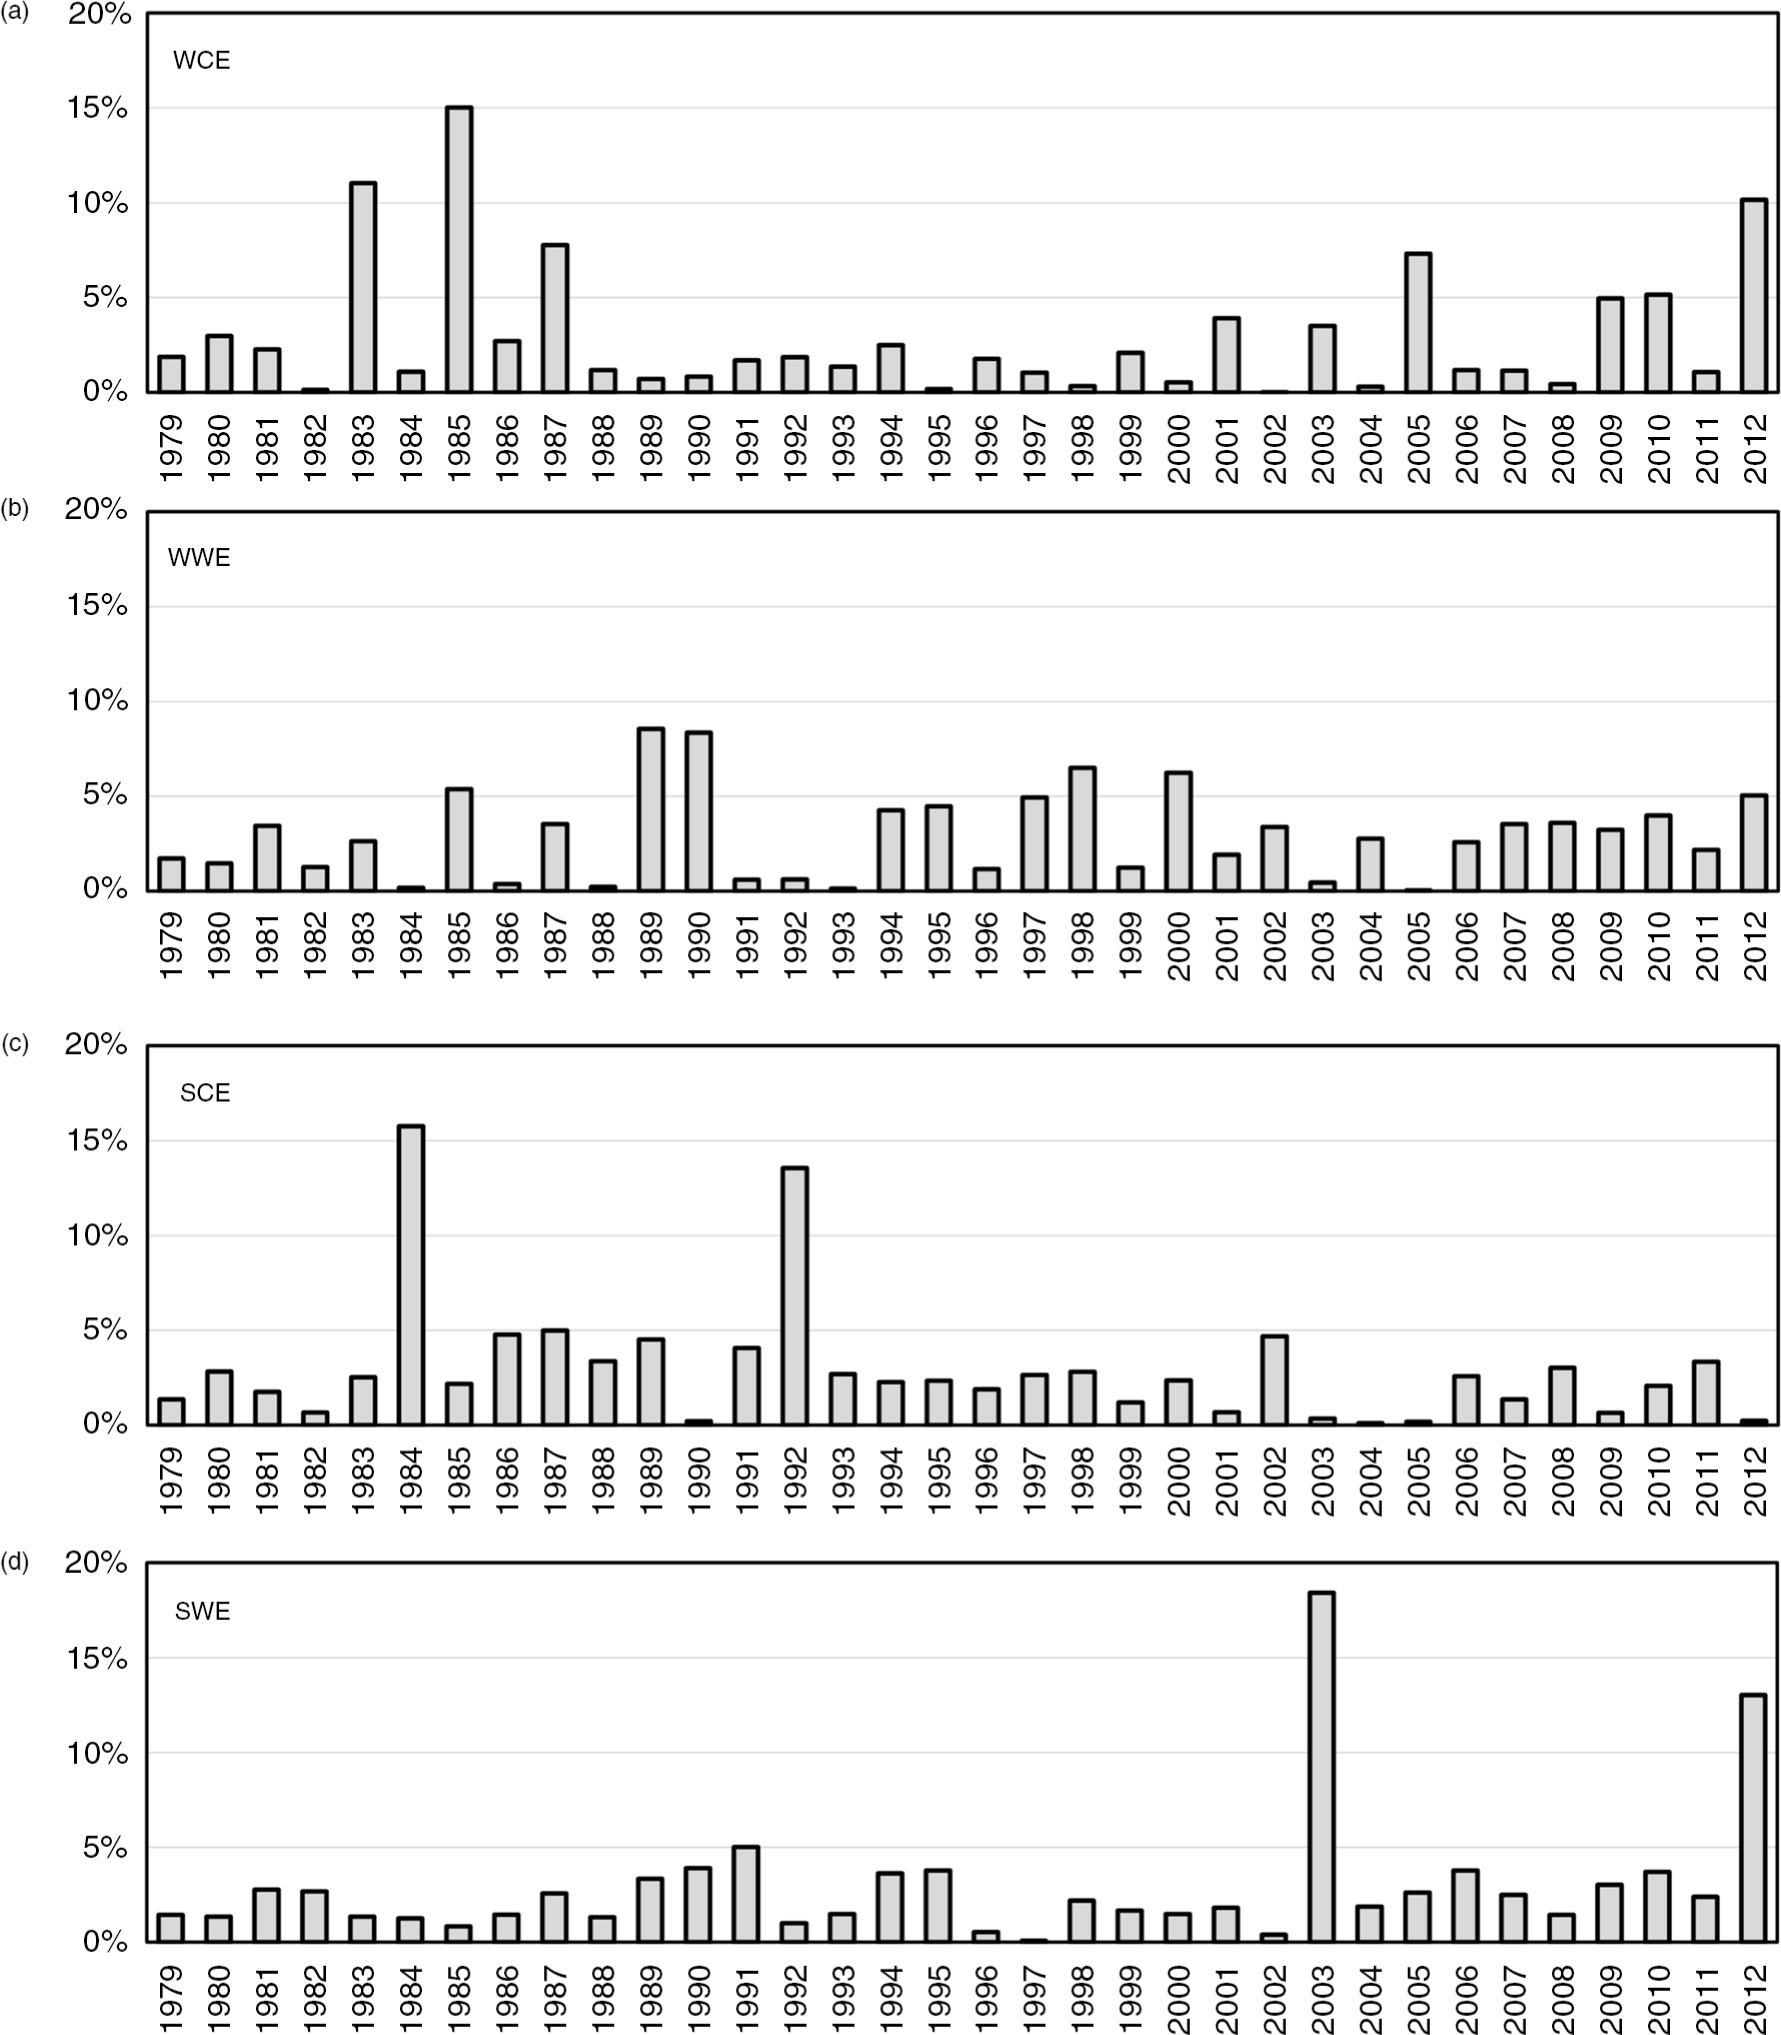
Fig. 7
Relative annual frequencies of occurrence (in%) of temperature extremes in the entire Iberian sector for: (a) WCE, (b) WWE, (c) SCE and (d) SWE.