
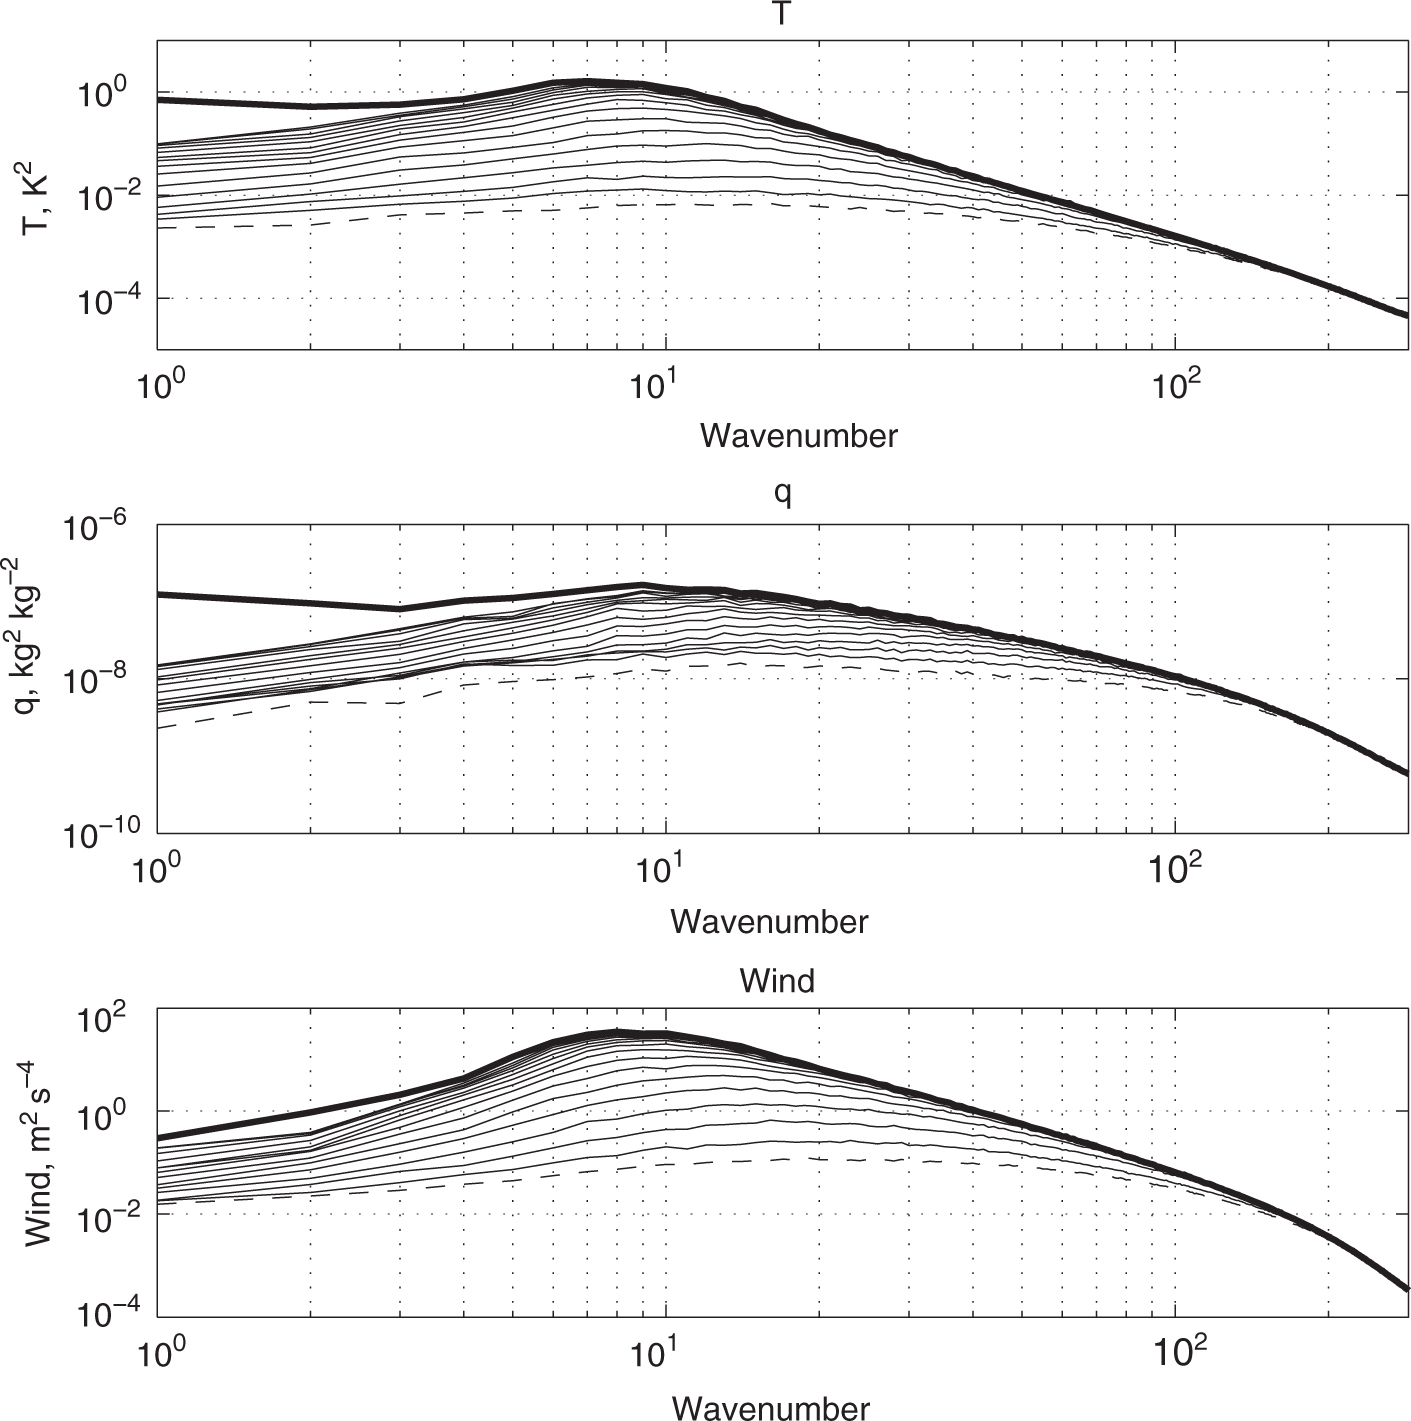
Fig. 1
Spectra of error variance of Control case, verified against NR over the July–August period. Each thin curve represents one forecast time at 24-hour intervals from the analysis to the 336-hour forecast; thin dashed curve indicates analysis error variance. Heavy curve indicates estimated saturated error variance. Top, 506 hPa temperature, K2; centre, 857 hPa specific humidity, kg2kg−2; bottom, 356 hPa rotational wind, m2s−2.
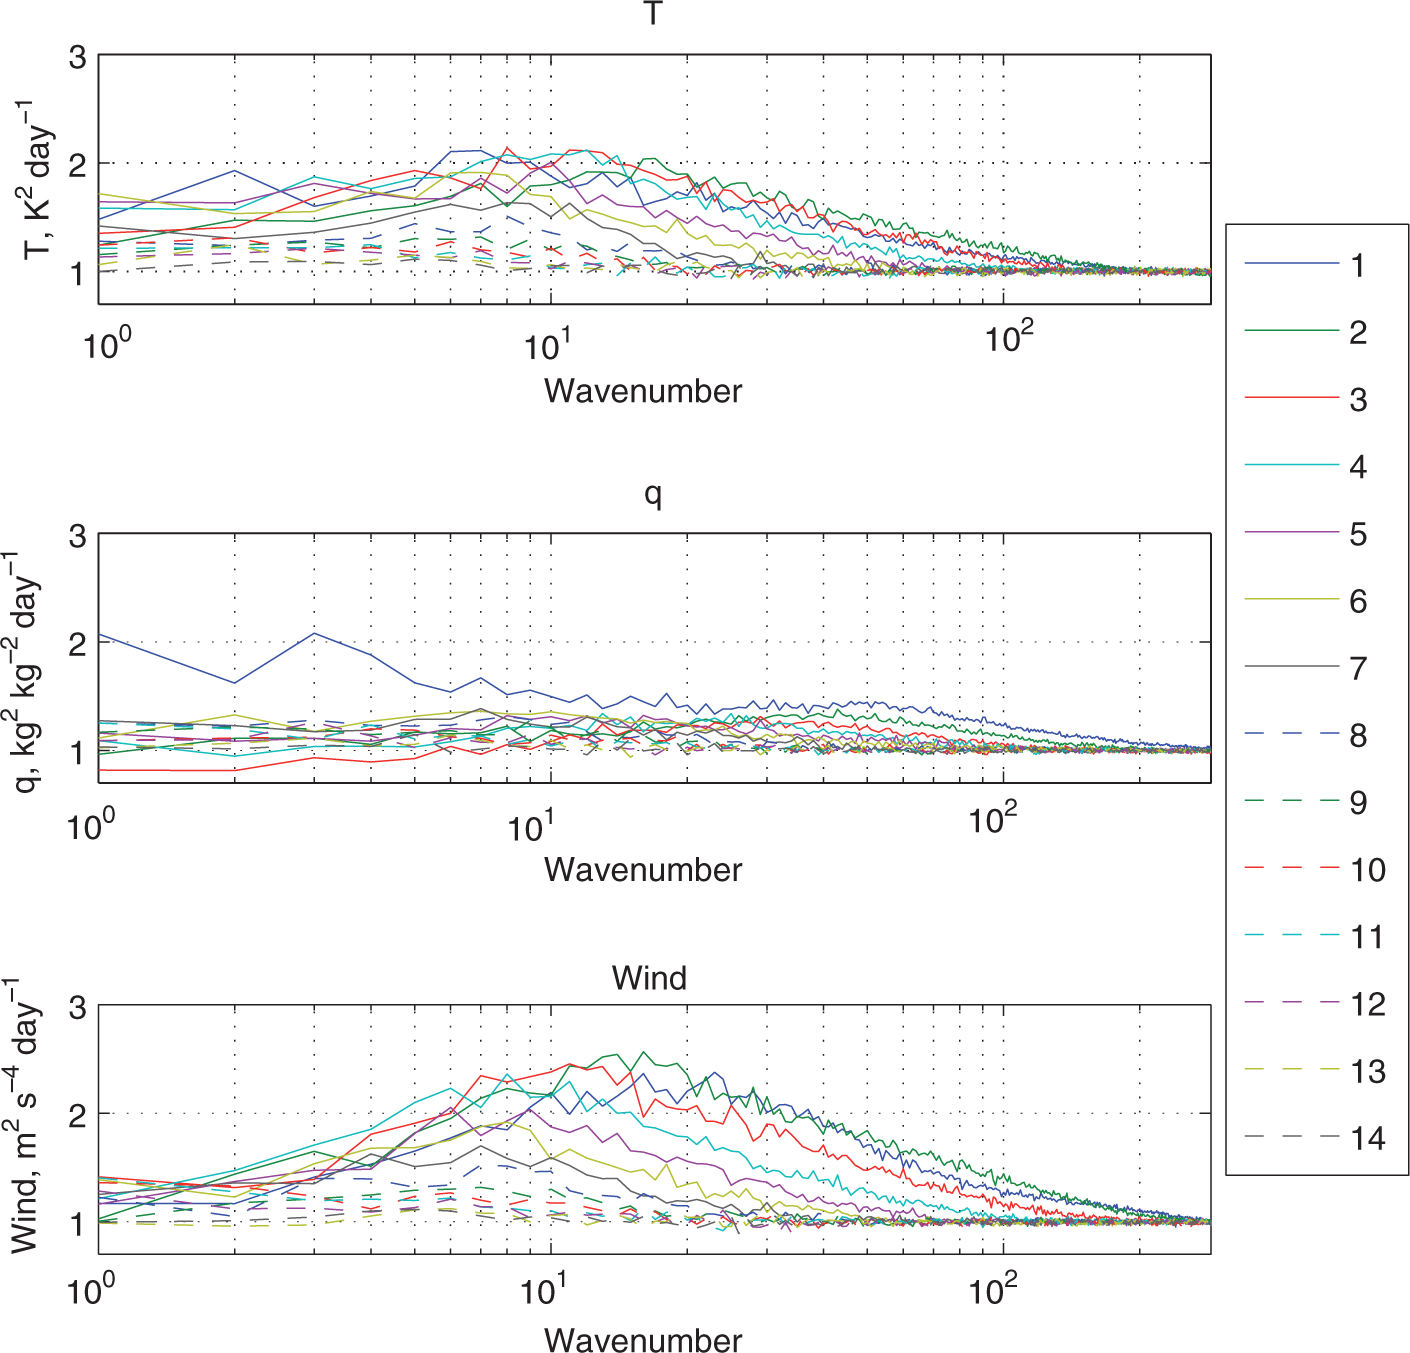
Fig. 2
Ratio of spectra of forecast error variances at the beginning and end of a 24-hour period, verified against NR over the July–August period. Each curve represents one forecast time interval at 24-hour intervals from the first 24 hours to the growth between 312 and 336 hours. Top, temperature, K2day−1; centre, 857 hPa specific humidity, kg2kg−2day−1; bottom, 356 hPa rotational wind, m2s−2day−1.
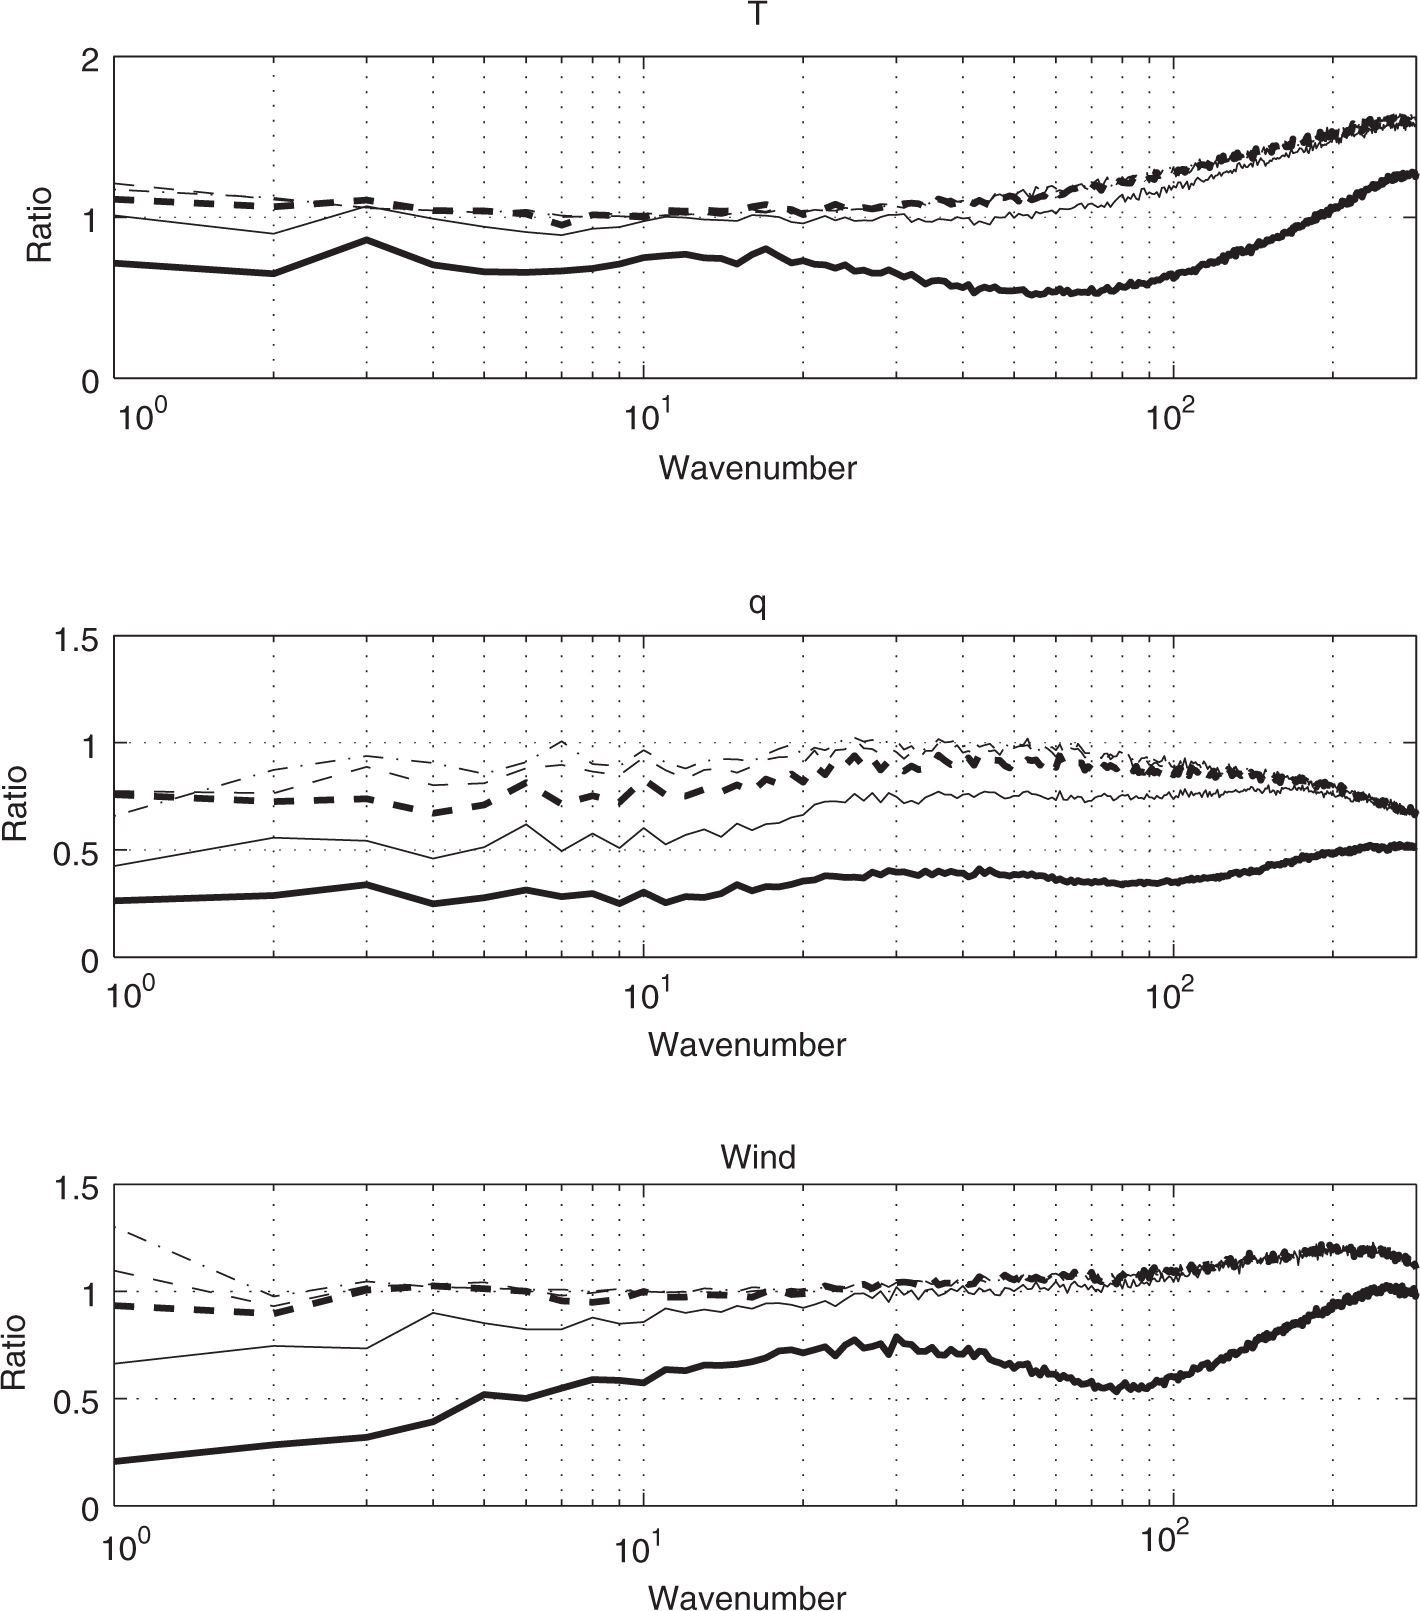
Fig. 3
Ratio of spectra of Control forecast error verified using the analysis to the spectra of forecast error verified using the NR over the July–August period. Heavy solid line, 24-hour forecast; solid thin line, 48-hour forecast; heavy dashed line, 72-hour forecast; thin dashed line, 96-hour forecast; dash-dot line, 120-hour forecast. Top, 506 hPa temperature; centre, 857 hPa specific humidity; bottom, 356 hPa rotational wind component.
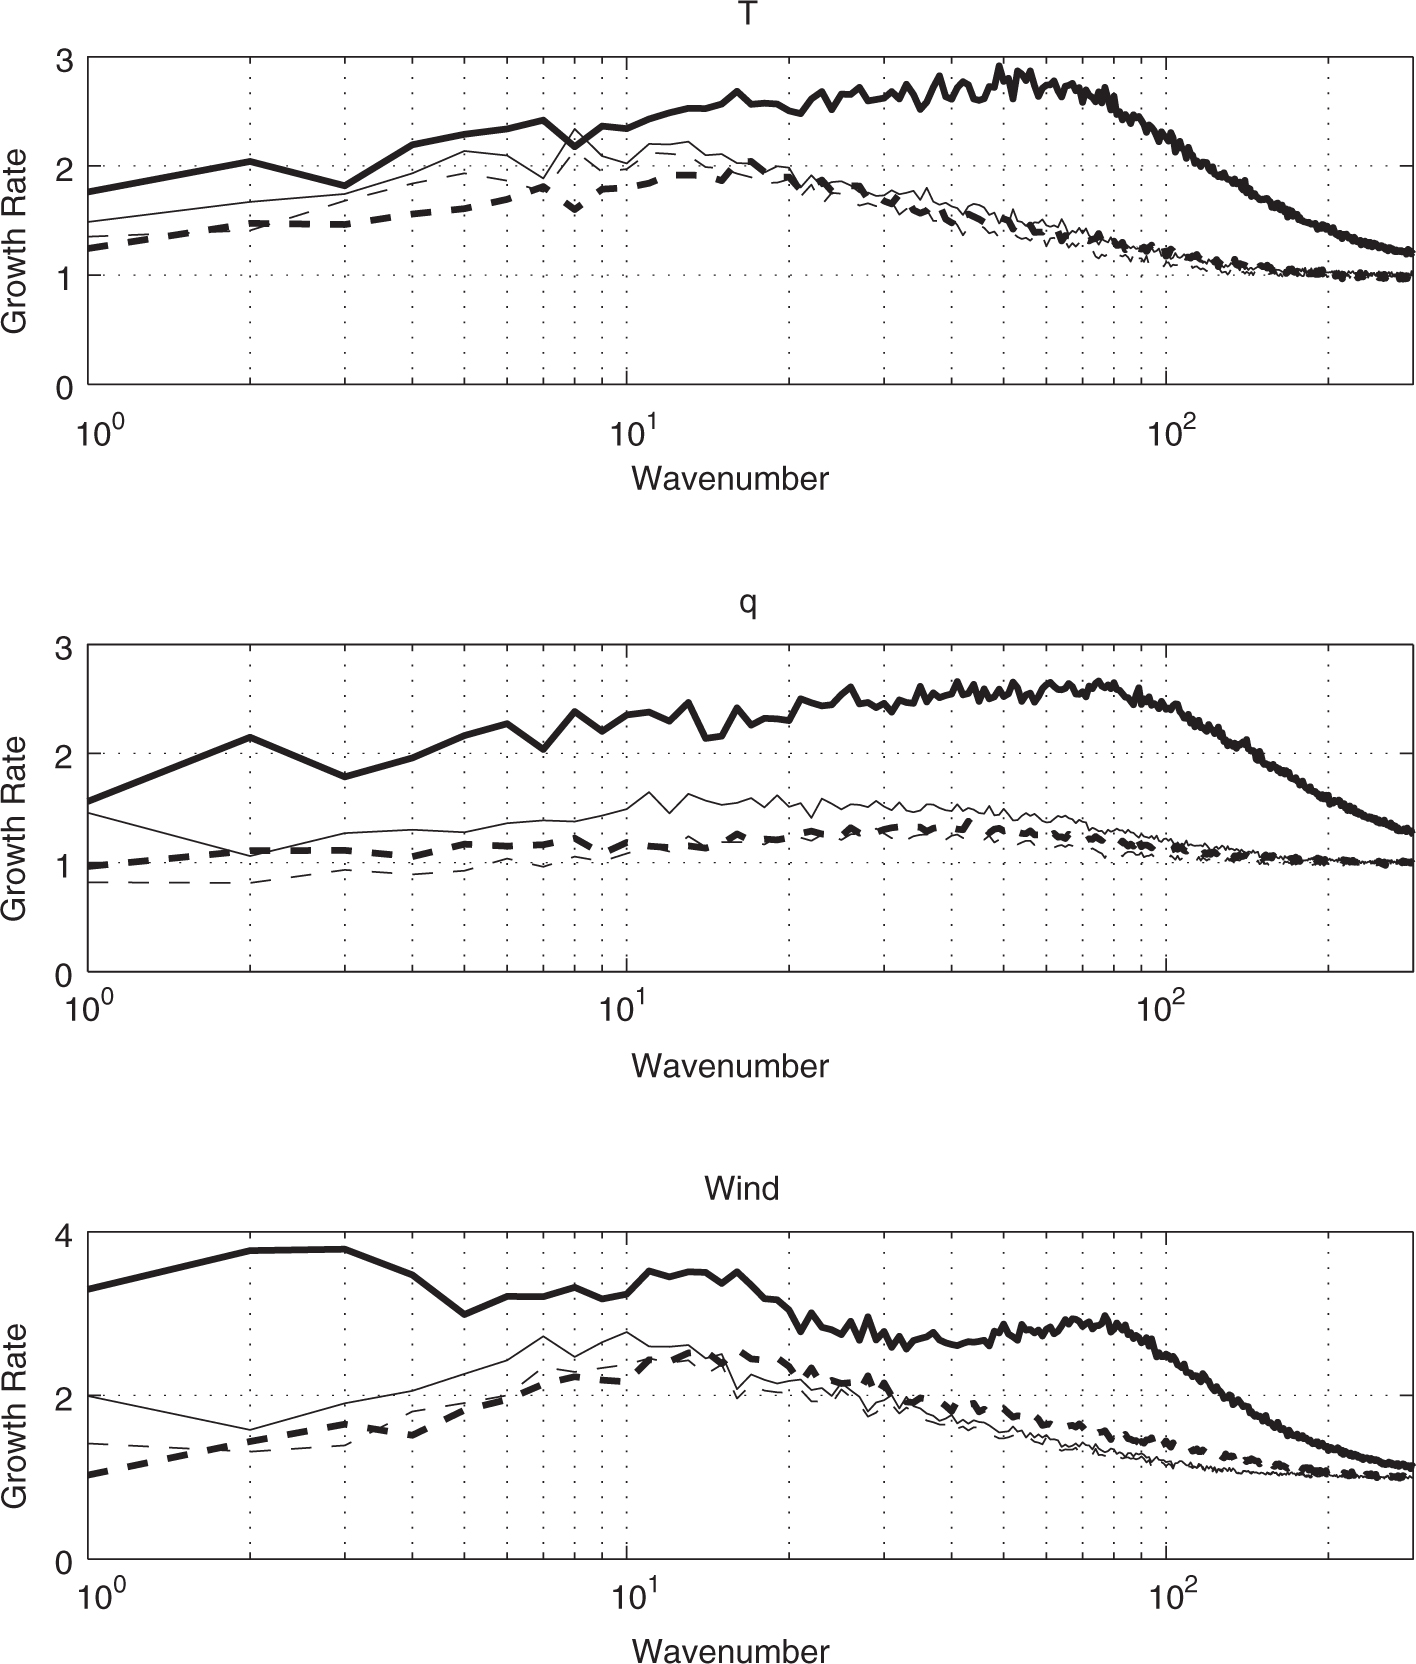
Fig. 4
24-hour Control forecast error growth rate spectra over the July–August period. Solid lines indicate verification against analysis; dashed lines indicate verification against NR; heavy lines indicate growth from 24 to 48 hours; and thin lines indicate growth from 48 to 72 hours. Top, 506 hPa temperature K2day−1; centre, 857 hPa specific humidity, kg2kg−2day−1; bottom, 356 hPa rotational wind, m2s−2day−1.
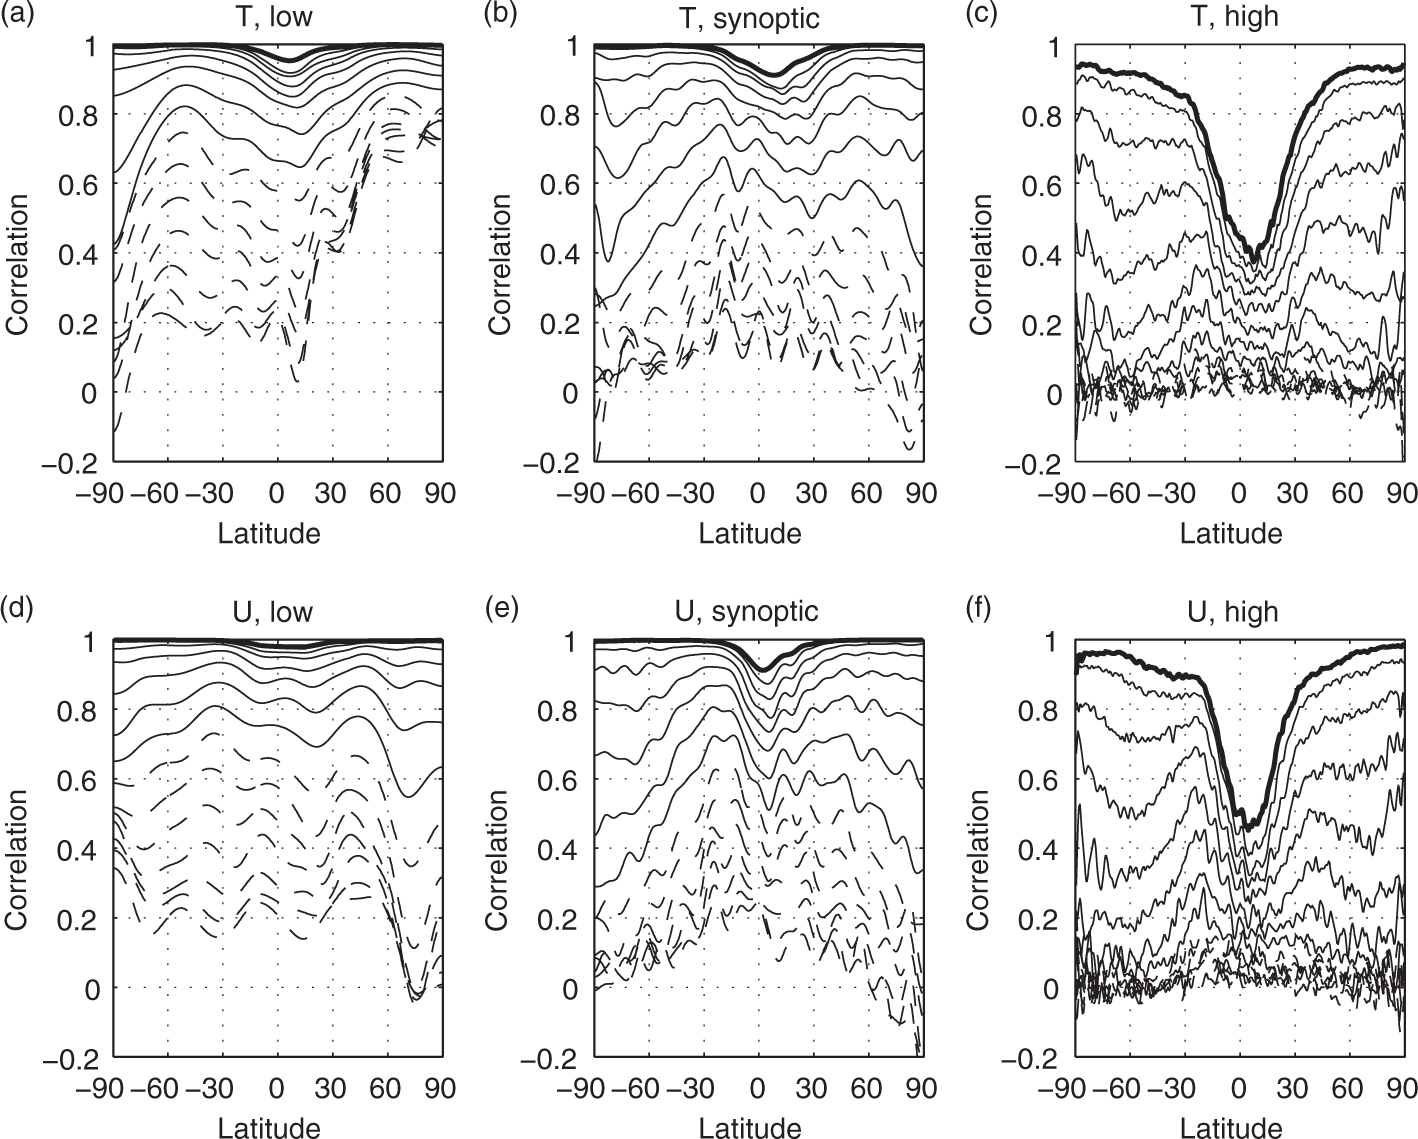
Fig. 5
Correlation of Control forecast fields with NR fields for various spectral ranges for the July–August period. Thick lines indicate analysis, thin solid lines show forecasts at 1 day intervals from 1 to 7 days; thin dashed lines show forecasts from 8 to 14 days. (a,b,c) 506 hPa temperatures; (d,e,f) 356 hPa zonal wind. (a,d) wavenumbers 1–7; (b,e) wavenumbers 8–20; (c,f) wavenumbers 21–287.
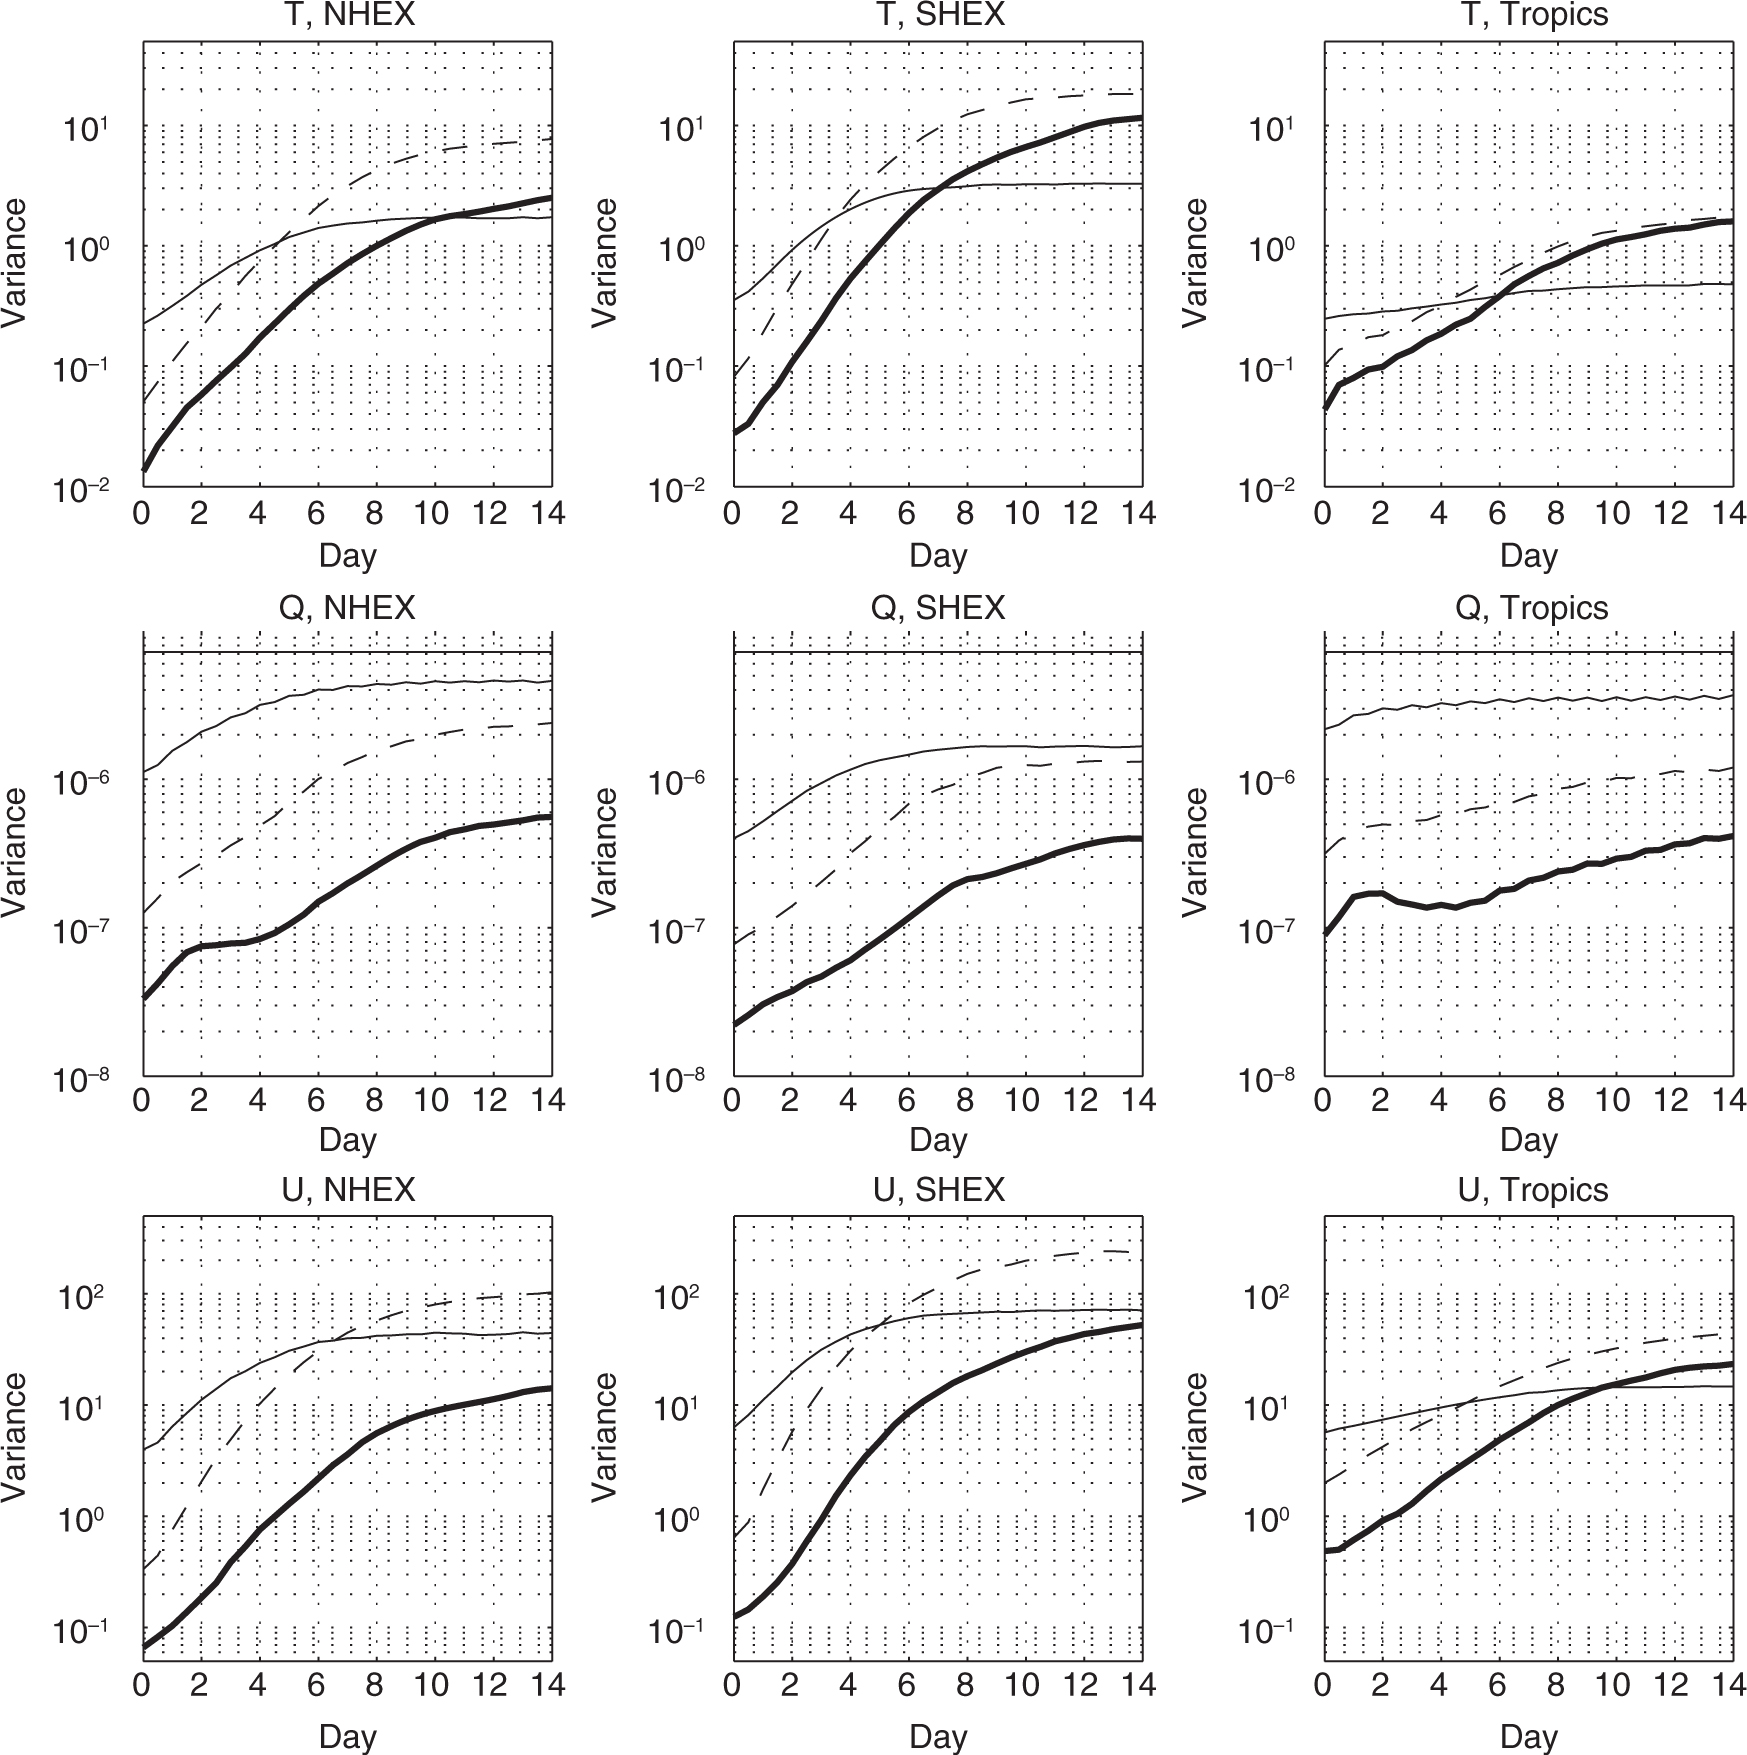
Fig. 6
Control error variances verified against NR for three regions as a function of forecast time for the July–August period: 60S–30S (SHEX), 20S–20N (Tropics) and 30N–60N (NHEX). Thick line, low wavenumbers 0–7; dashed line, synoptic wavenumbers 8–20; thin solid line, high wavenumbers 21–287. Top row, 506 hPa temperature, K2; centre row, 857 hPa specific humidity, kg2kg−2; bottom row, 356 hPa zonal wind, m2s−2.
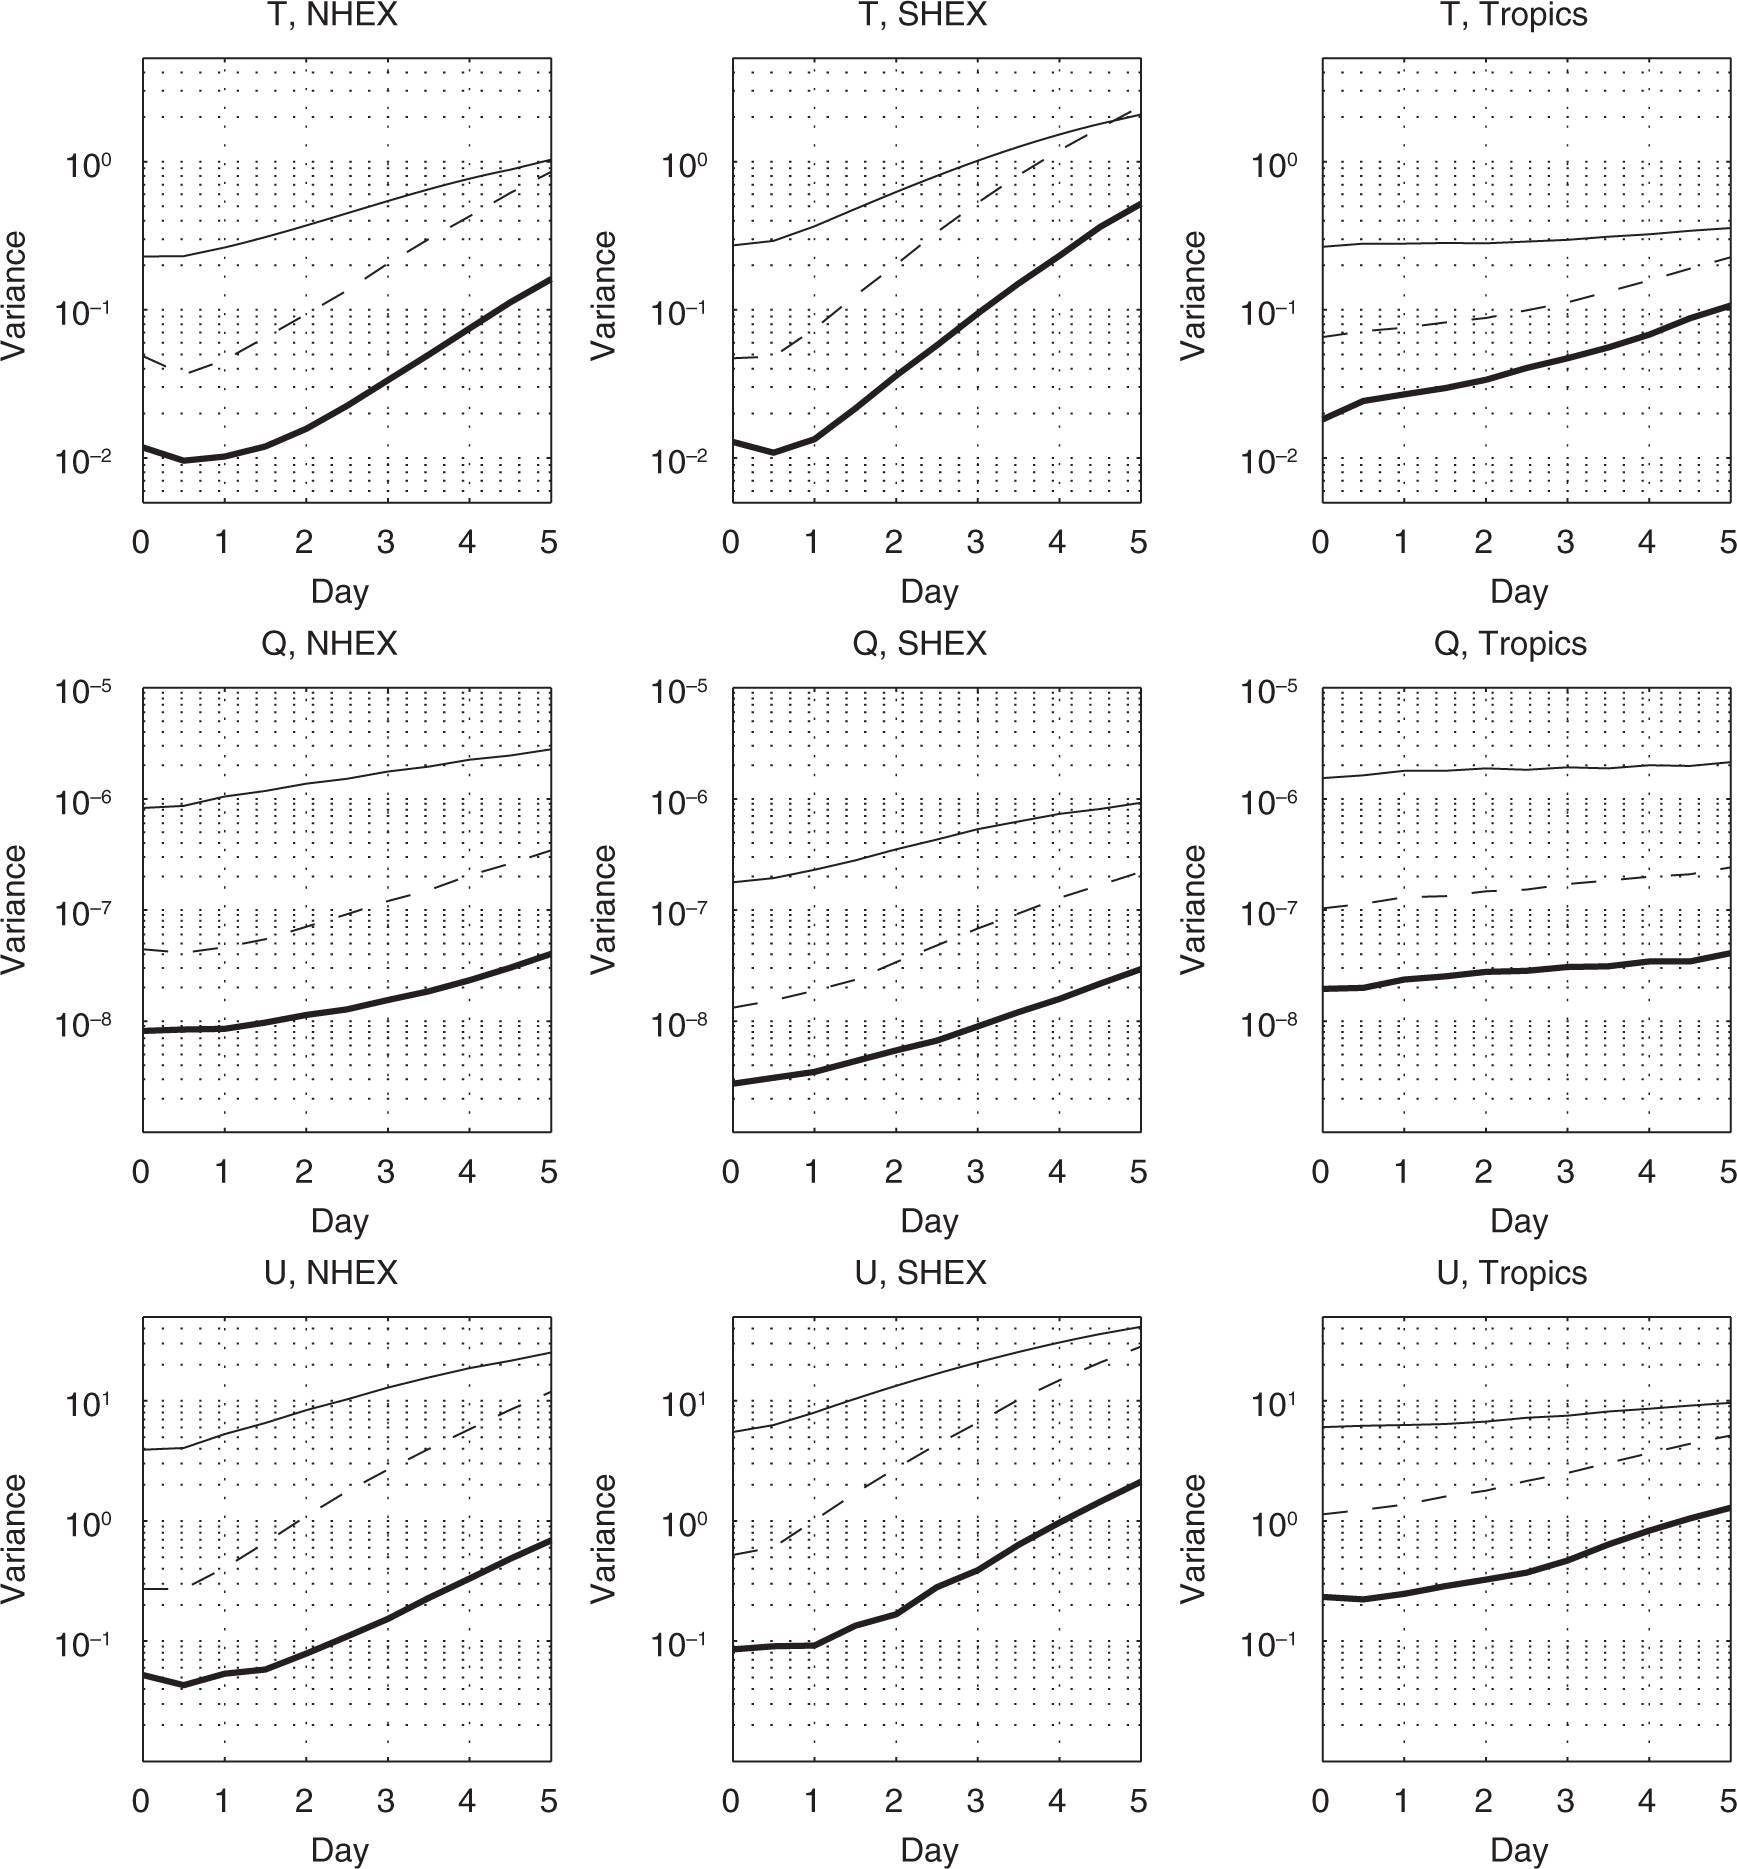
Fig. 7
Variances of differences between Control and Perturb for three regions as a function of forecast time: 60S–30S (SHEX), 20S–20N (Tropics) and 30N–60N (NHEX). Thick line, low wavenumbers 0–7; dashed line, synoptic wavenumbers 8–20; thin solid line, high wavenumbers 21–287. Top row, 506 hPa temperature; centre row, 857 hPa specific humidity, kg2kg−2; bottom row, 356 hPa zonal wind.
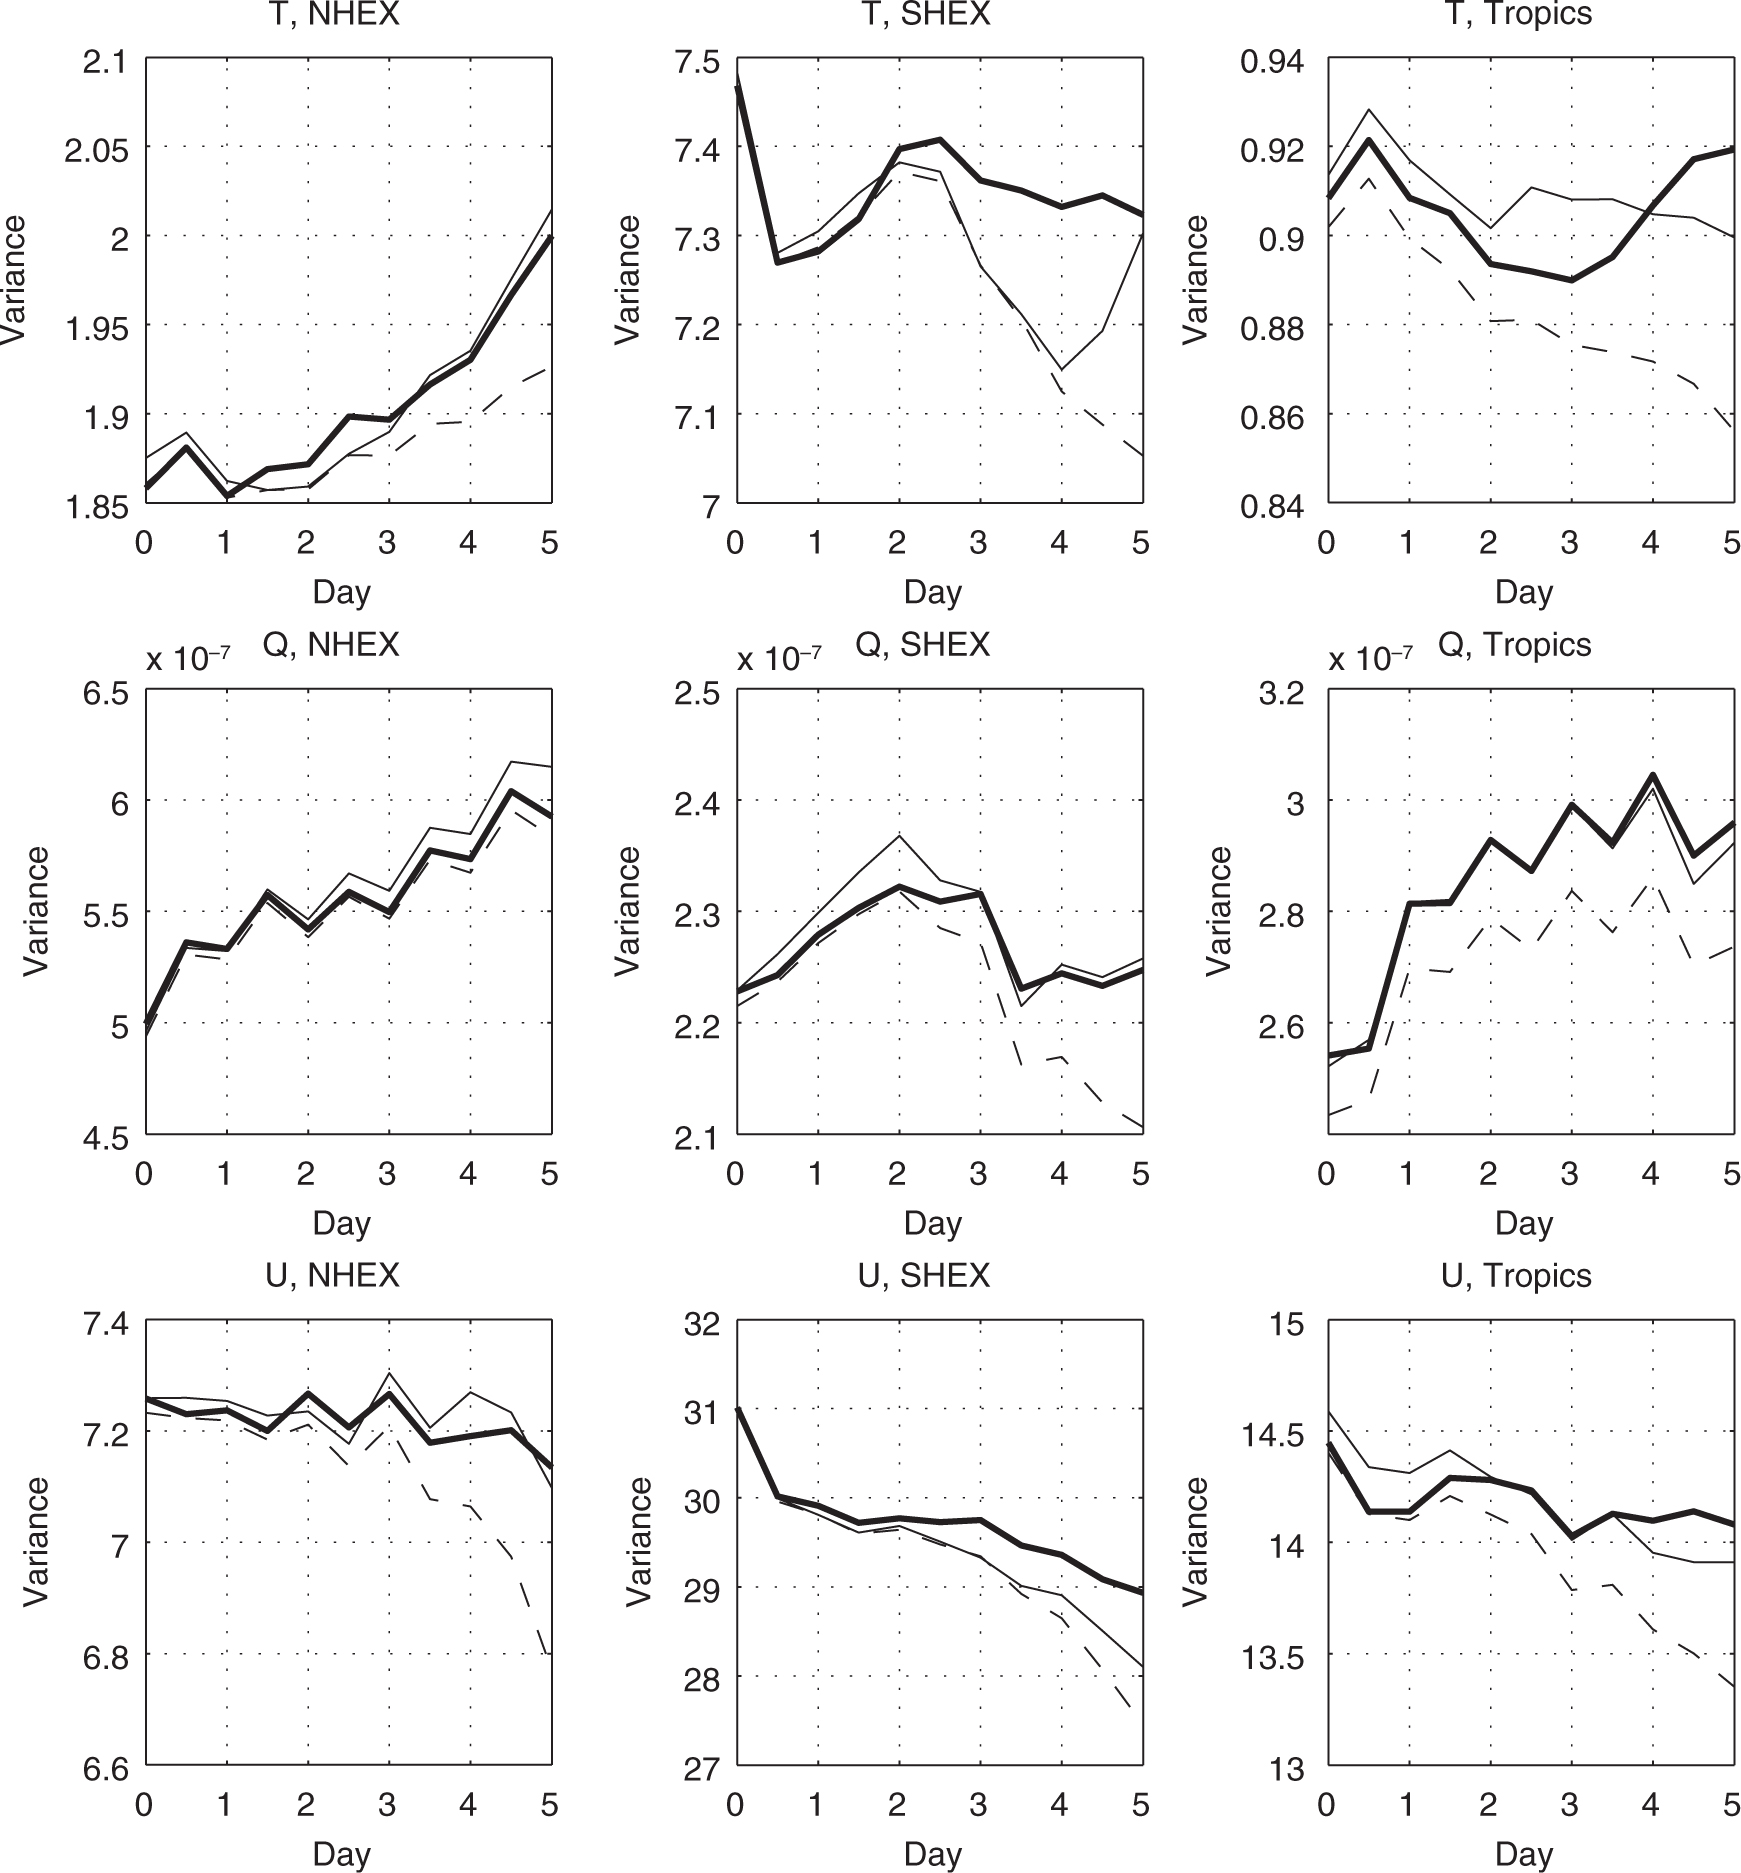
Fig. 8
Variance of Control fields (thick solid line), variance of Perturb fields (thin line) and covariance of Control and Perturb fields (dashed line) for the July–August period: 60S–30S (SHEX), 20S–20N (Tropics) and 30N–60N (NHEX) for low wavenumbers. Top row, 506 hPa temperature, K2; centre row, 857 hPa specific humidity, kg2kg−2; bottom row, 356 hPa zonal wind, m2s−2.
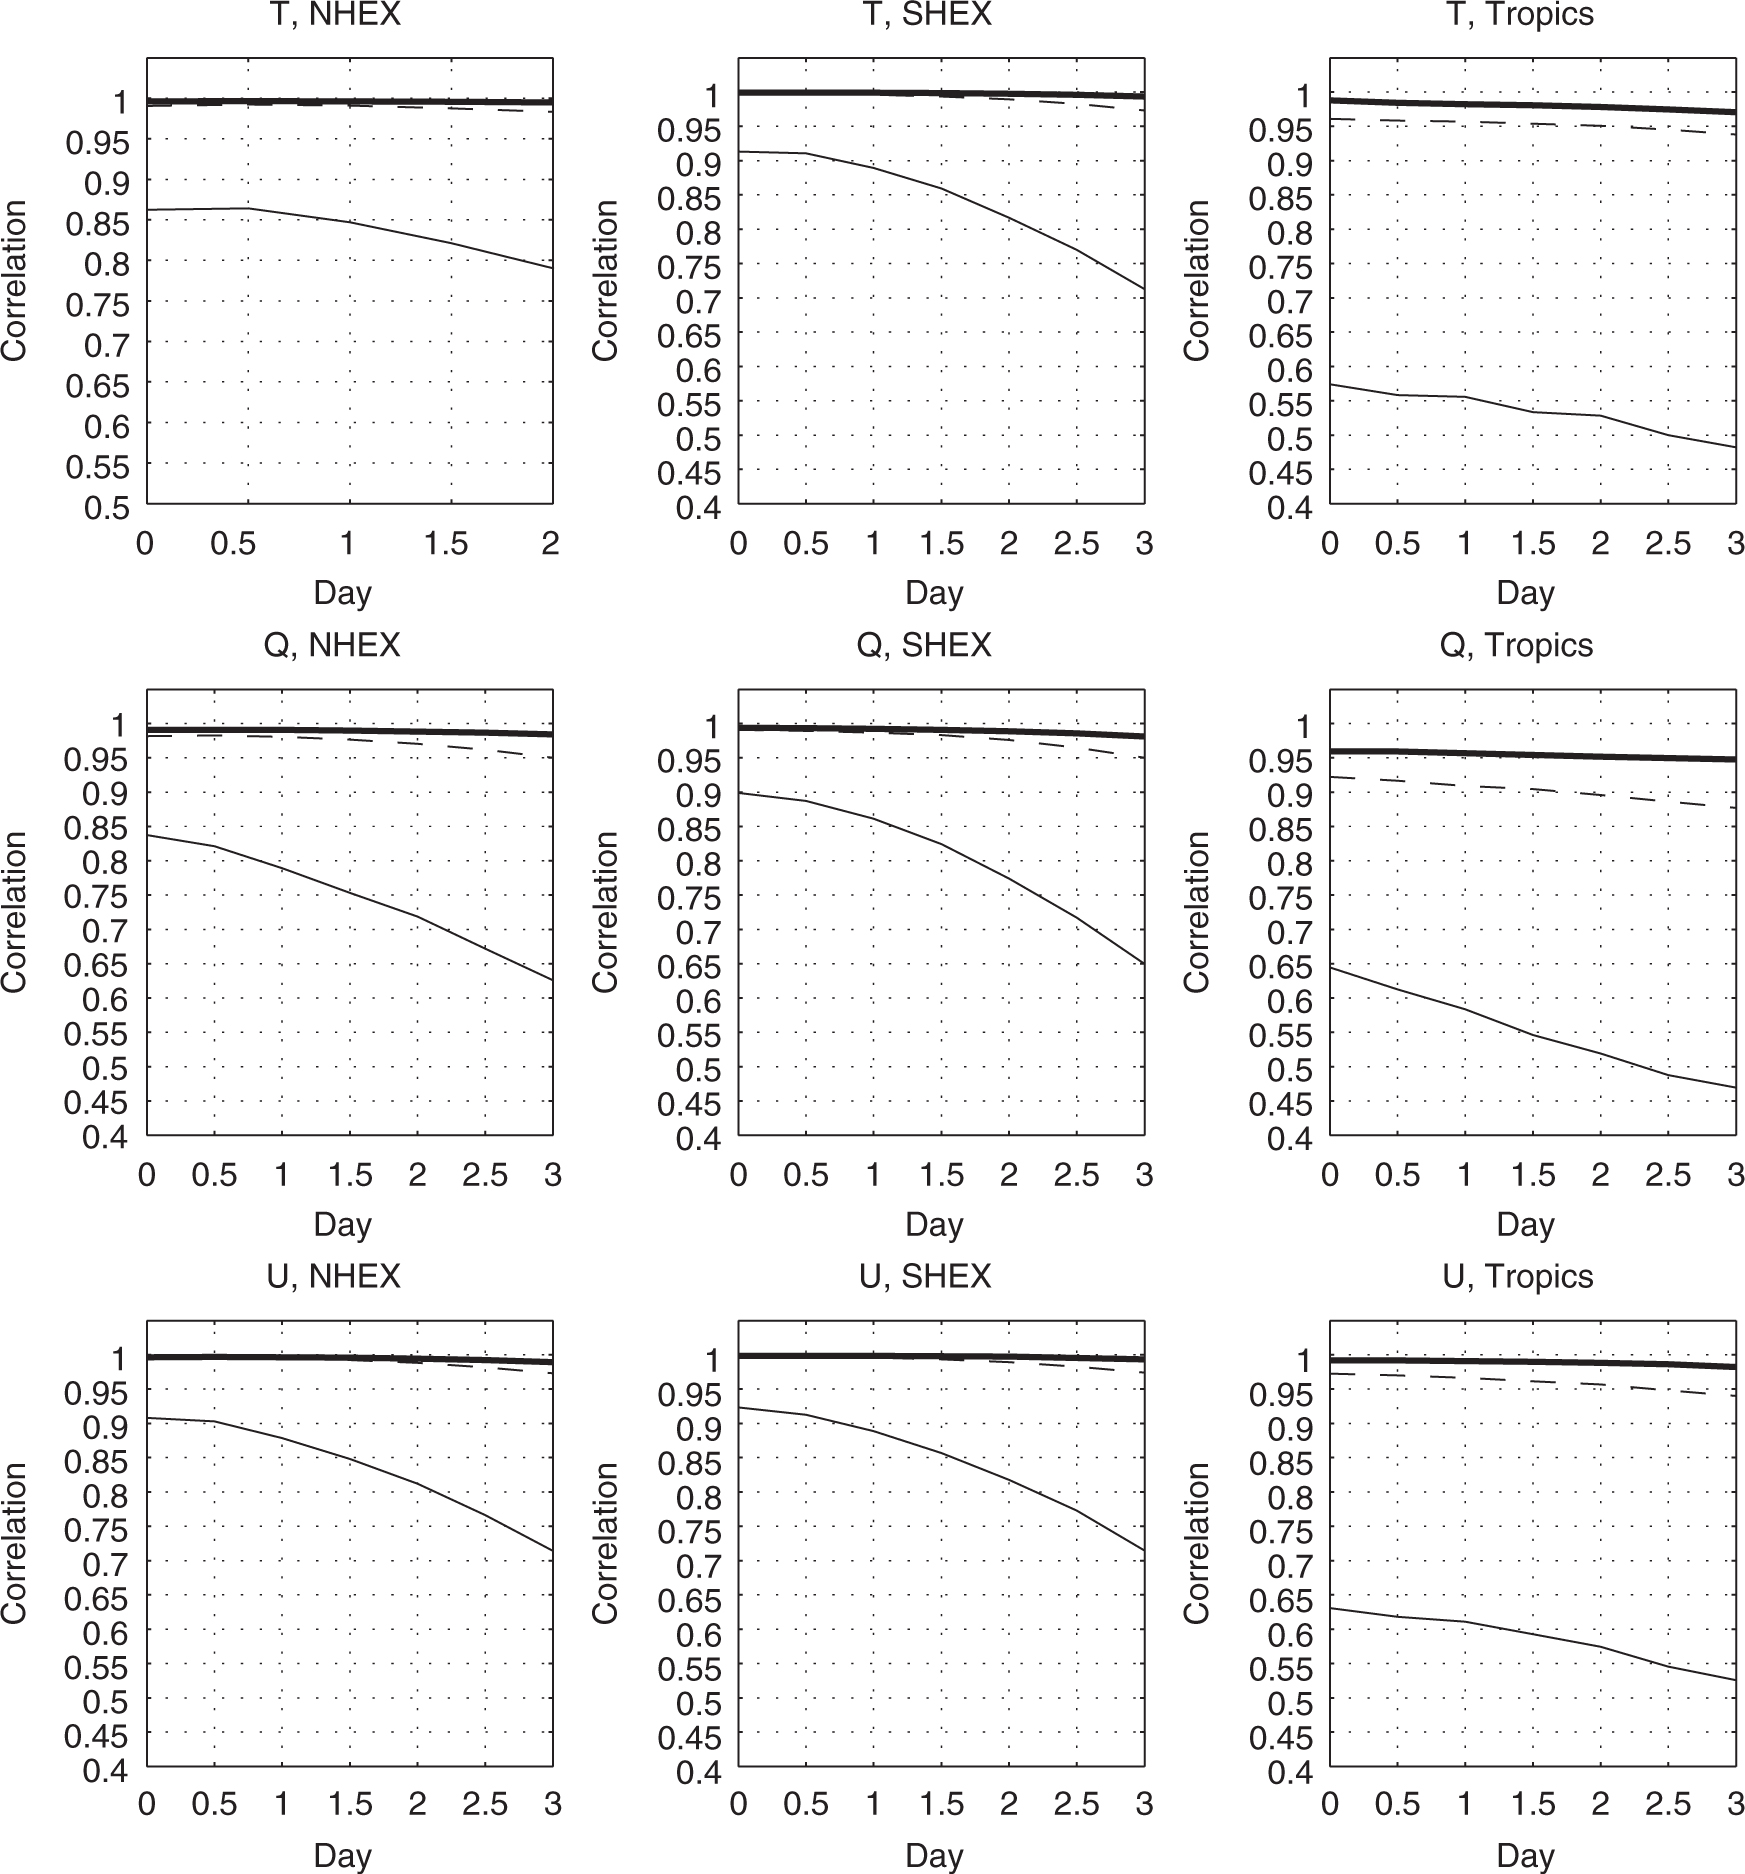
Fig. 9
Correlations between Control and Perturb forecast fields for three regions as a function of forecast time for the July–August period: 60S–30S (SHEX), 20S–20N (Tropics) and 30N–60N (NHEX). Thick line, low wavenumbers 0–7; dashed line, synoptic wavenumbers 8–20; thin solid line, high wavenumbers 21–287. Top row, 506 hPa temperature; centre row, 857 hPa specific humidity; bottom row, 356 hPa zonal wind.
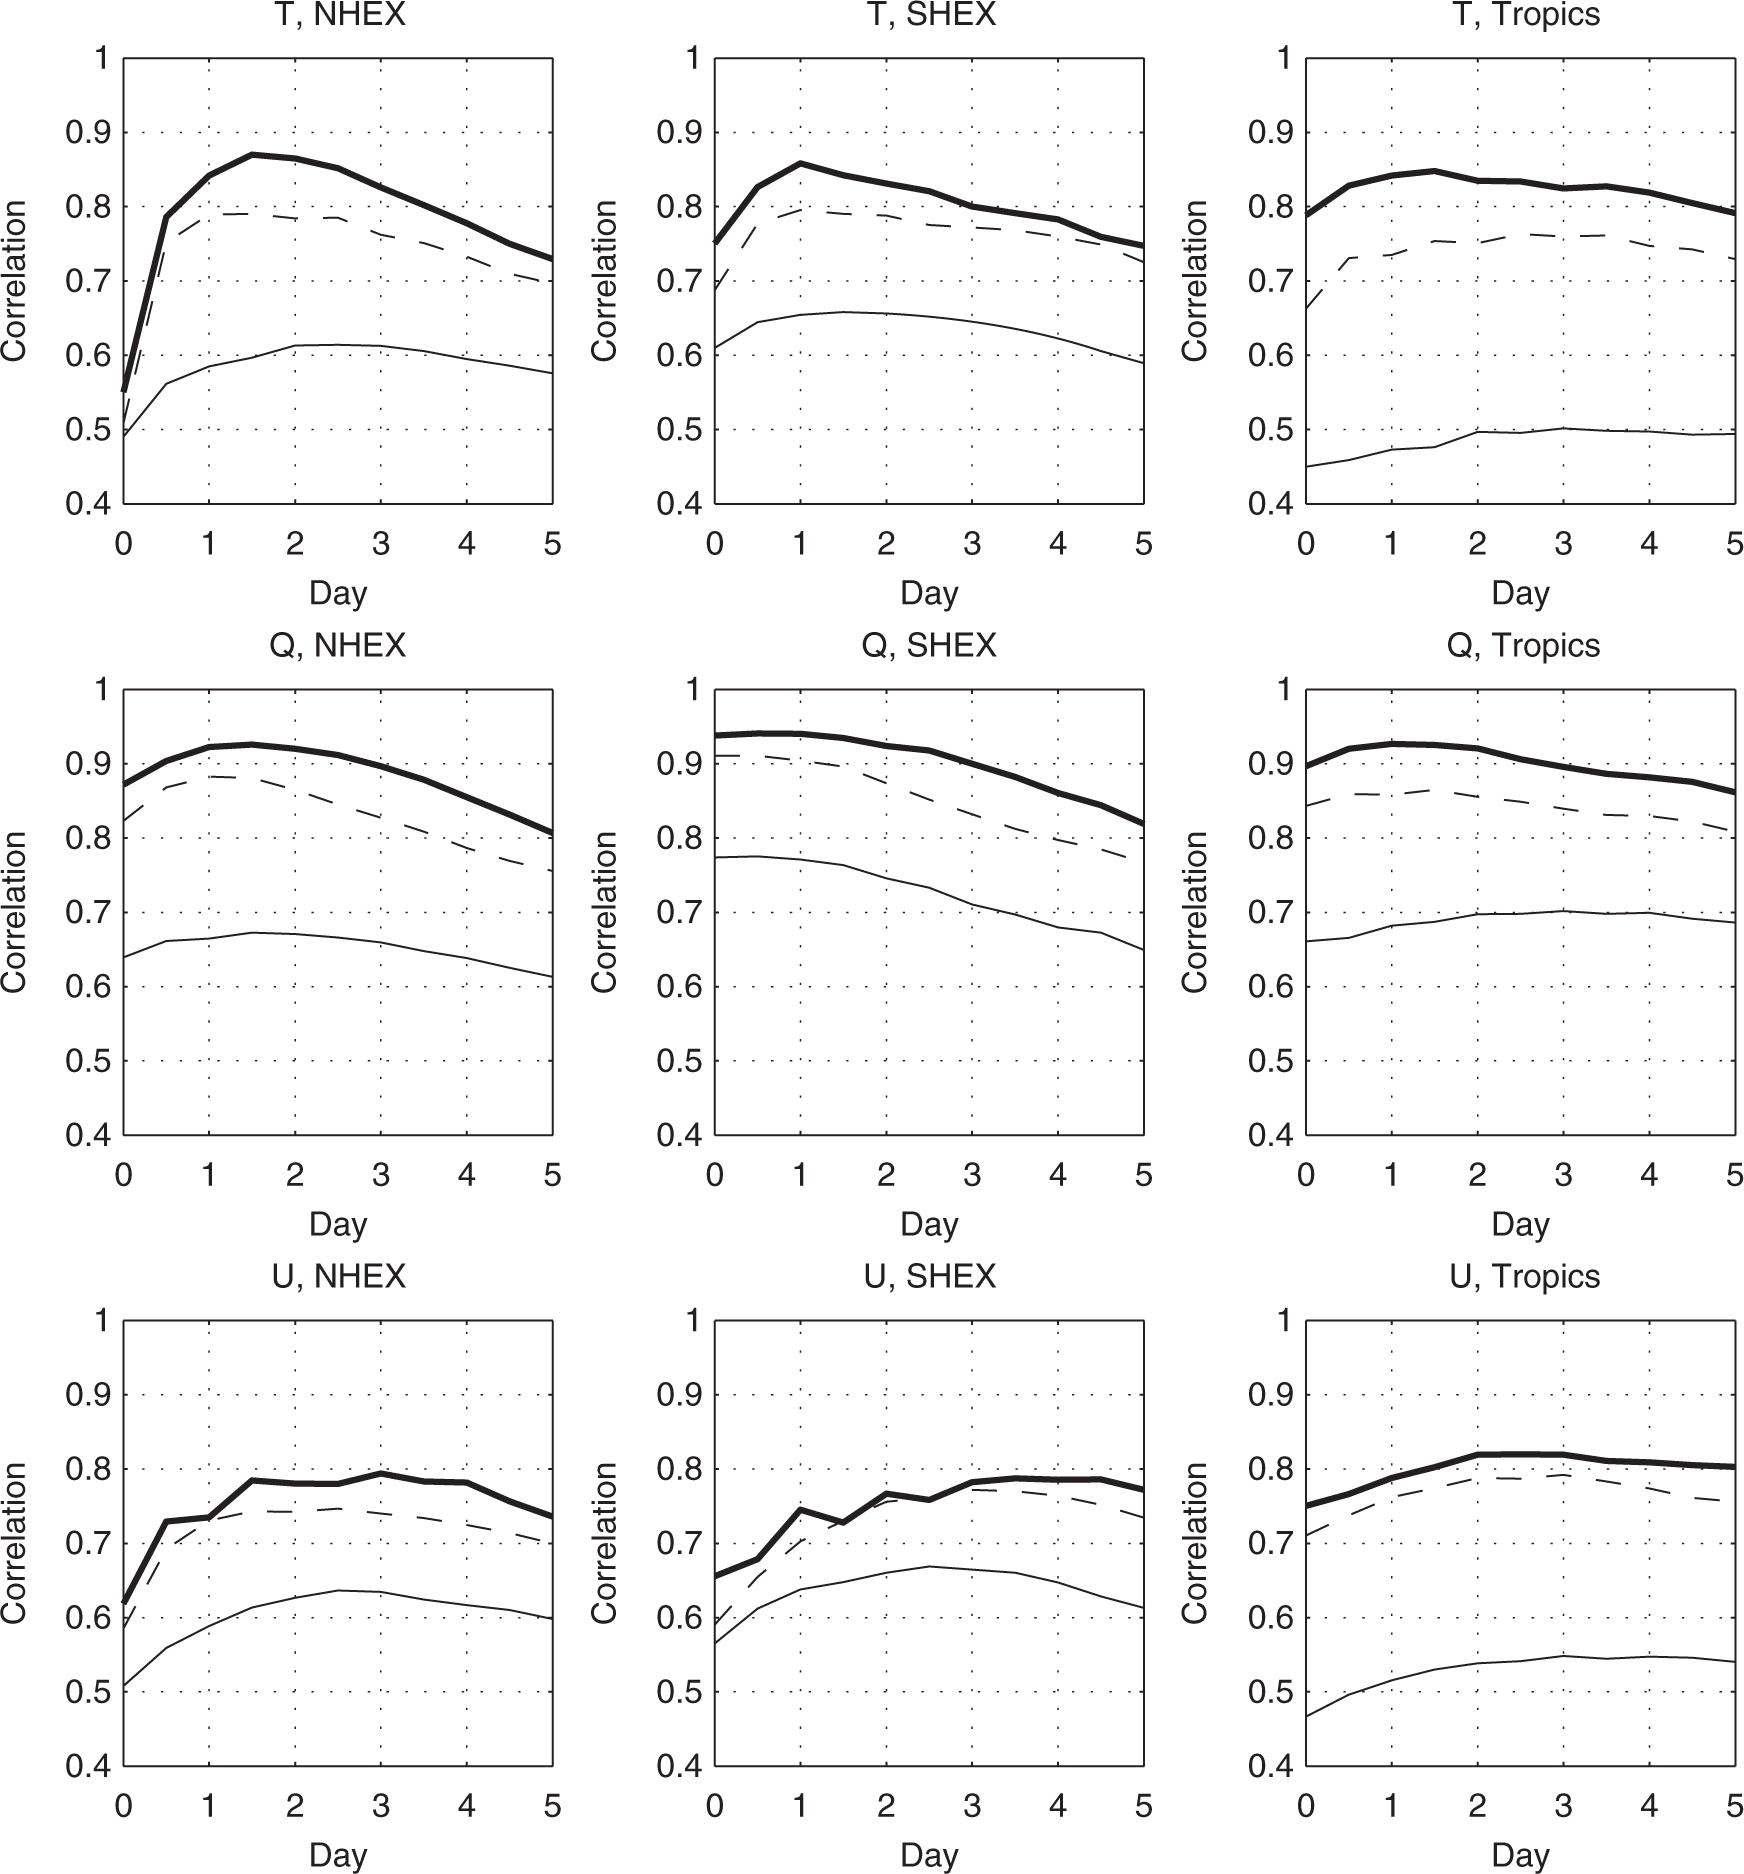
Fig. 10
Correlations between Control forecast errors and Perturb forecast errors for three regions as a function of forecast time for the July–August period: 60S–30S (SHEX), 20S–20N (Tropics) and 30N–60N (NHEX). Thick line, low wavenumbers 0–7; dashed line, synoptic wavenumbers 8–20; thin solid line, high wavenumbers 21–287. Top row, 506 hPa temperature; centre row, 857 hPa specific humidity; bottom row, 356 hPa zonal wind.