
Table 1. Three Kalman gain schemes
General Kalman (GK)(7)Ensemble mean of forecast Modified Kalman 1 (MK1)(14)Forecast of ensemble mean Modified Kalman 2 (MK2)(16)Perturbed observation (yo+ɛ)
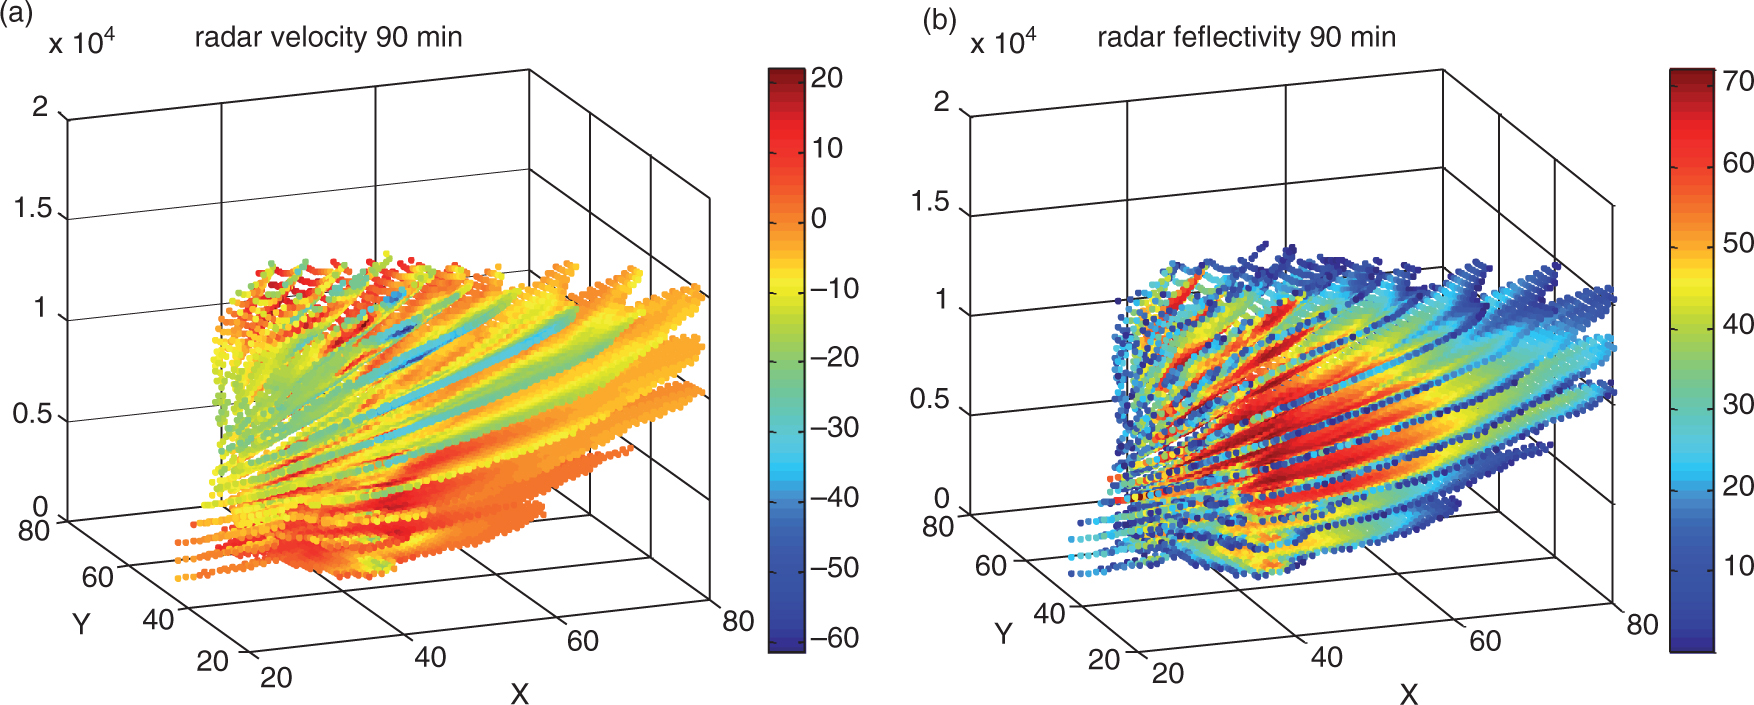
Fig. 1
Simulated radar data at 90th minute: (a) radial velocity, (b) reflectivity (x-axis and y-axis are model grid numbers and z-axis is the height in m).
Table 2. List of data assimilation experiments
Exp1GKGKExp2GKMK1Exp3GKMK2Exp4GKMK2 (double perturbation variance)
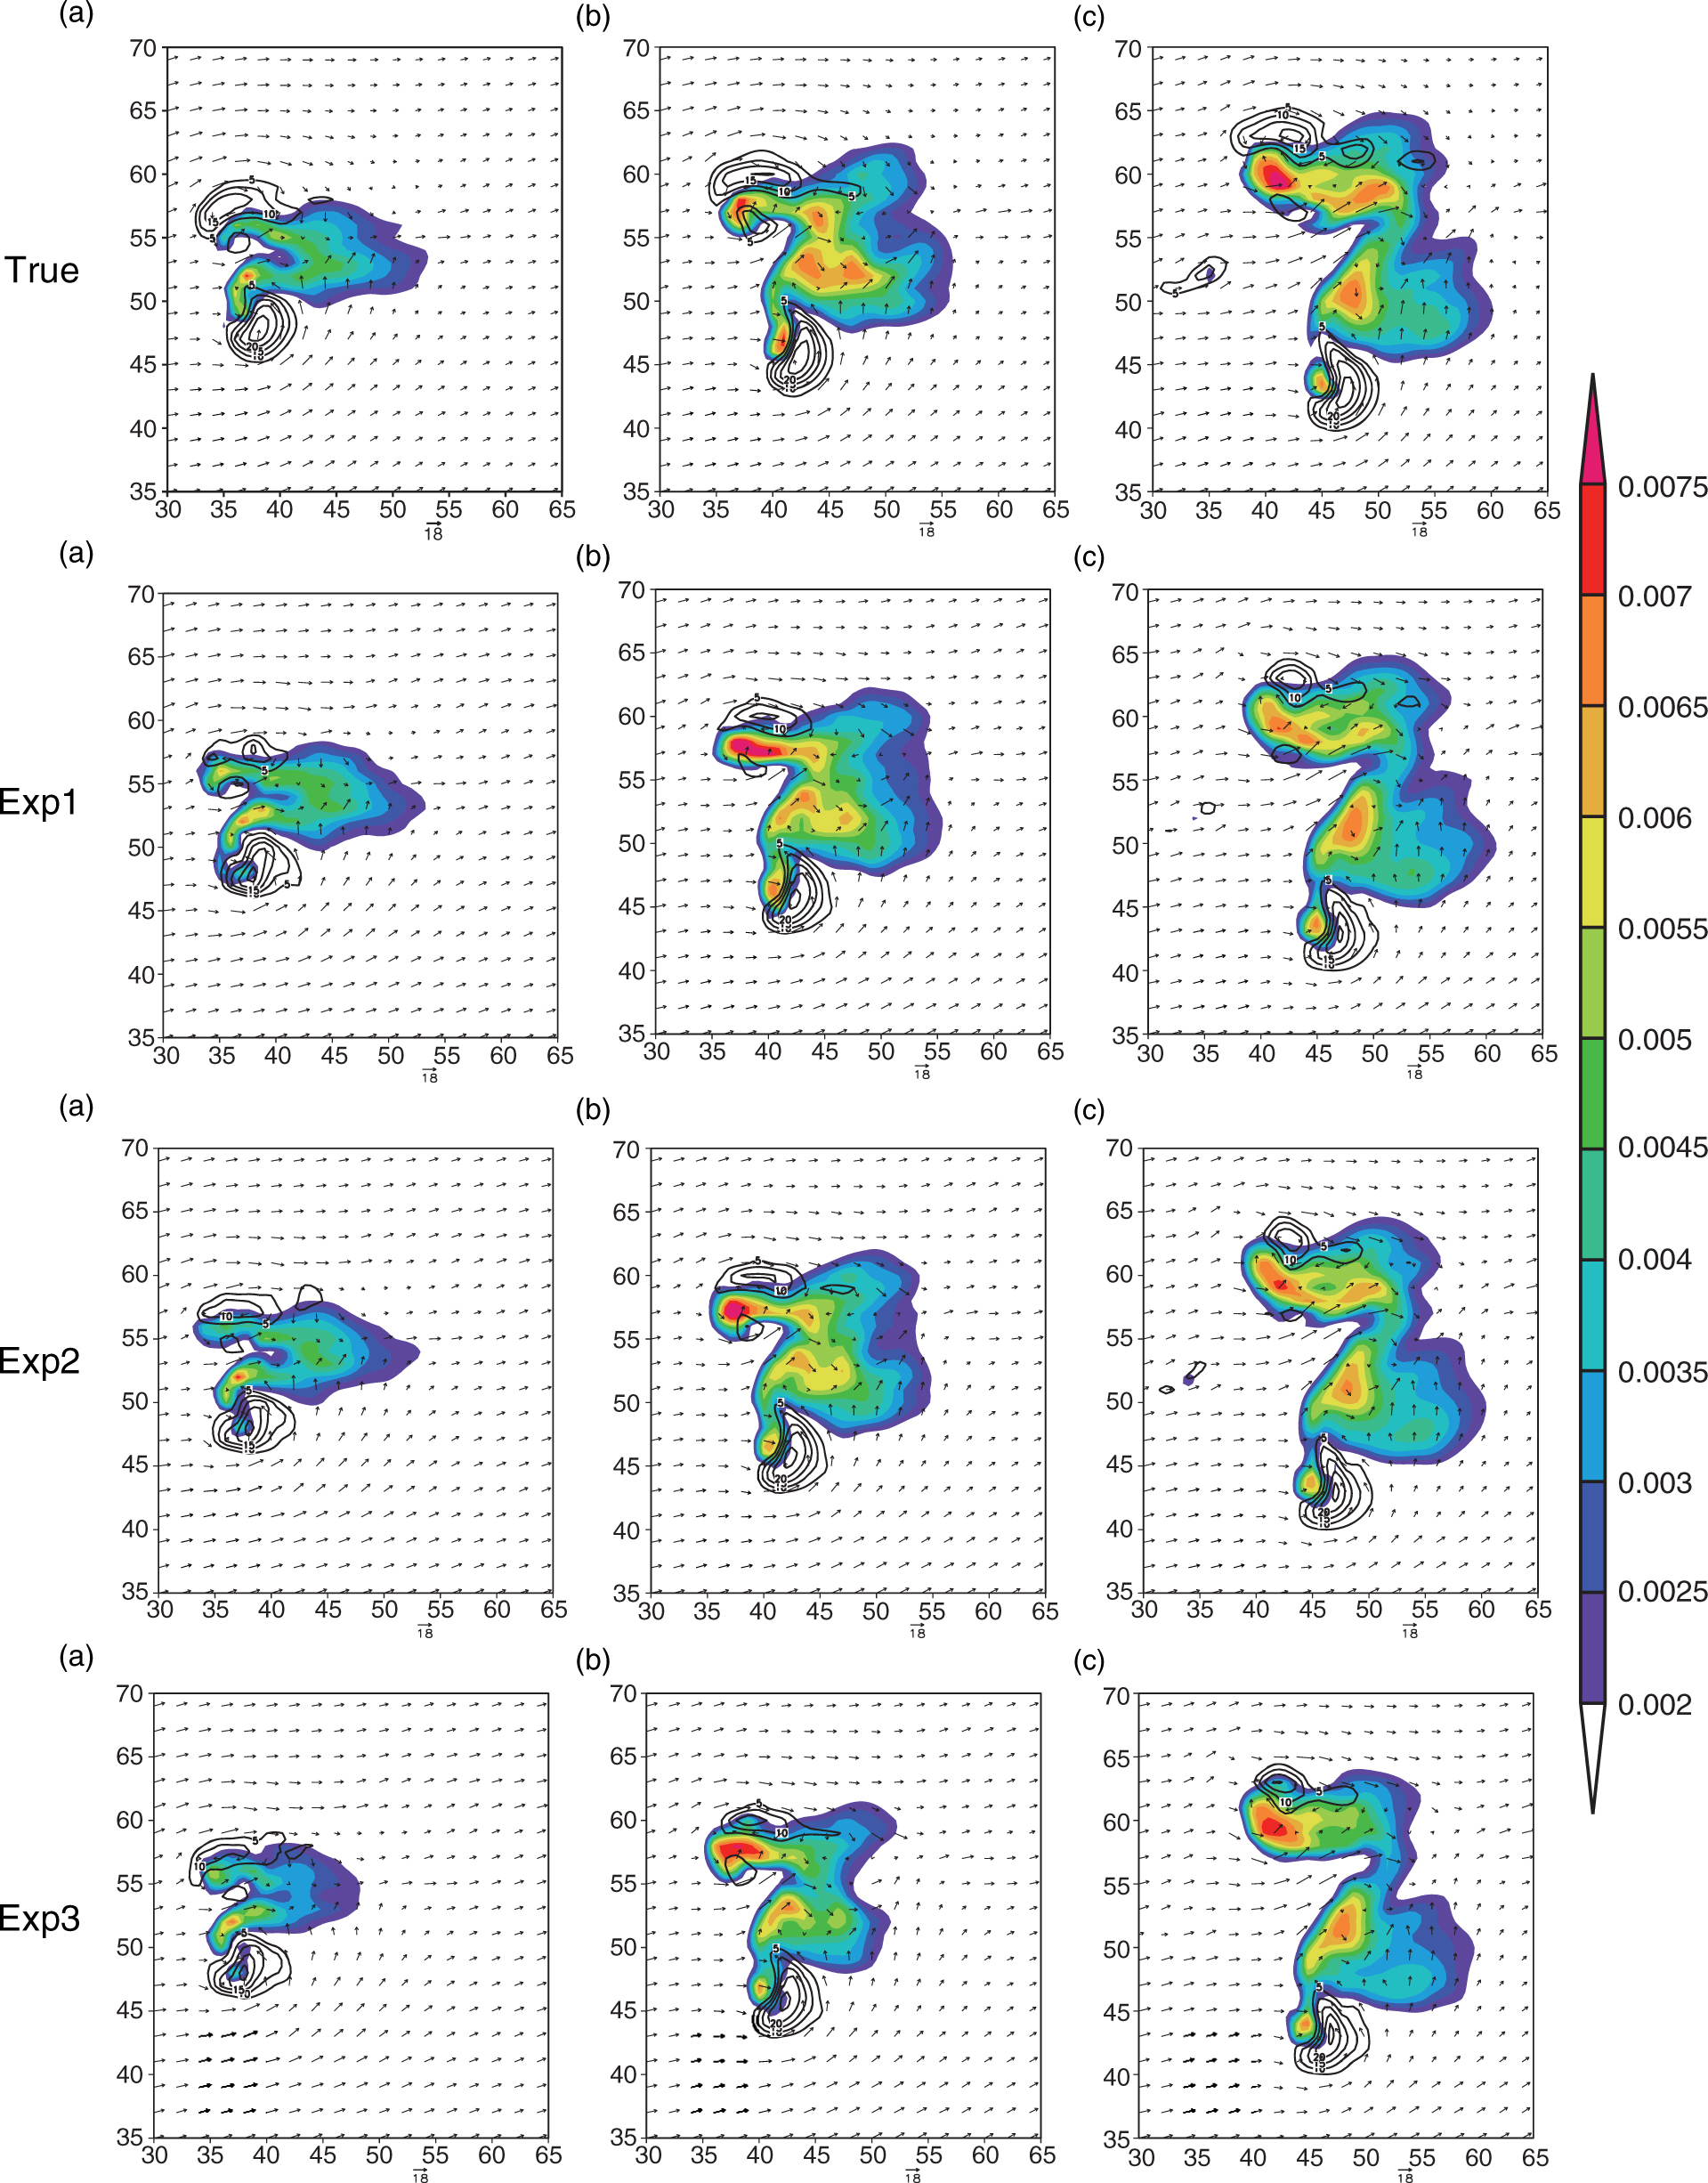
Fig. 2
Horizontal wind (vectors, m s−1), vertical velocity (solid contours at intervals of 5 m s−1, starting from 5 m s−1) and graupel mixing ratio (shading at intervals of 0.0005 kg kg−1) at z=4 km for the truth, Exp1, Exp2 and Exp3 (from top to bottom) at the 60th (a), 75th (b) and 90th (c) minute (x-axis and y-axis are model grid numbers).
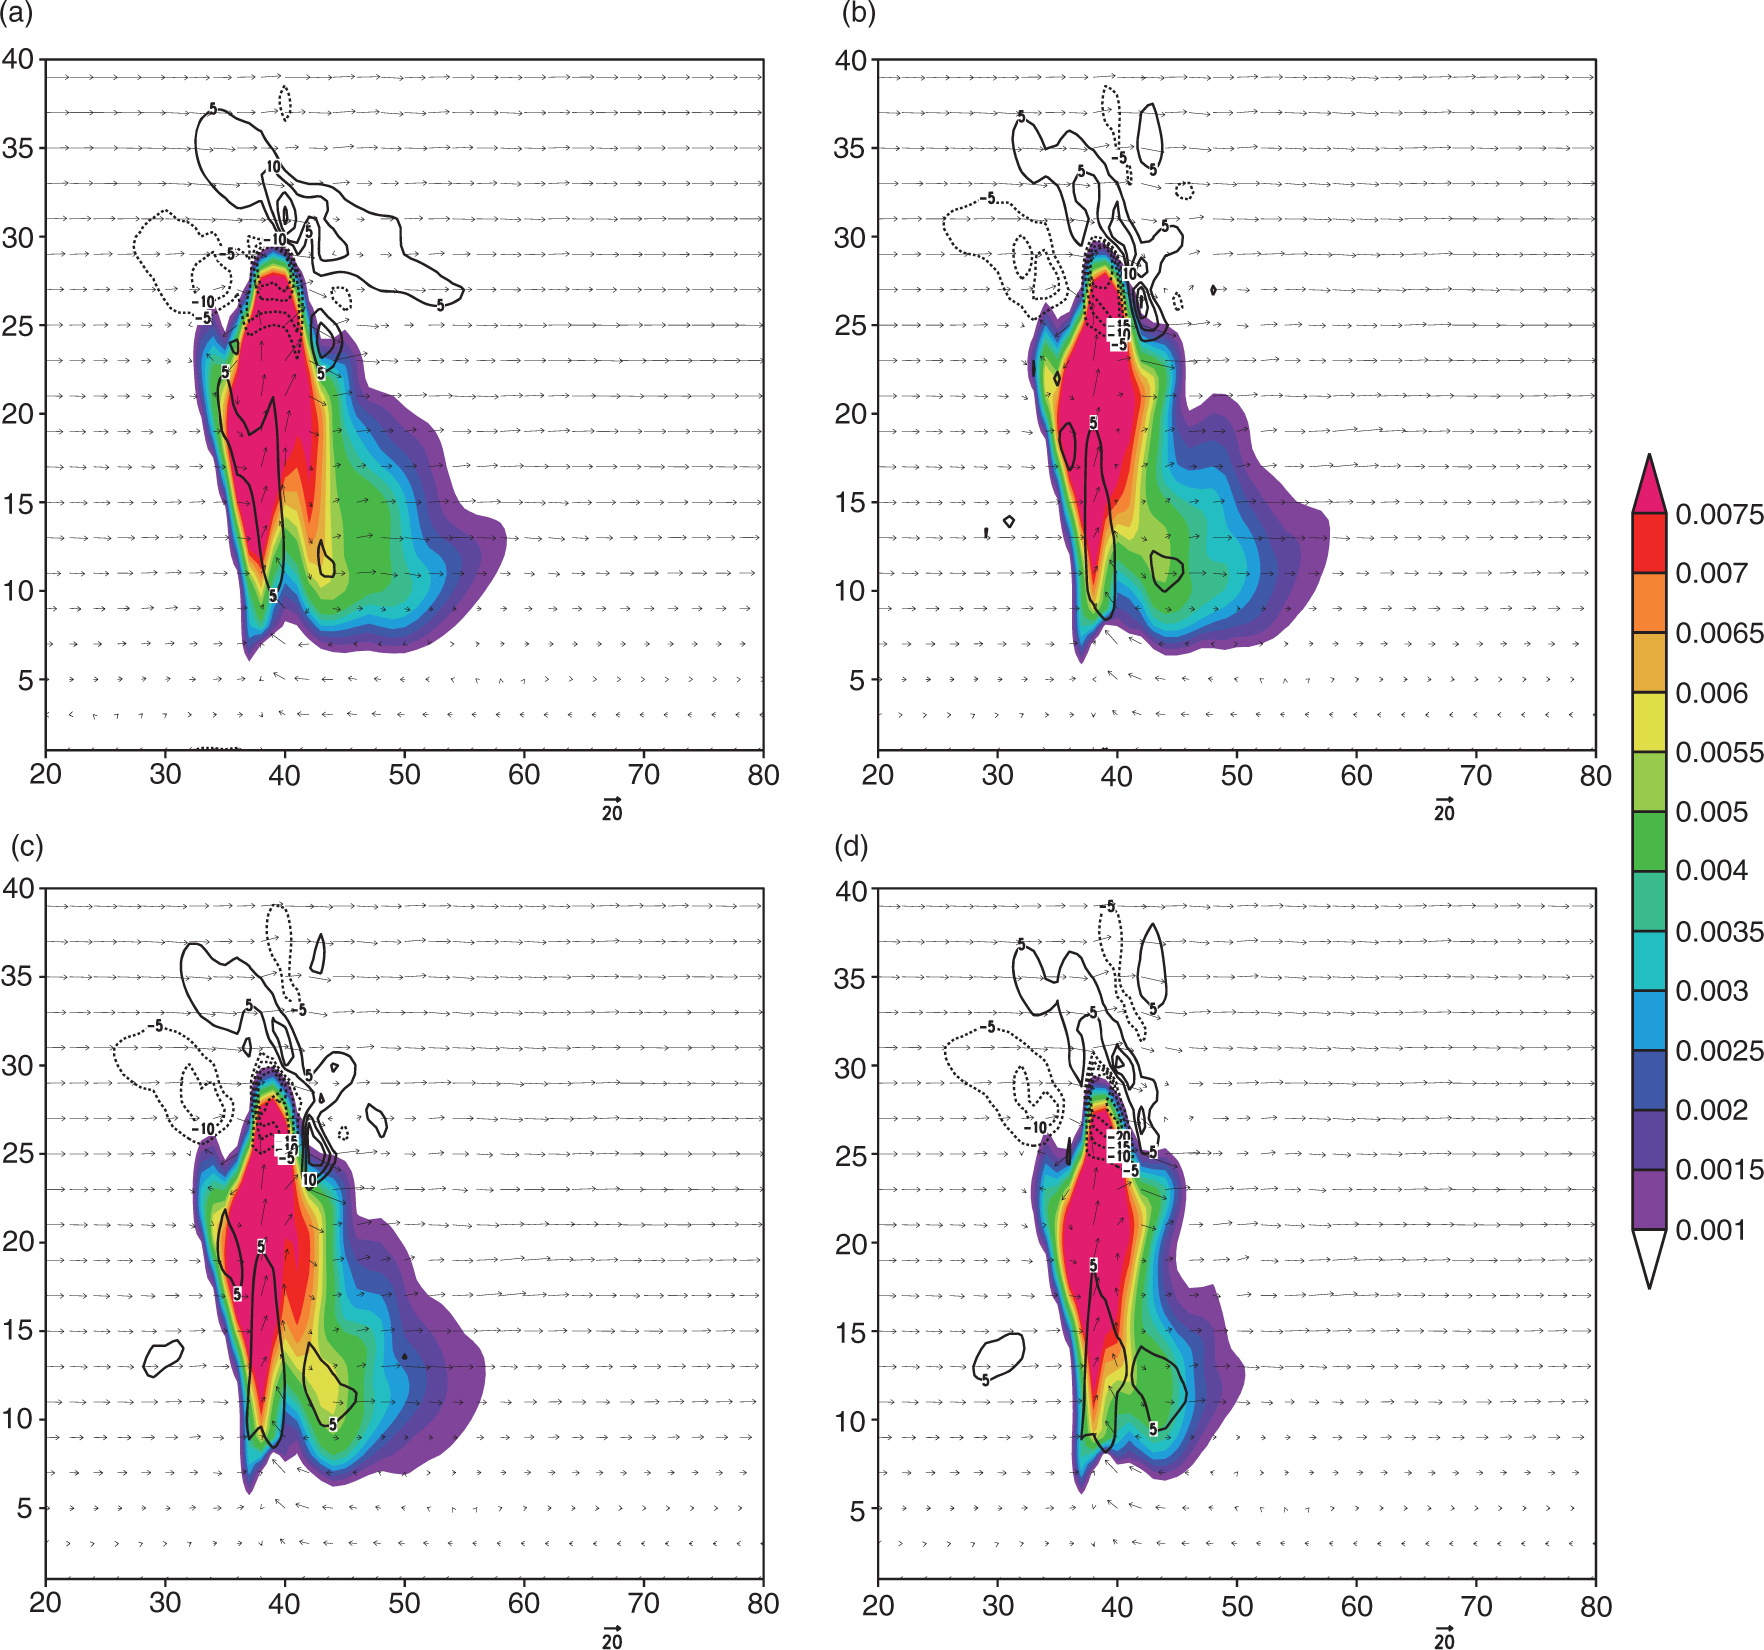
Fig. 3
Vertical wind (vector), perturbation potential temperature (black line) and graupel mixing ratio (shading) at the 65th minute, y=50: (a) the truth, (b) Exp1, (c) Exp2 and (d) Exp3 (x-axis is model x-direction grid number, y-axis is model level).
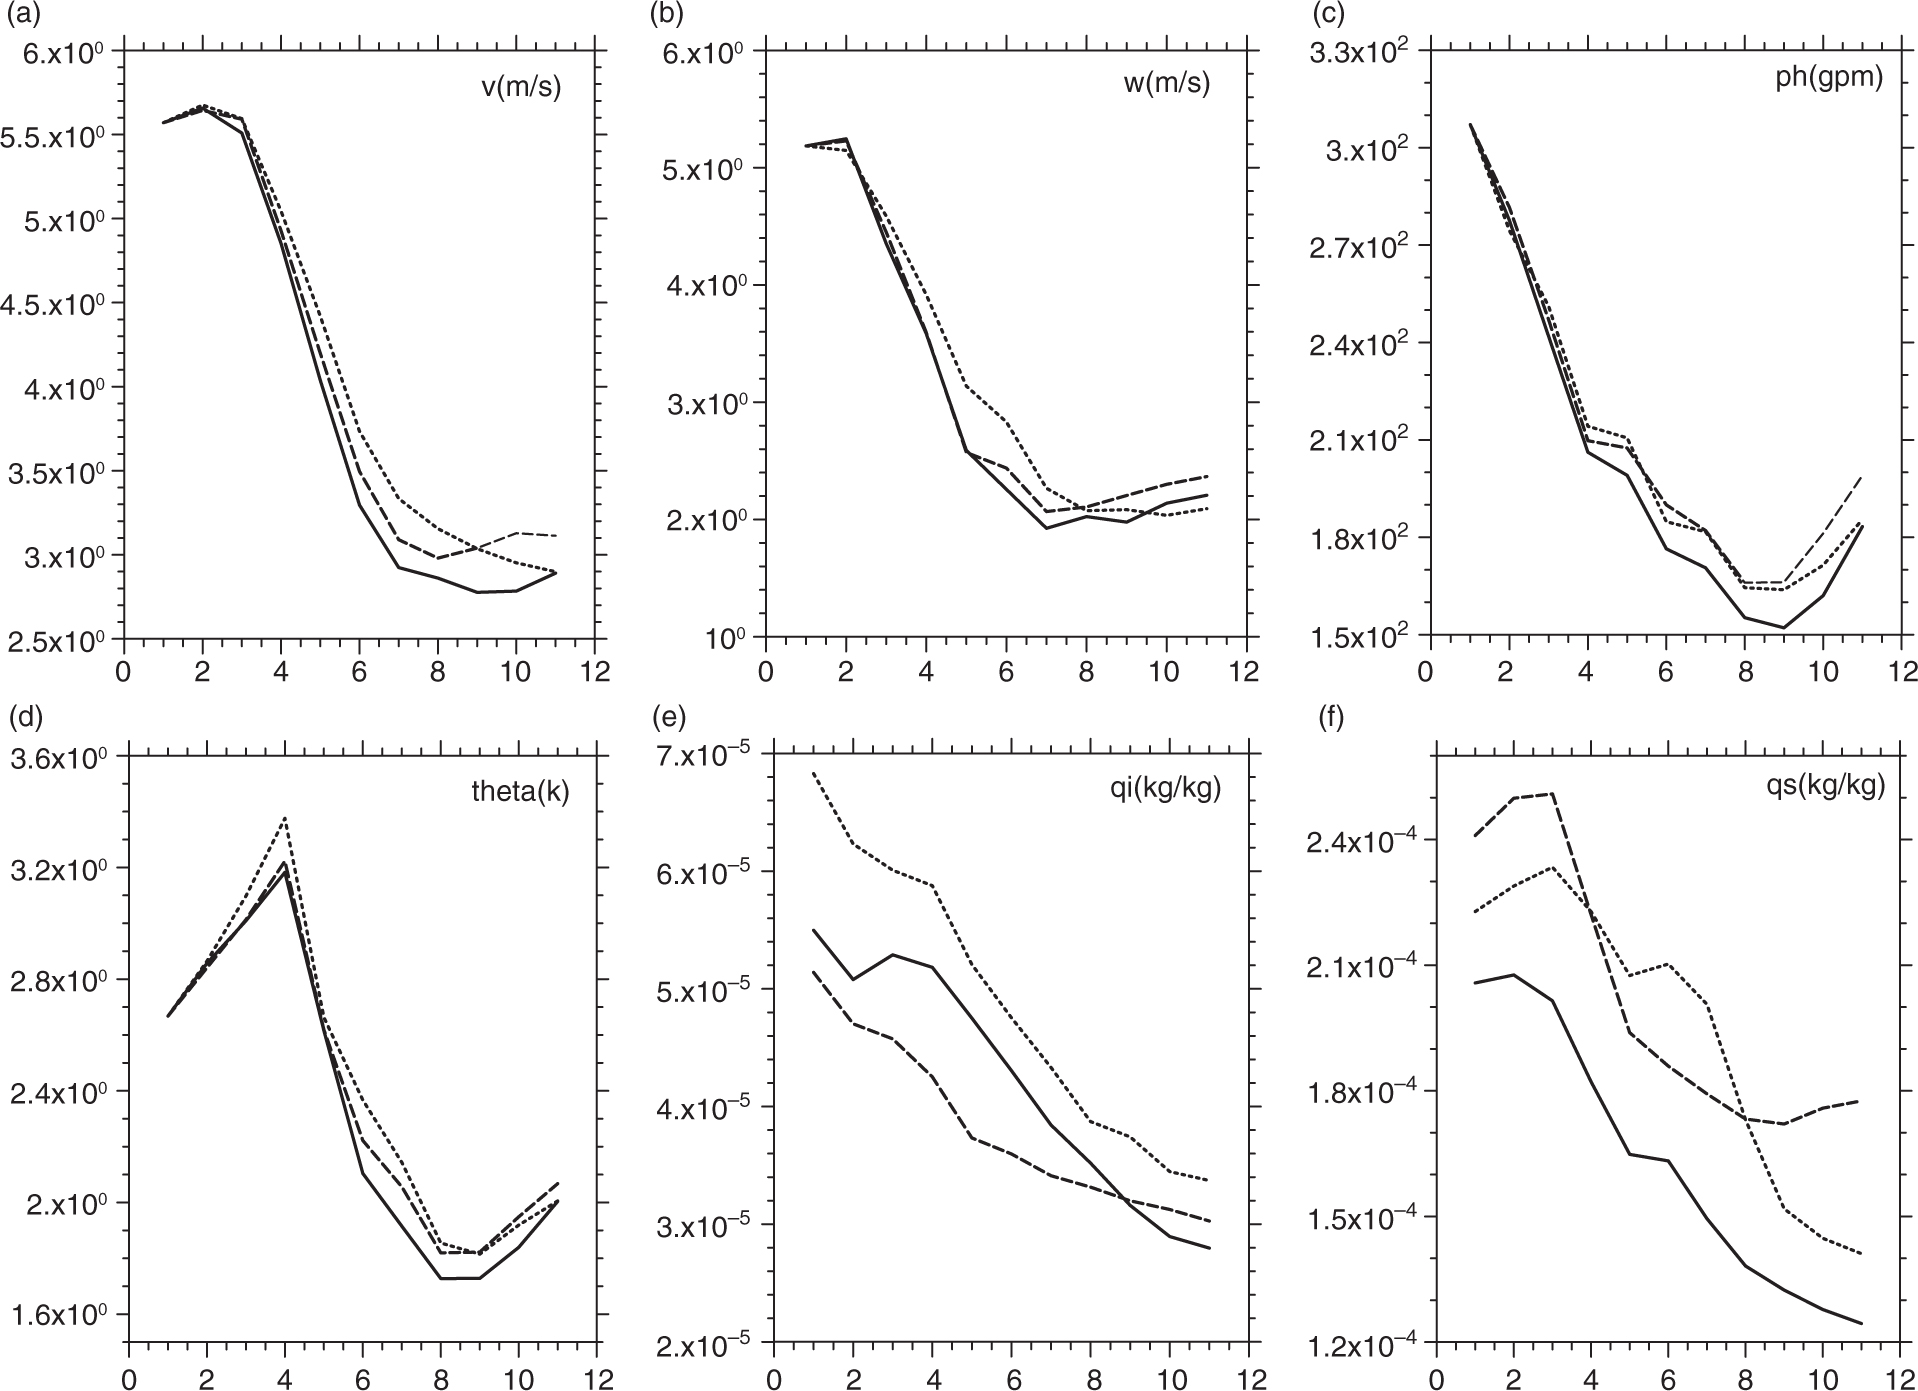
Fig. 4
The RMSE of velocity (a), vertical velocity (b), perturbation geopotential height (c), perturbation potential temperature (d), ice mixing ratio (e) and snow mixing ratio (f), averaged over points at which the reflectivity is greater than 10 dBZ, for Exp1 (dotted), Exp2 (solid) and Exp3 (dashed) (x-axis is assimilation step).
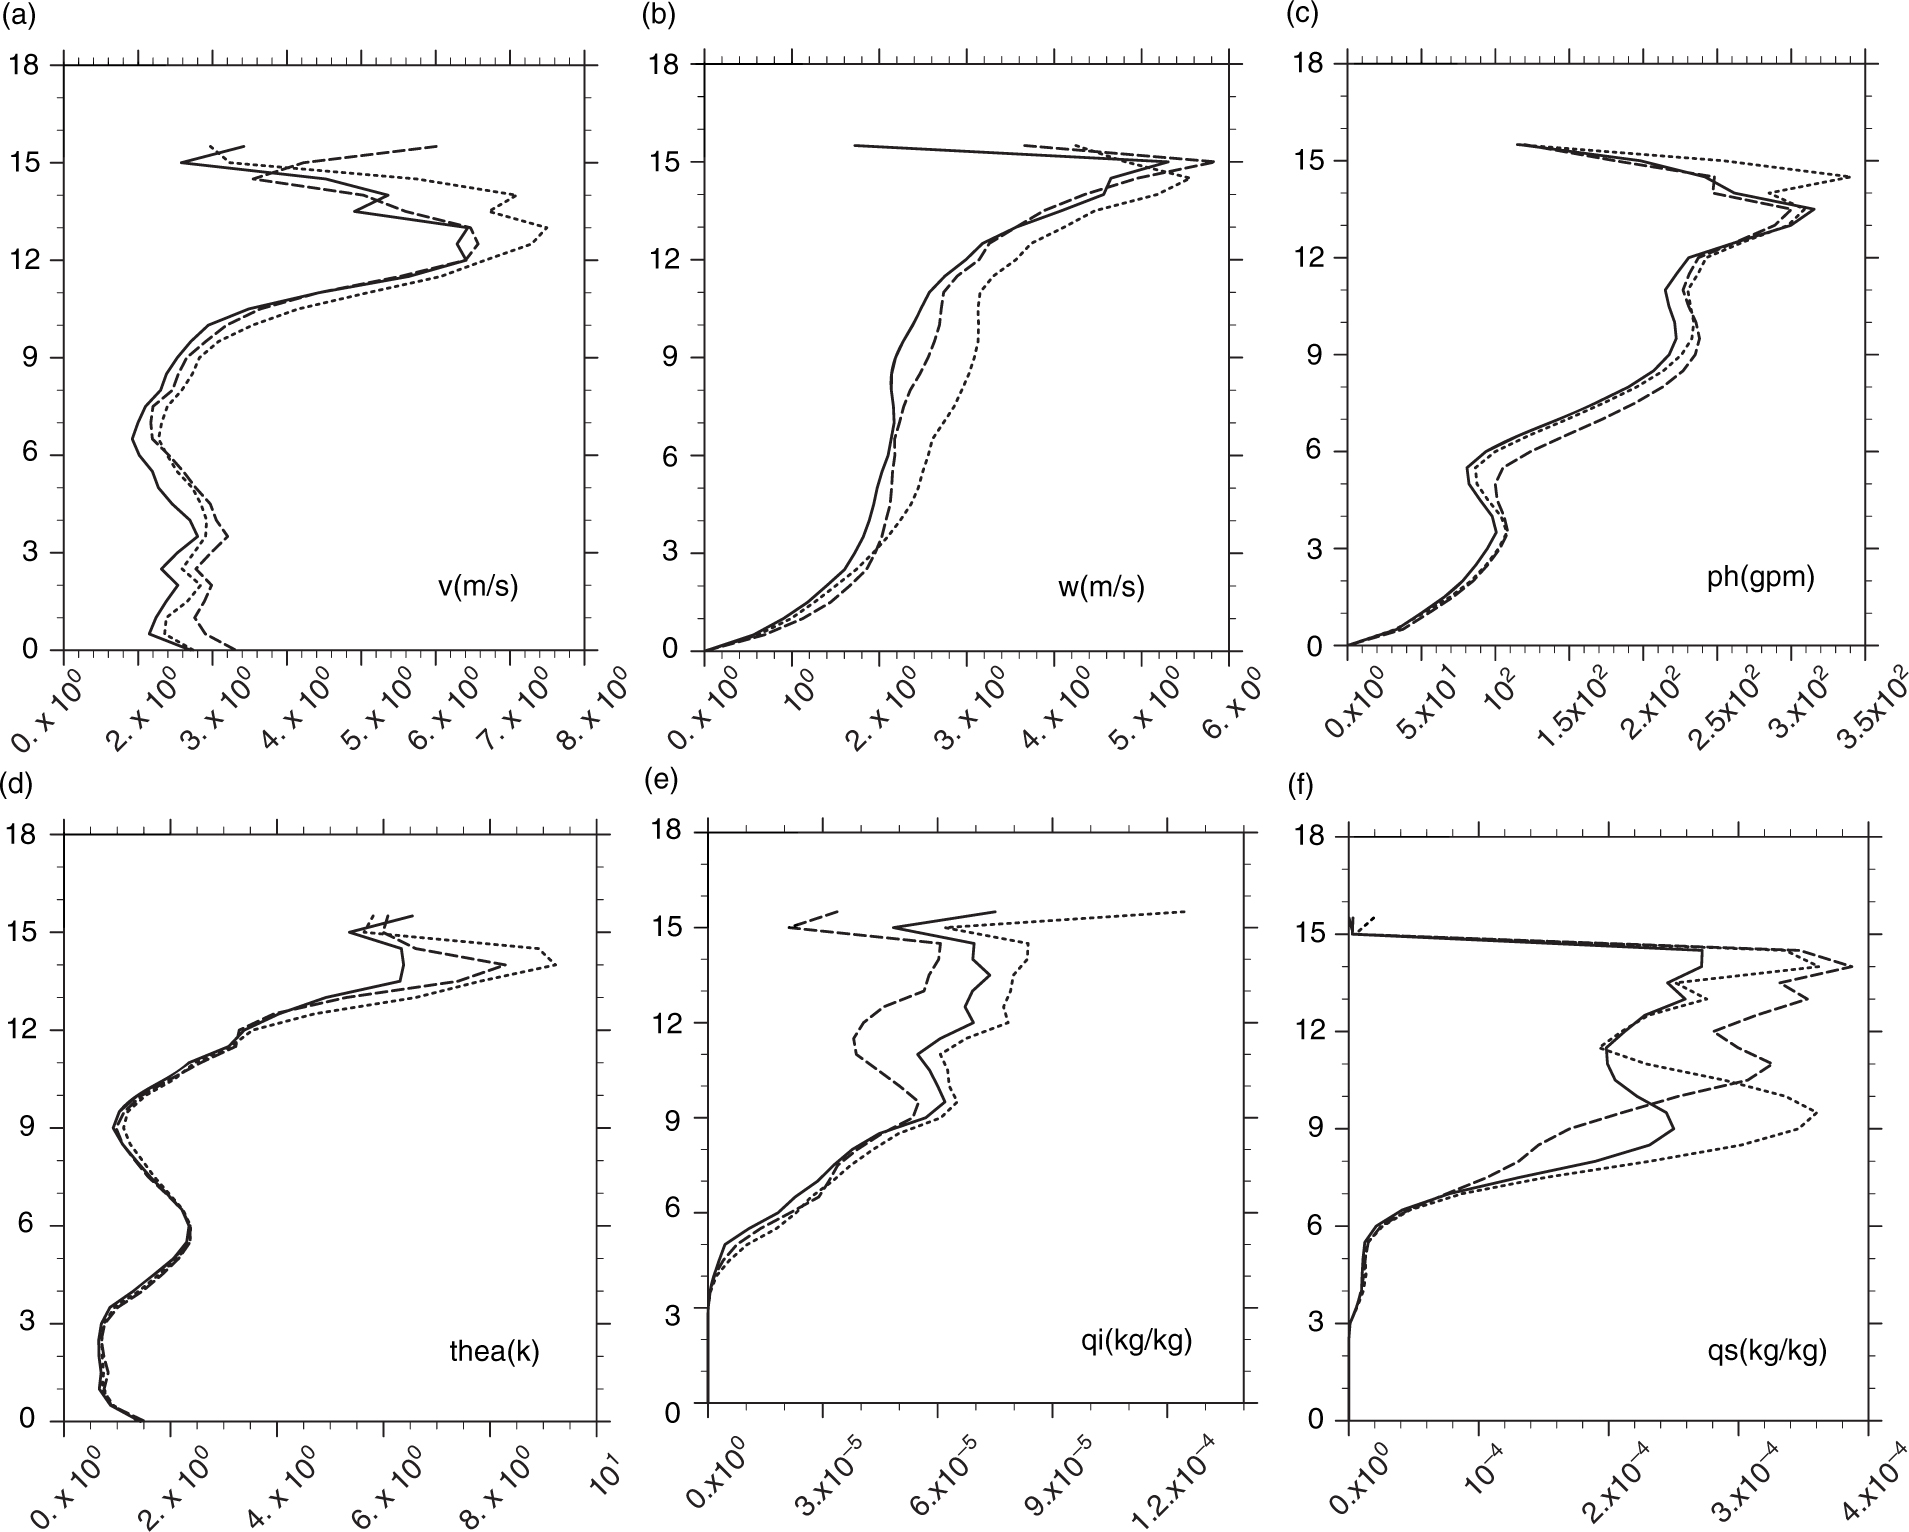
Fig. 5
Vertical profiles of RMSE at the 65th minute; Exp1 (dotted), Exp2 (solid) and Exp3 (dashed) (y-axis represents the height in km).
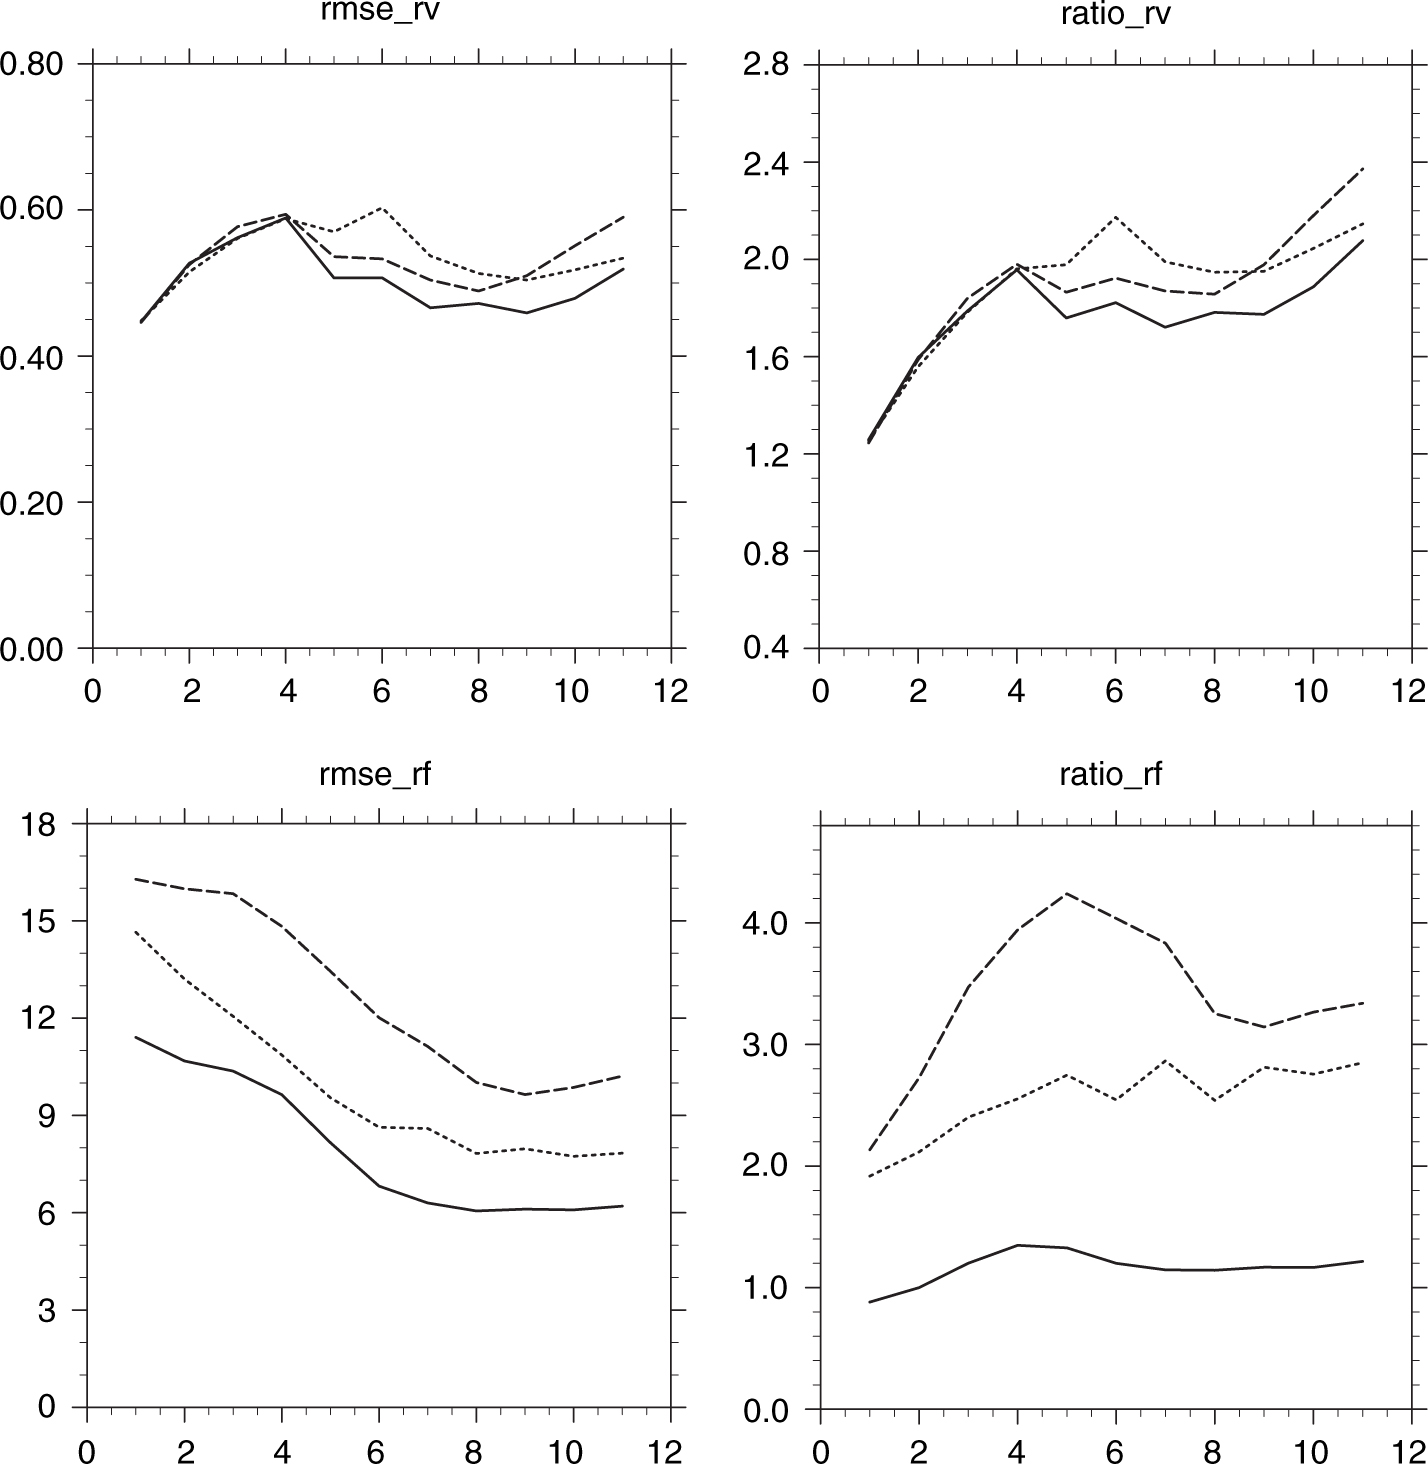
Fig. 6
The RMSE (left) and RR value (right) of radial velocity (top) and reflectivity (bottom); Exp1 (dotted), Exp2 (solid) and Exp3 (dashed) (x-axis is assimilation step).
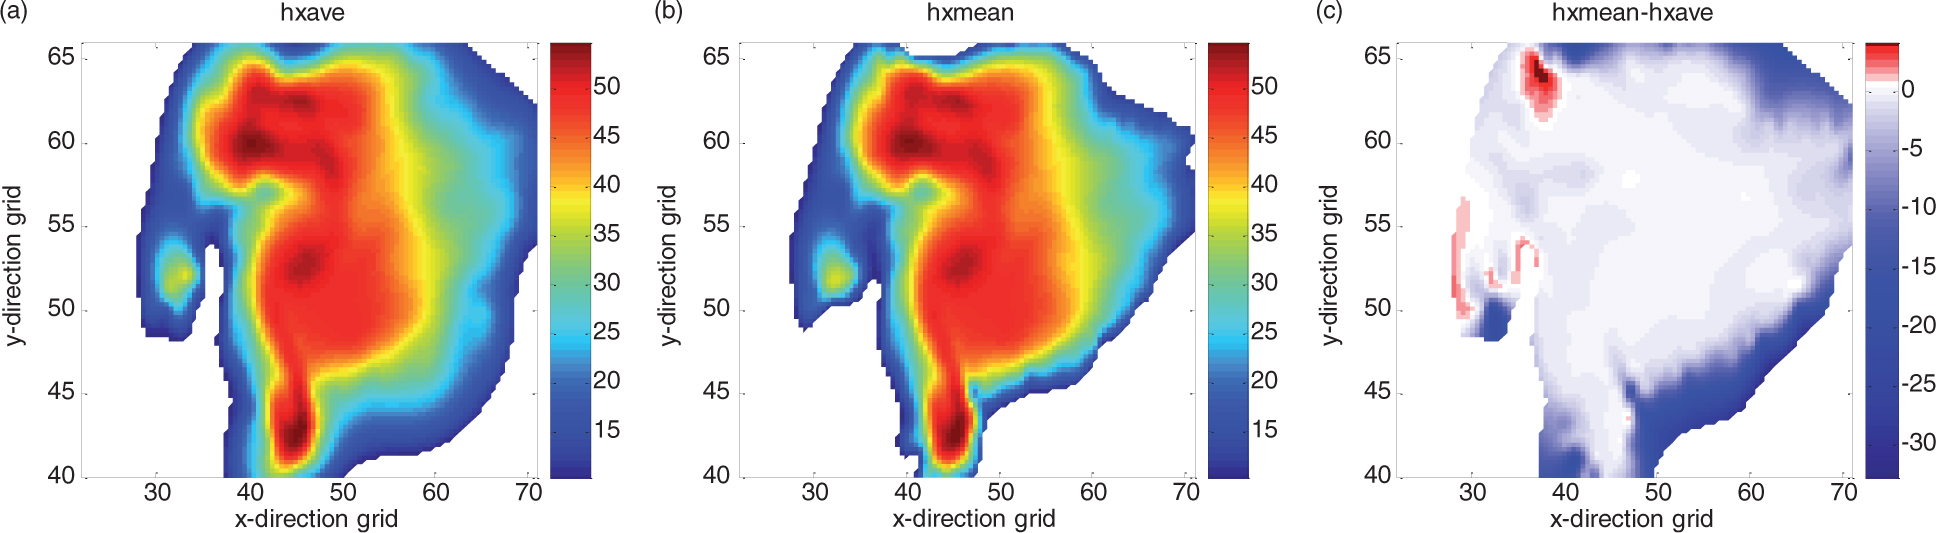
Fig. 7
For the first radar elevation, at the 90th minute, for areas with more than 10 dBZ observed: (a) the horizontal distribution of reflectivity , (b) the horizontal distribution of reflectivity , (c) the horizontal distribution of minus .
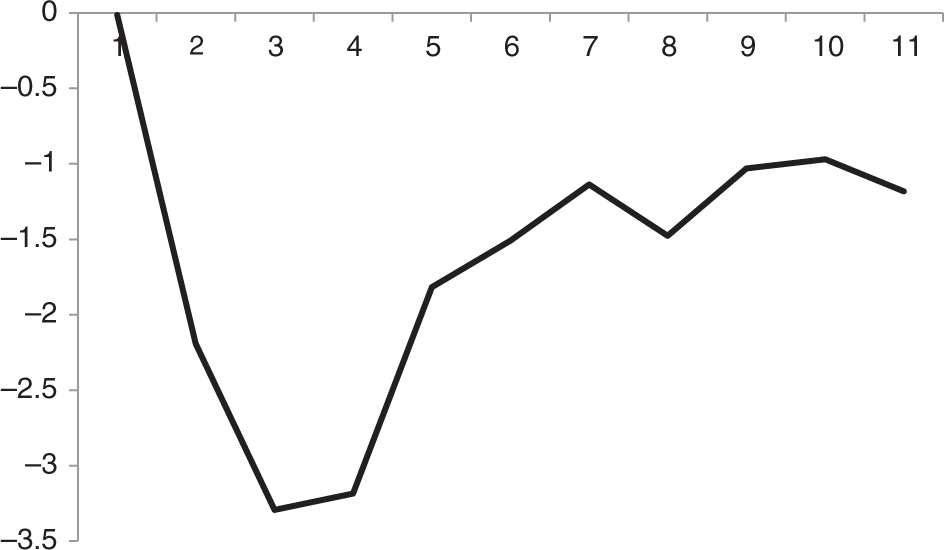
Fig. 8
The difference between and (x-axis is assimilation step).
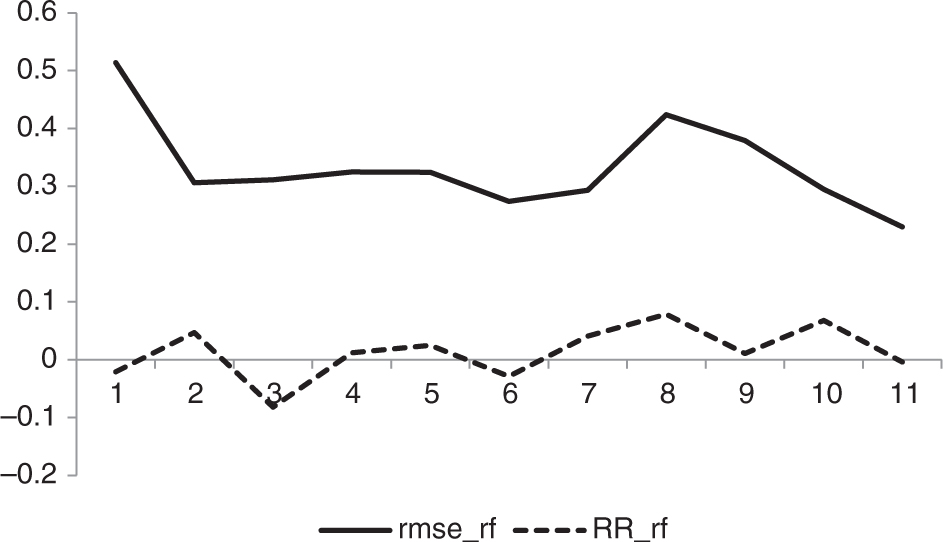
Fig. 9
The RMSE difference (solid line) and RR difference (dash line) for RF between Exp4 and Exp3 (x-axis is assimilation step).
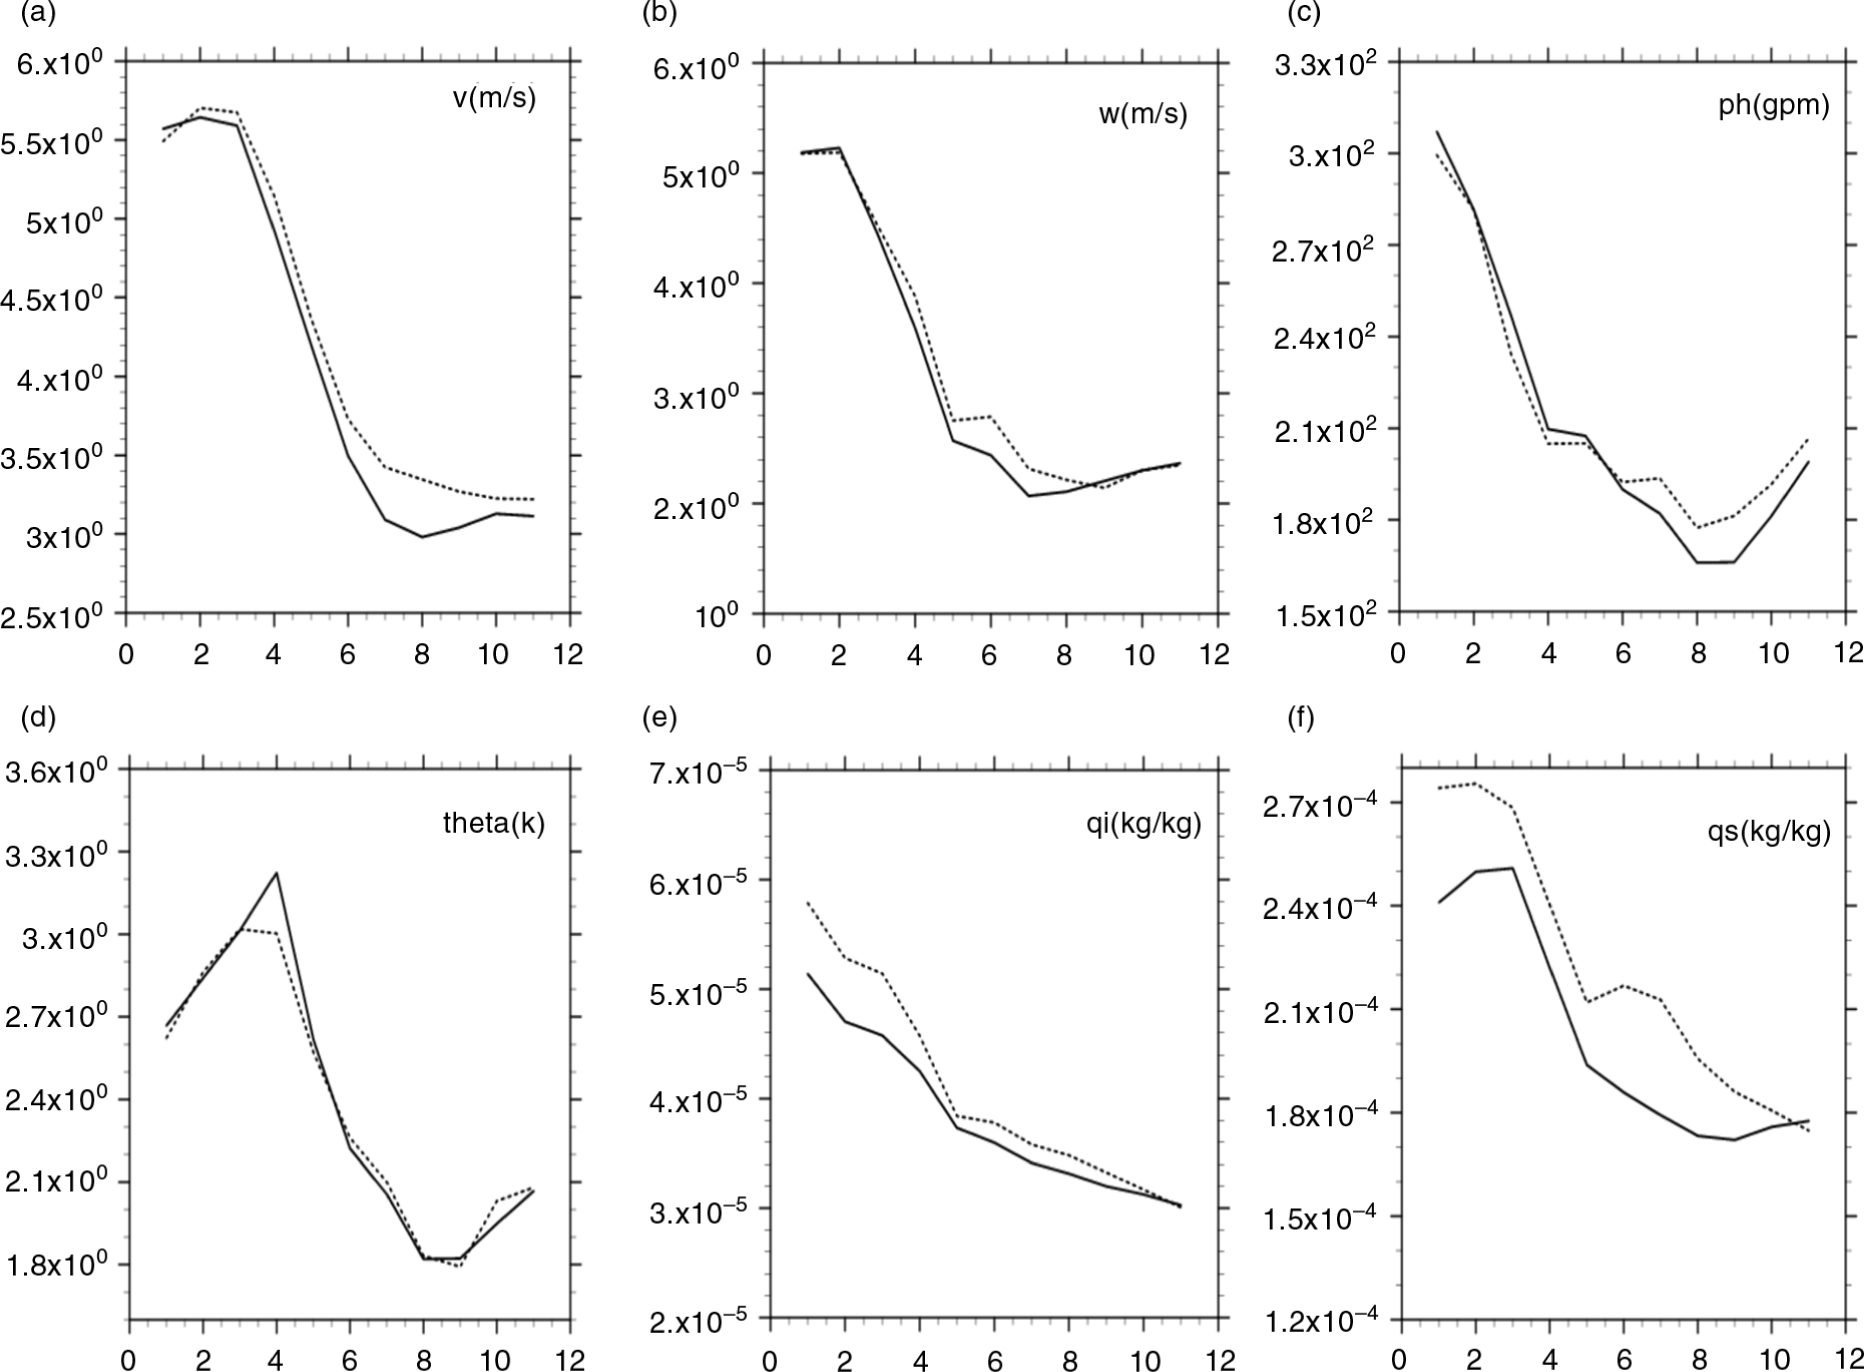
Fig. 10
The RMSE of velocity (a), vertical velocity (b), perturbation geopotential height (c), perturbation potential temperature (d), ice mixing ratio (e) and snow mixing ratio (f), averaged over points at which the reflectivity is greater than 10 dBZ, for Exp3 (solid) and Exp4 (dotted) (x-axis is assimilation step).