
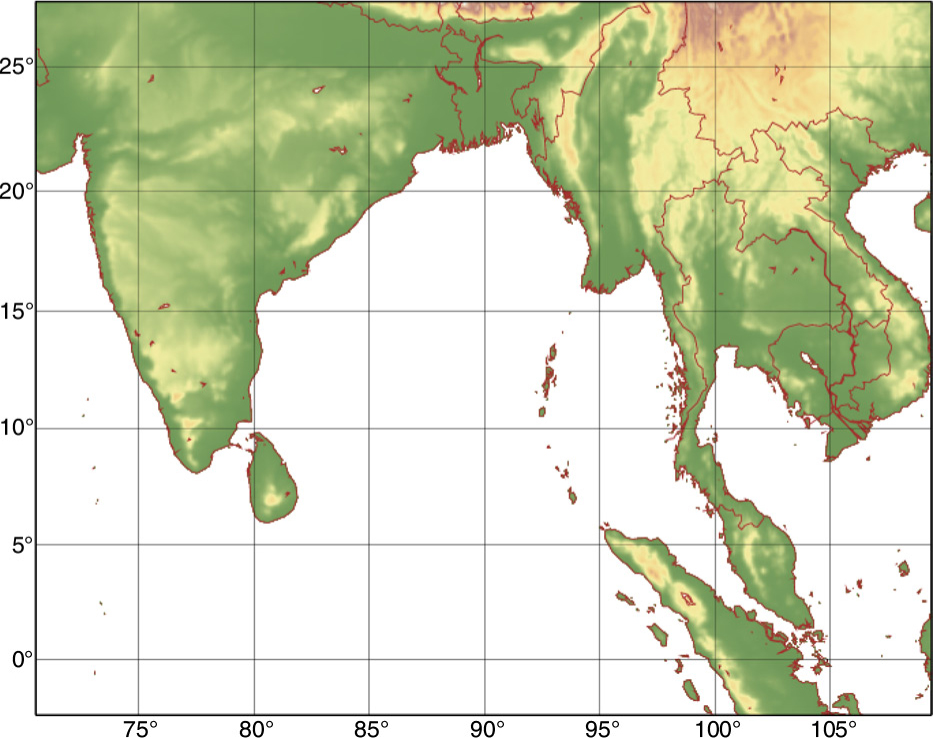
Fig. 1
Domain of all NHM–LETKF experiments and NHM extended forecasts.
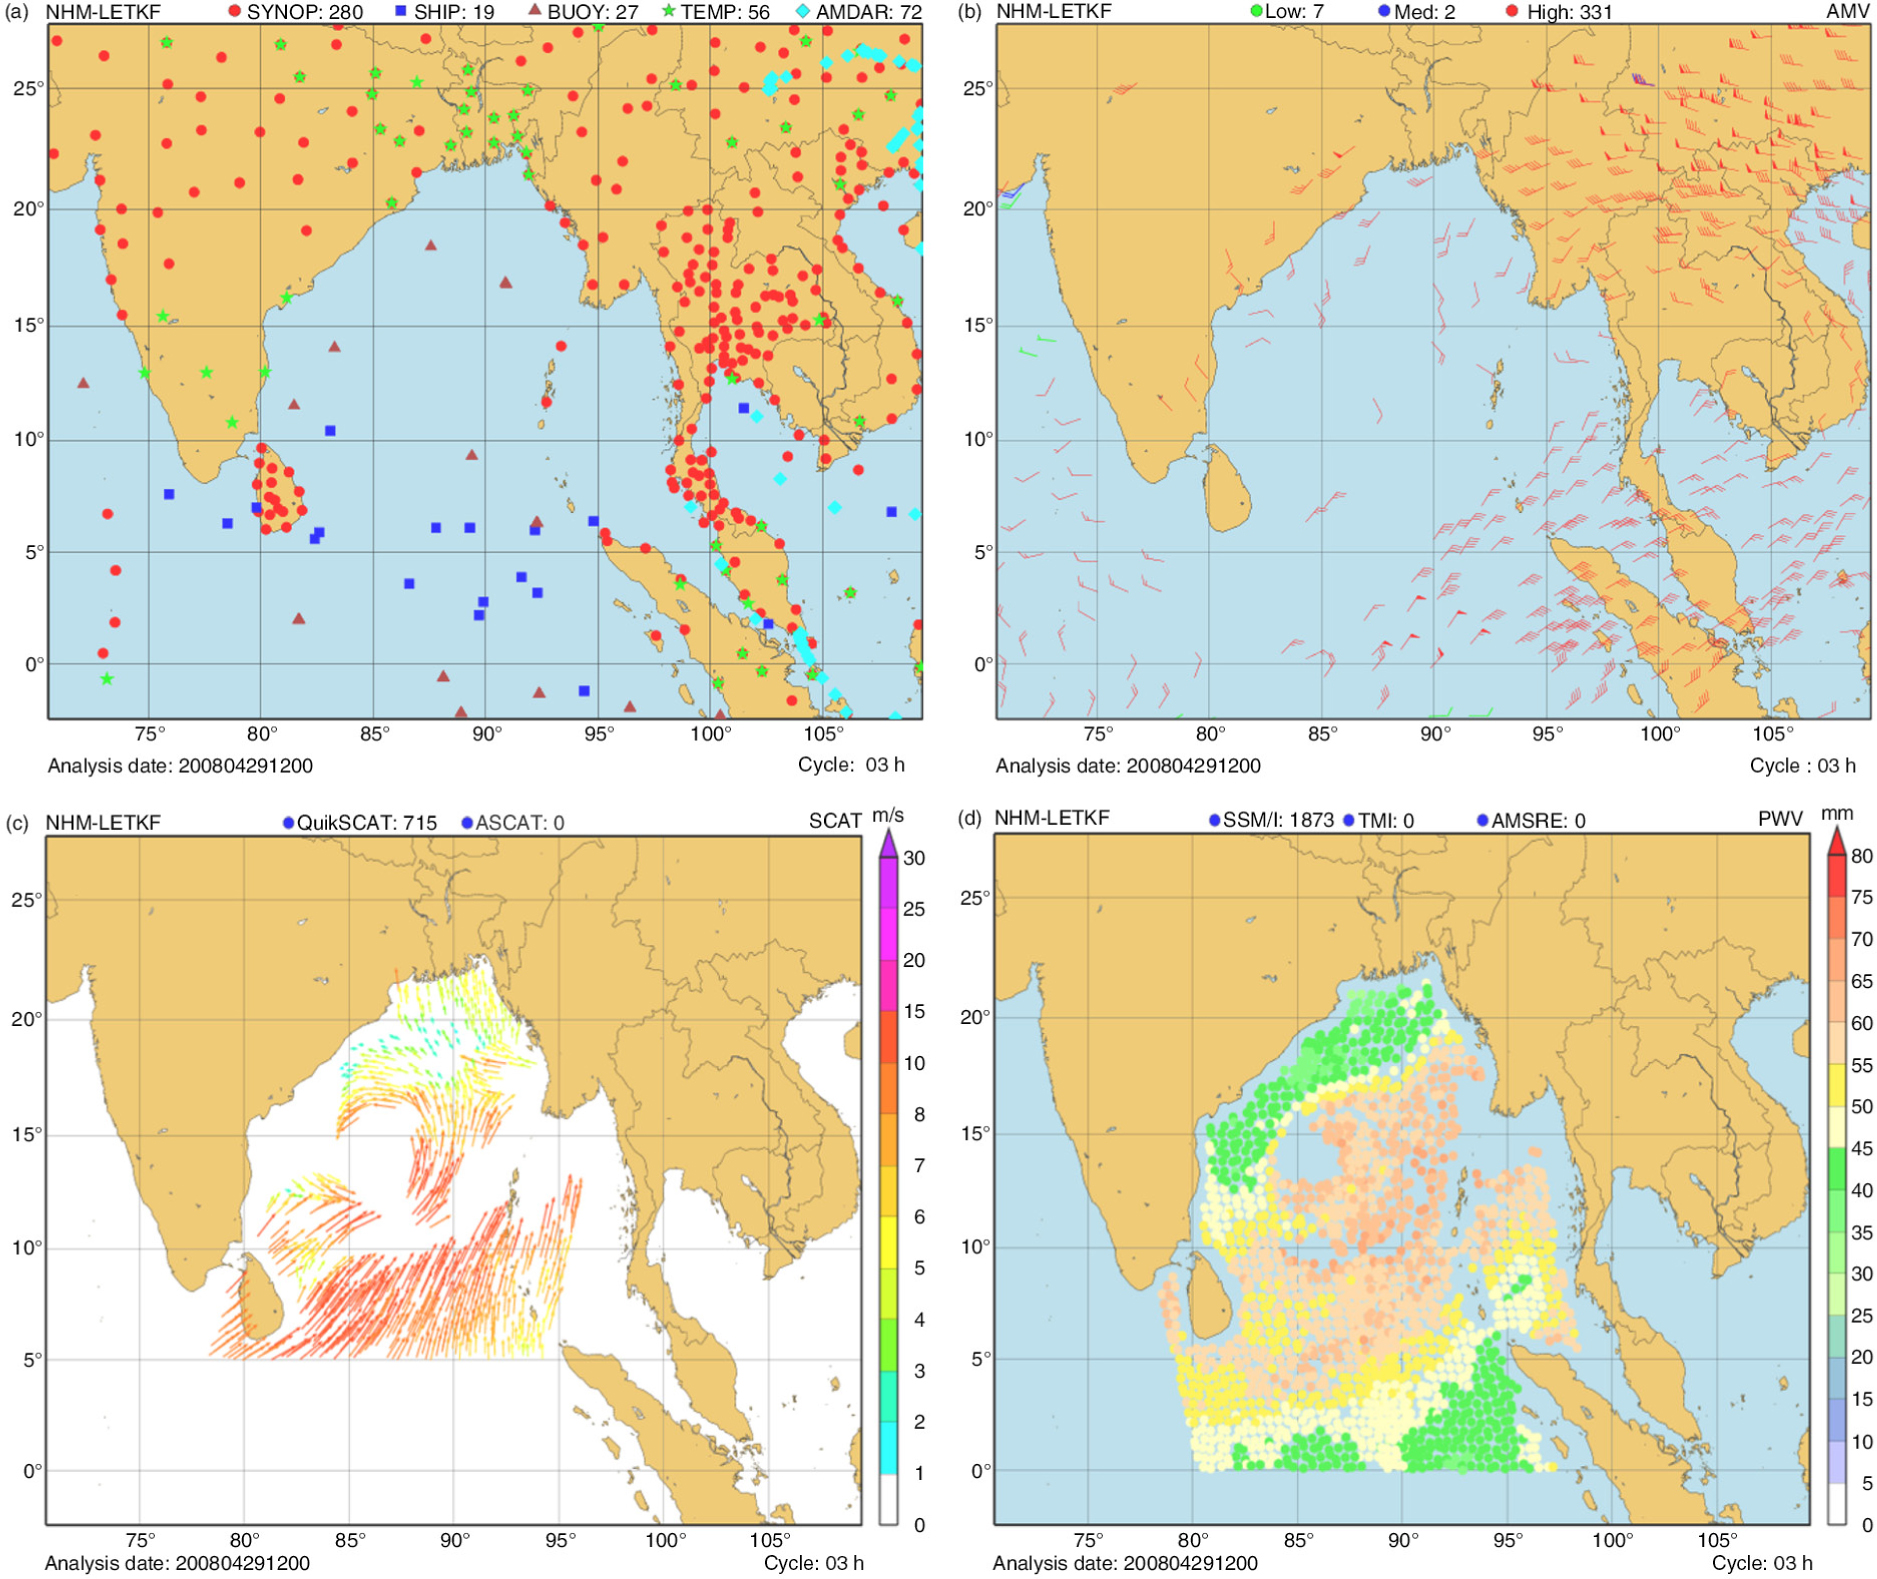
Fig. 2
Observations assimilated by NHM–LETKF at 12 UTC 29 April 2008: (a) conventional data, (b) AMVs, (c) sea winds and (d) precipitable water.
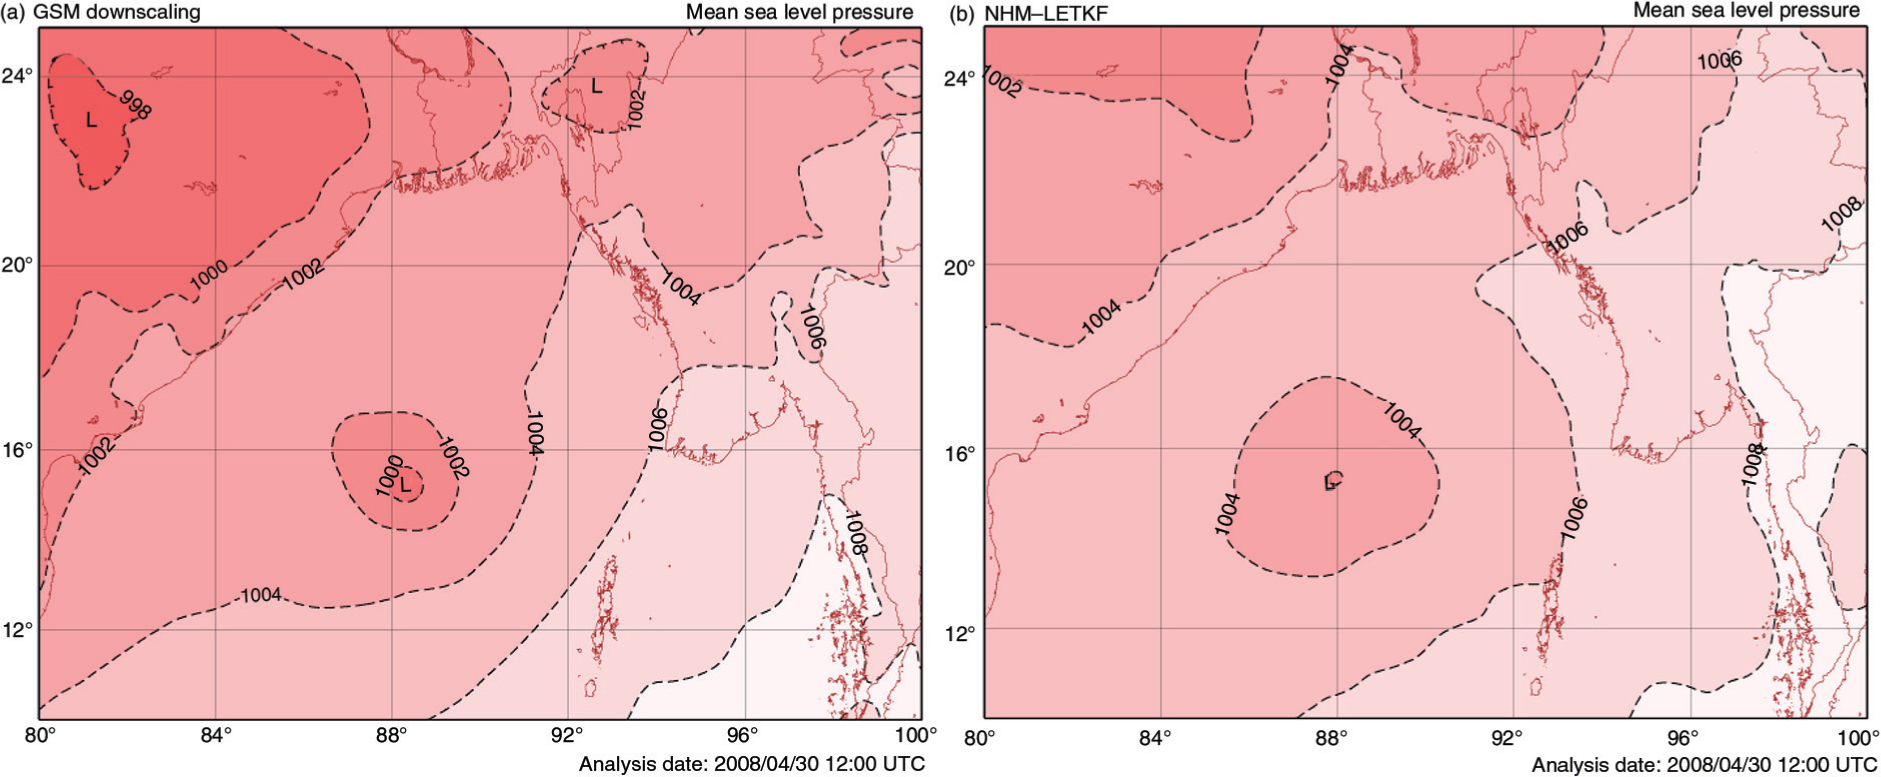
Fig. 3
Pmsl fields analysed by: (a) GSM and (b) NHM–LETKF at 12 UTC 30 April 2008 in the control experiment.
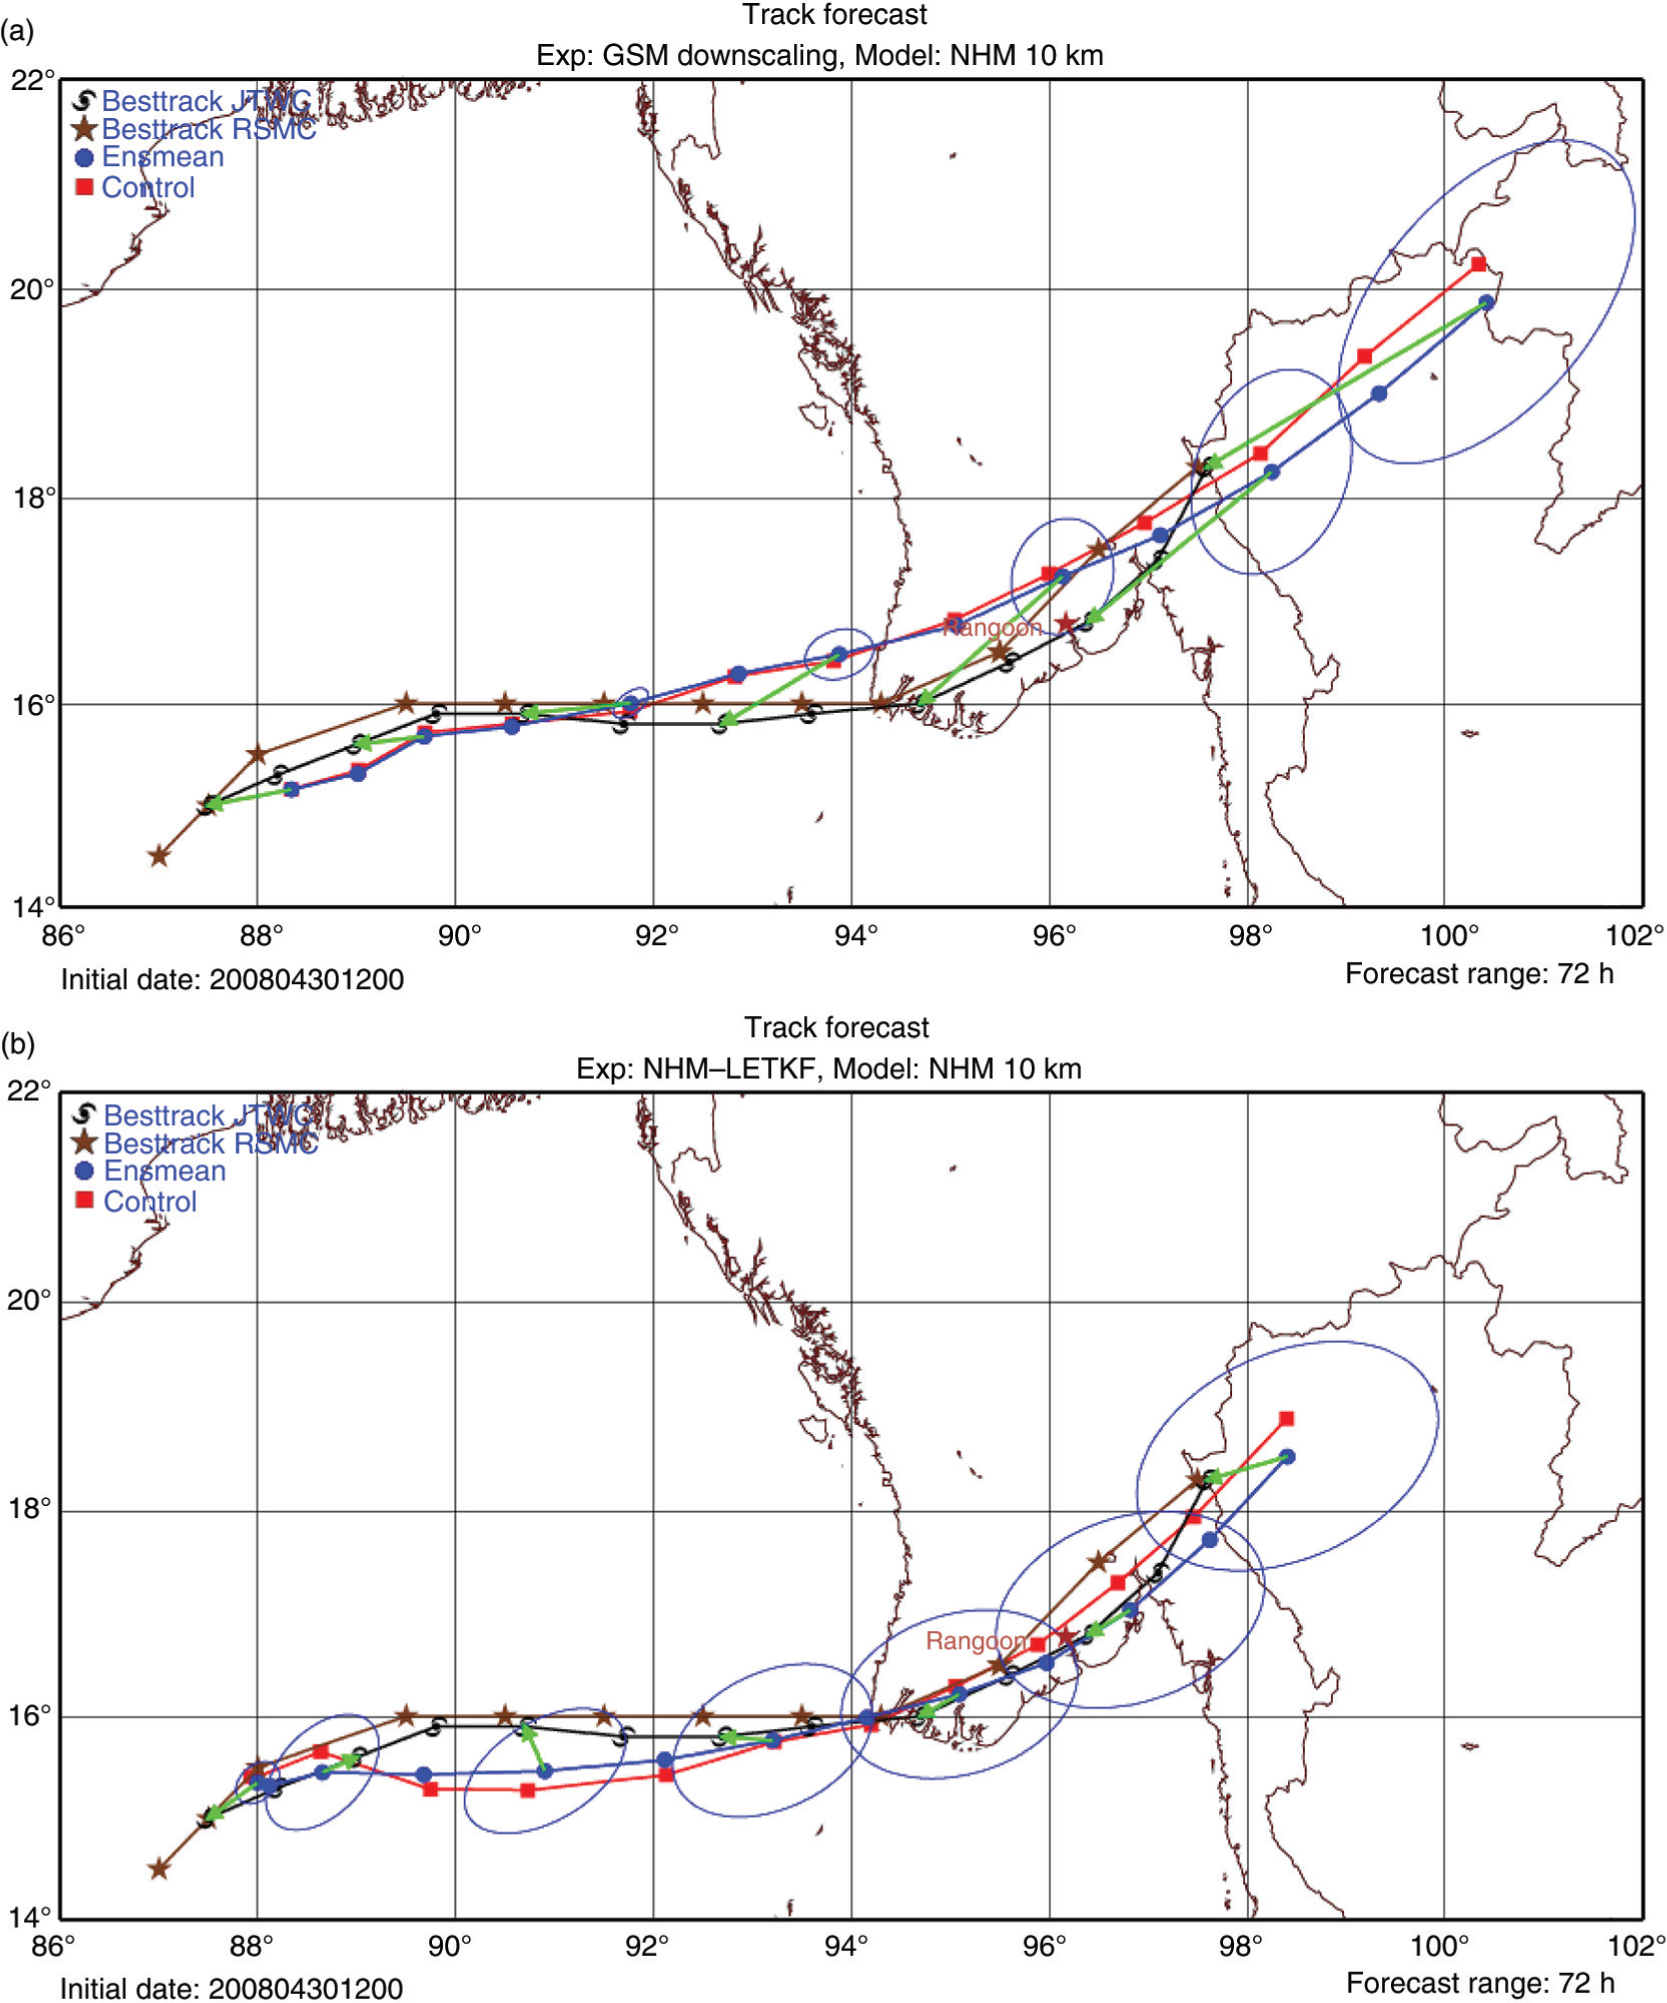
Fig. 4
The 72-hour forecasted tracks of Nargis initialised by: (a) GSM analysis and (b) NHM–LETKF analysis in the control experiment. The ellipses represent the forecast error covariances of TC positions (see Section 2.4 for more details).
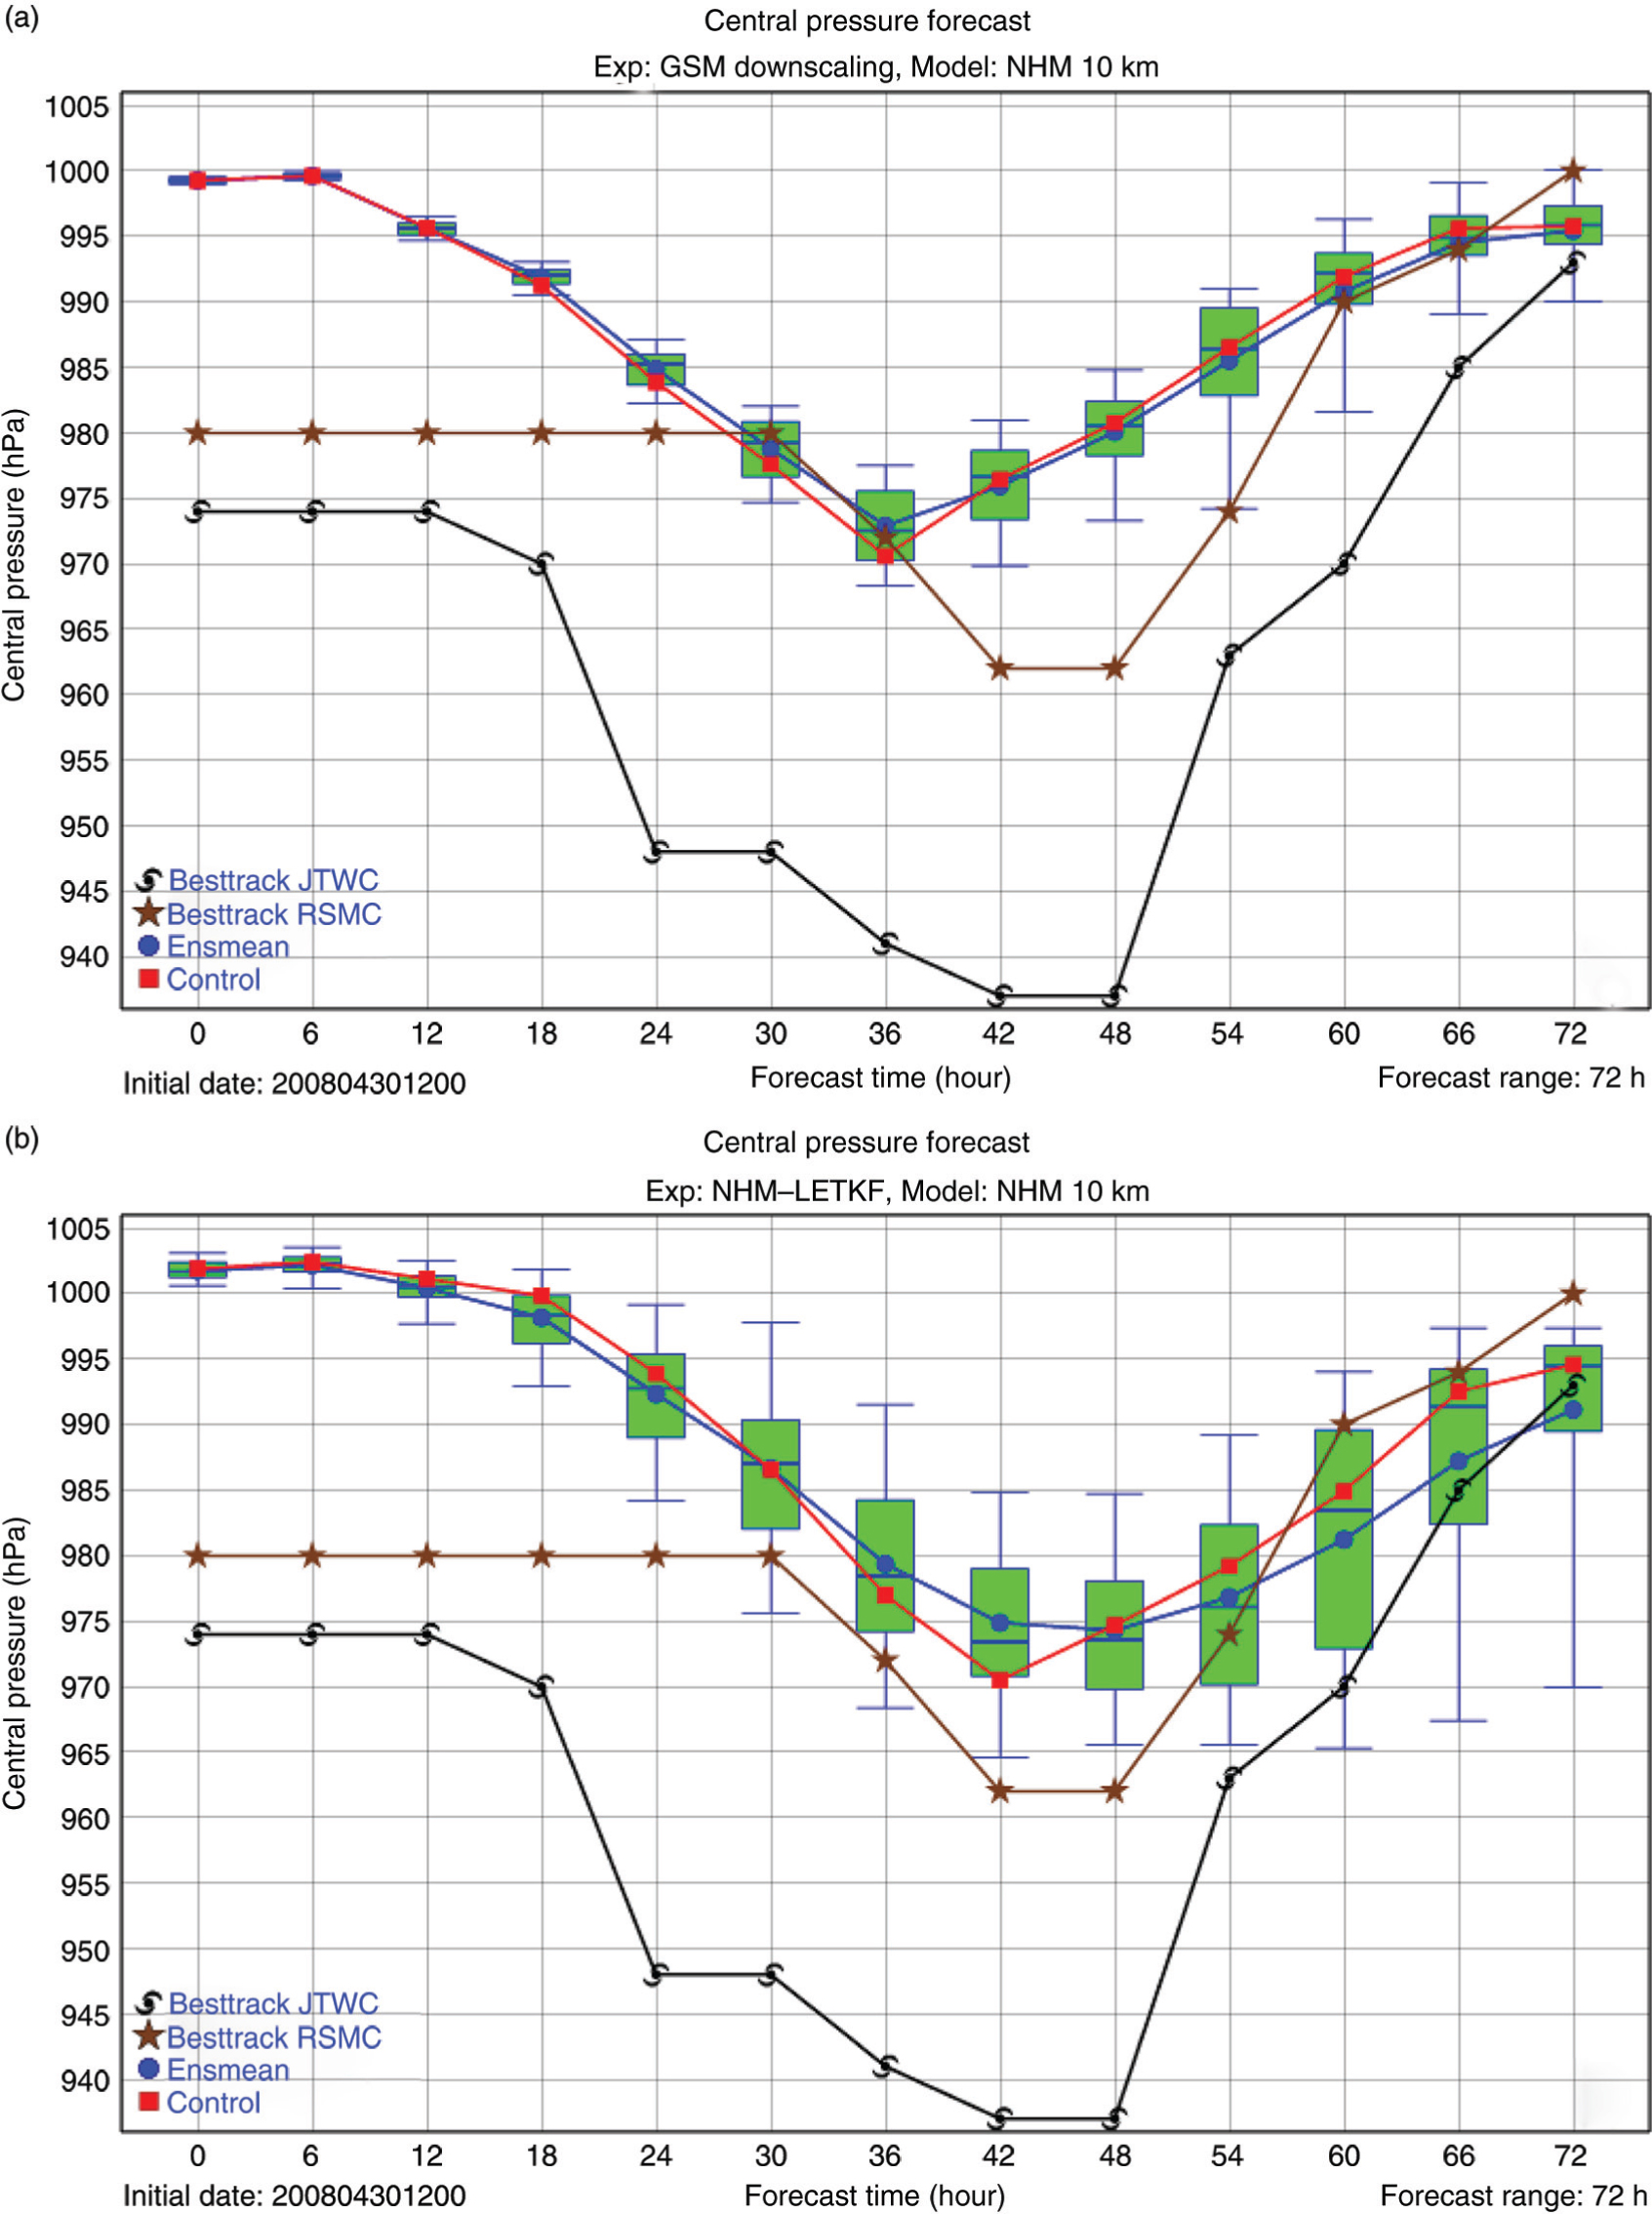
Fig. 5
As Fig. 4 but for the forecasted intensities. The ends of the whiskers represent the 5th and 95th percentiles.
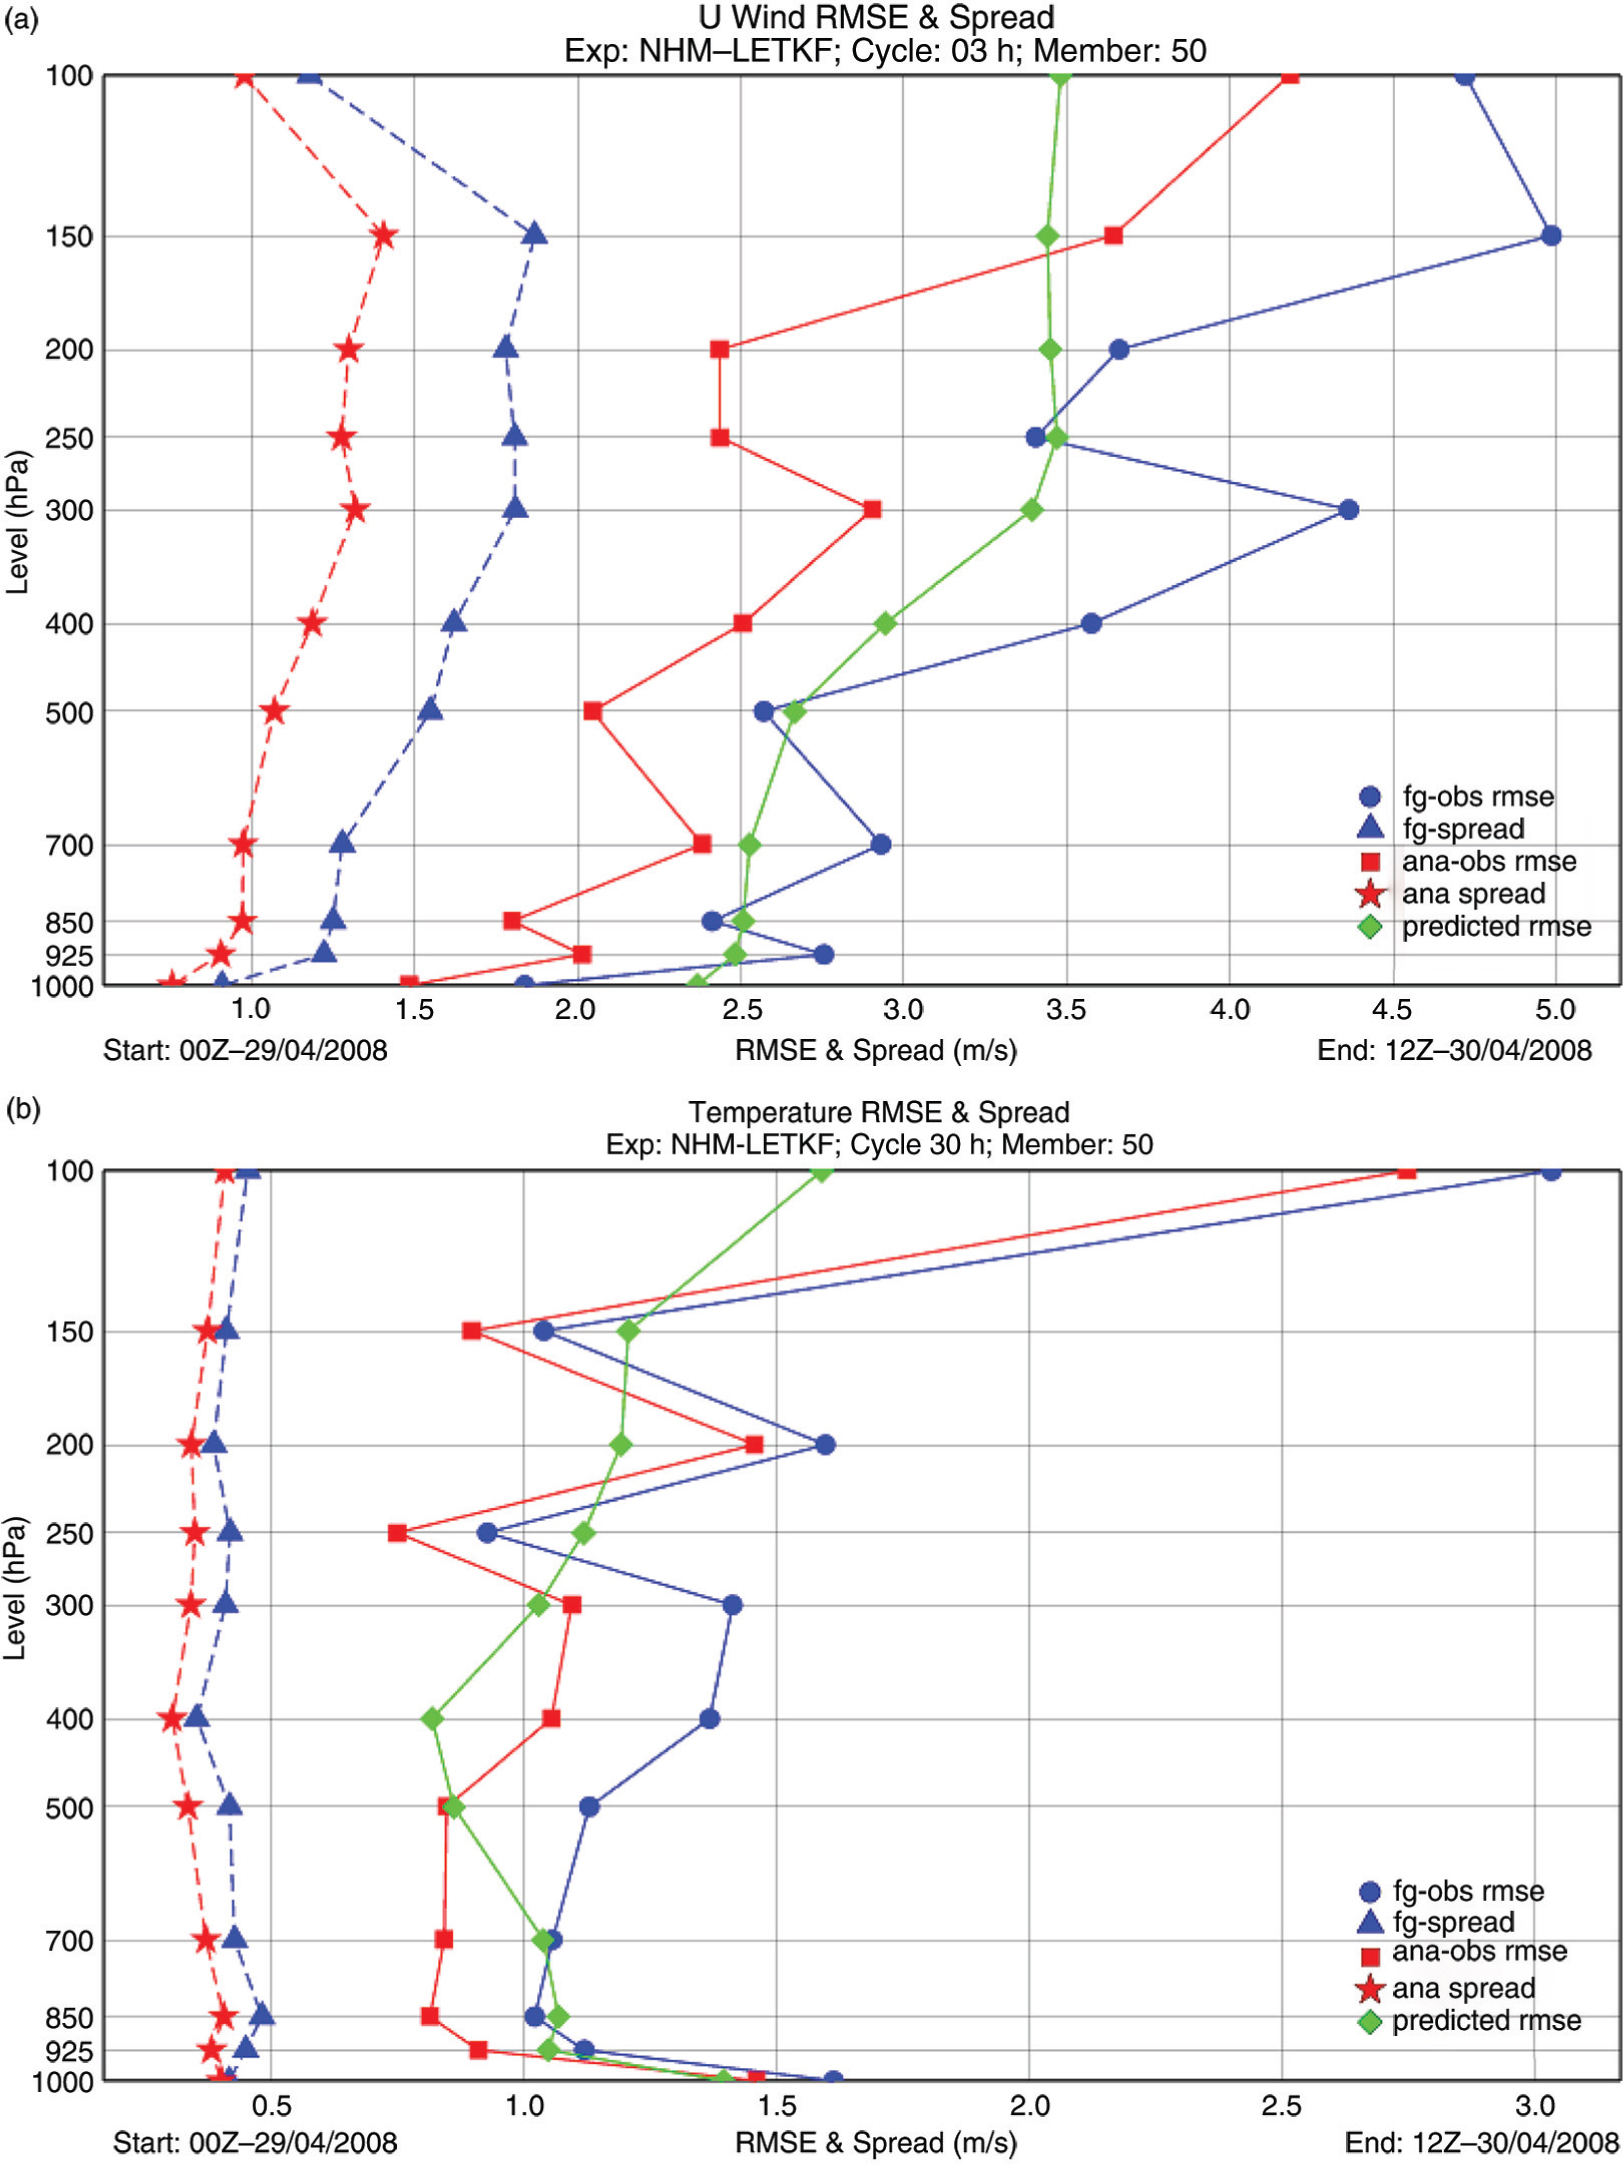
Fig. 6
Diagnostic analysis of NHM–LETKF in the control experiment: (a) zonal wind u and (b) temperature. The solid lines denote the RMSEs and the dash lines denote the spreads.
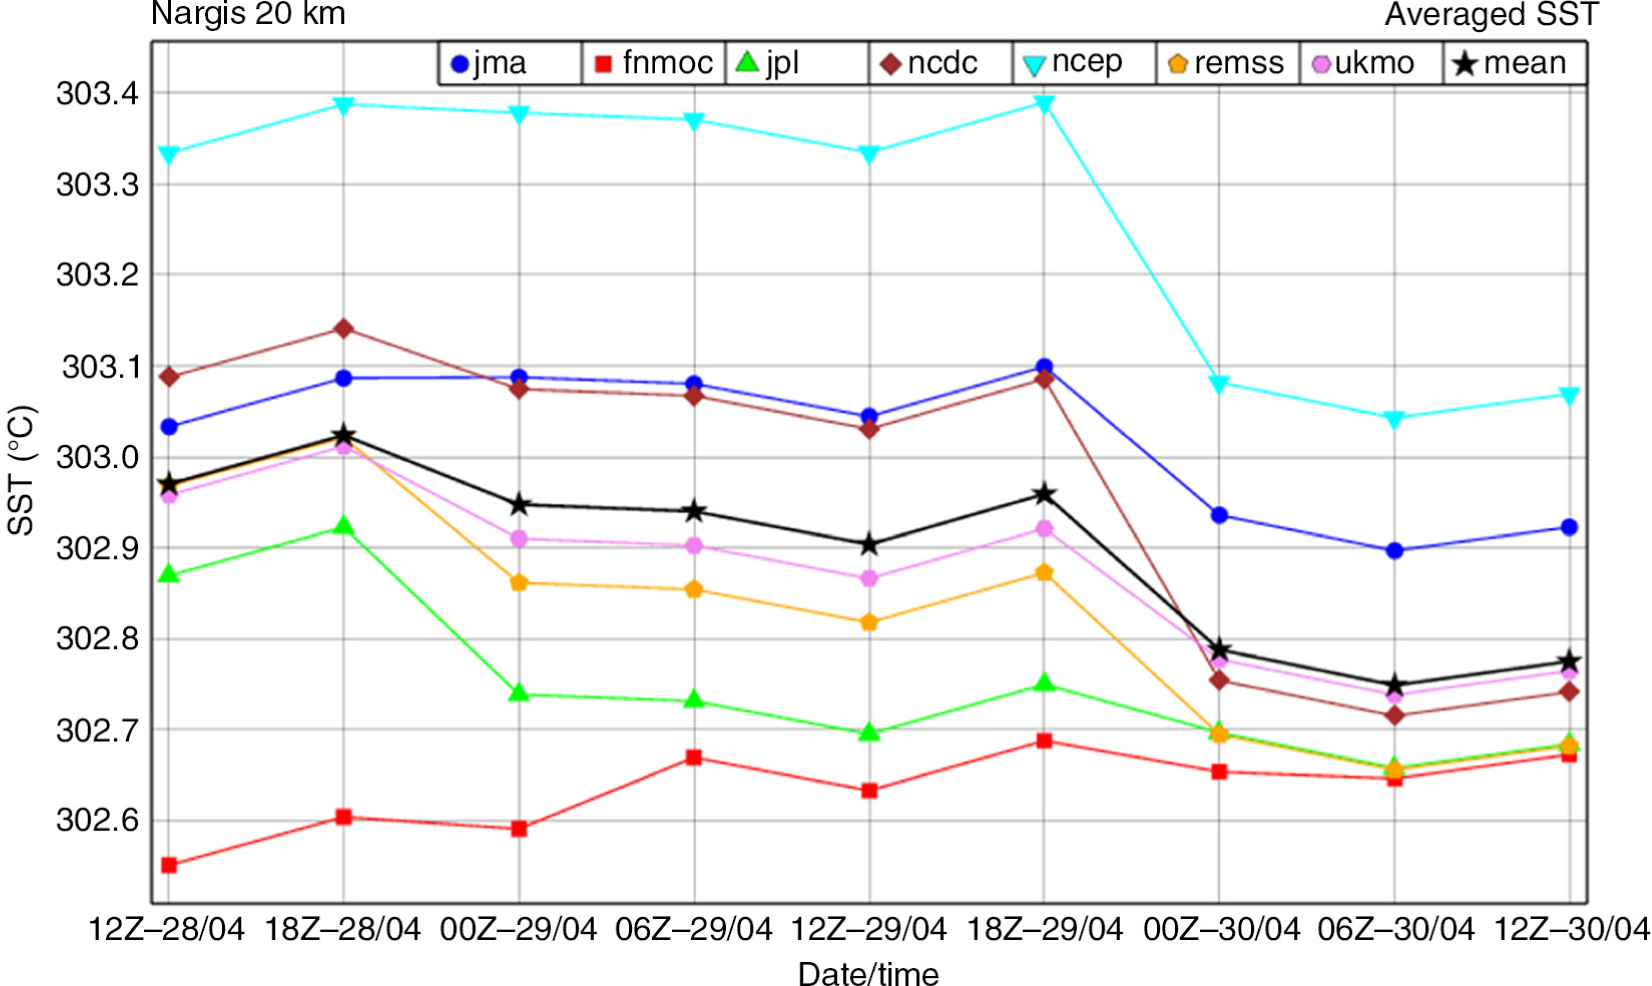
Fig. 7
Time series of SSTs averaged over the Indian Ocean from different centres in the 2-d assimilation period.
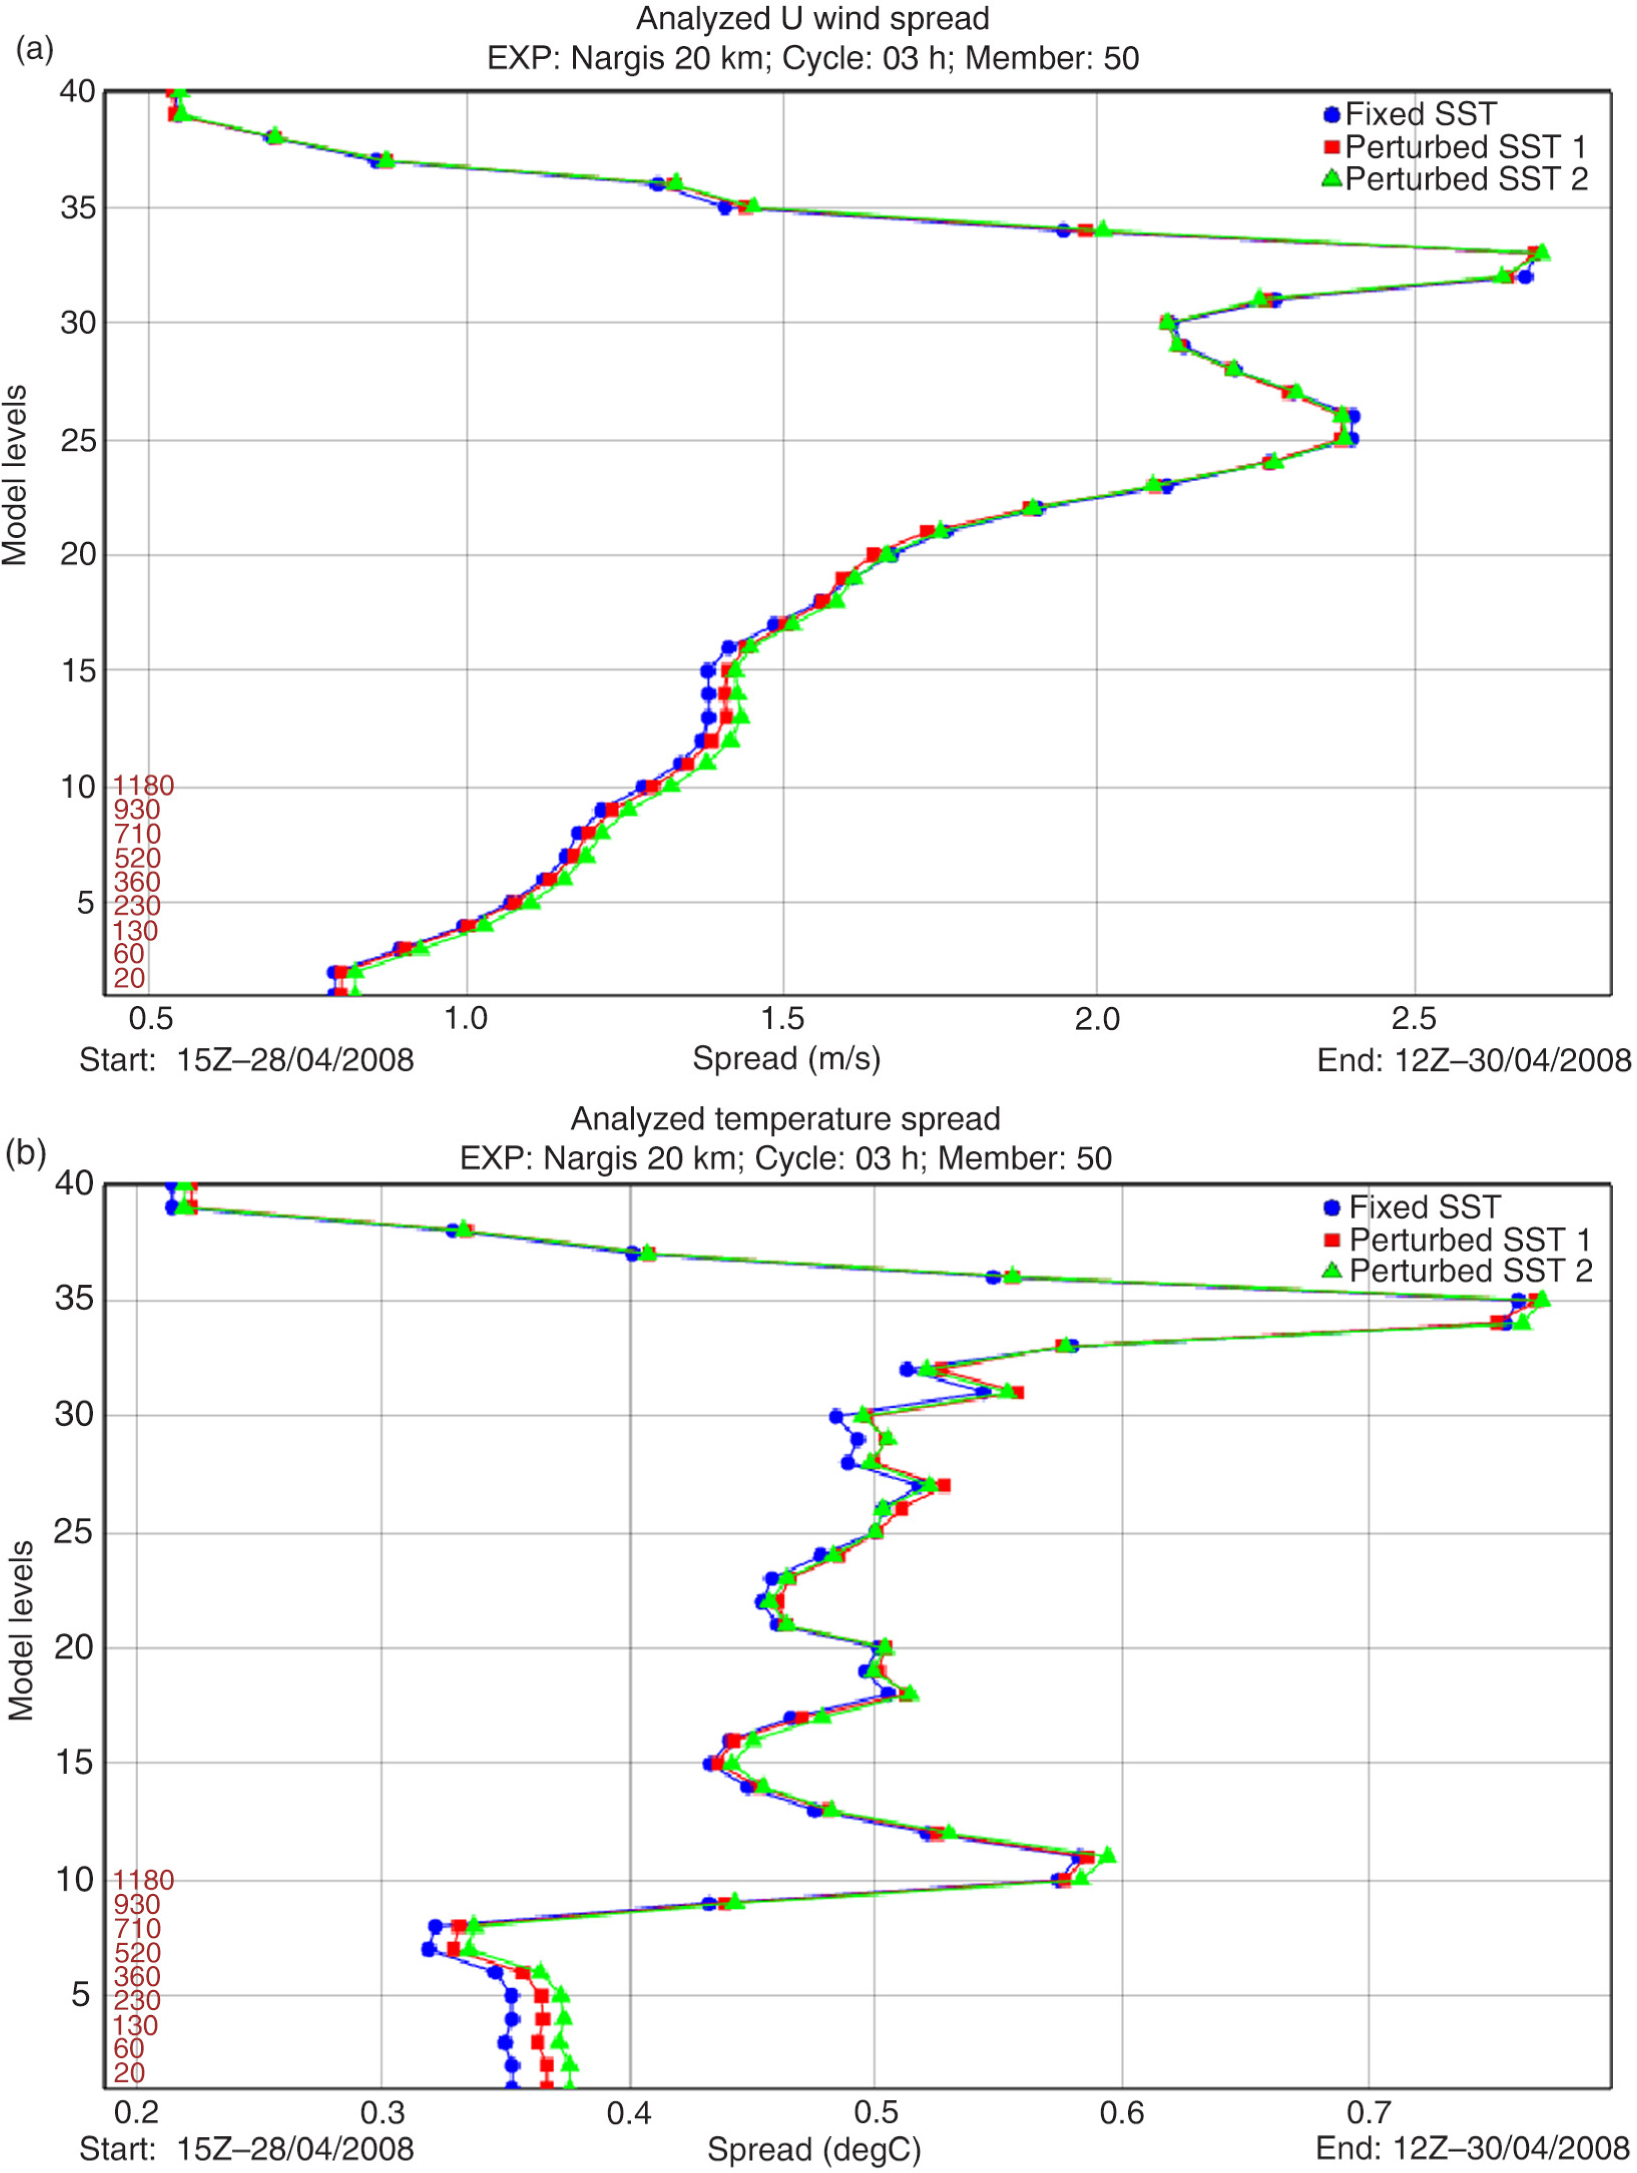
Fig. 8
Diagnostic analysis of NHM–LETKF when using fixed and perturbed SSTs: (a) zonal wind u and (b) temperature. Verification was only performed over ocean grid points. The numbers at the left-bottom corner indicate the heights (in meters) of the nine lowest model levels when the ground is 0 m.
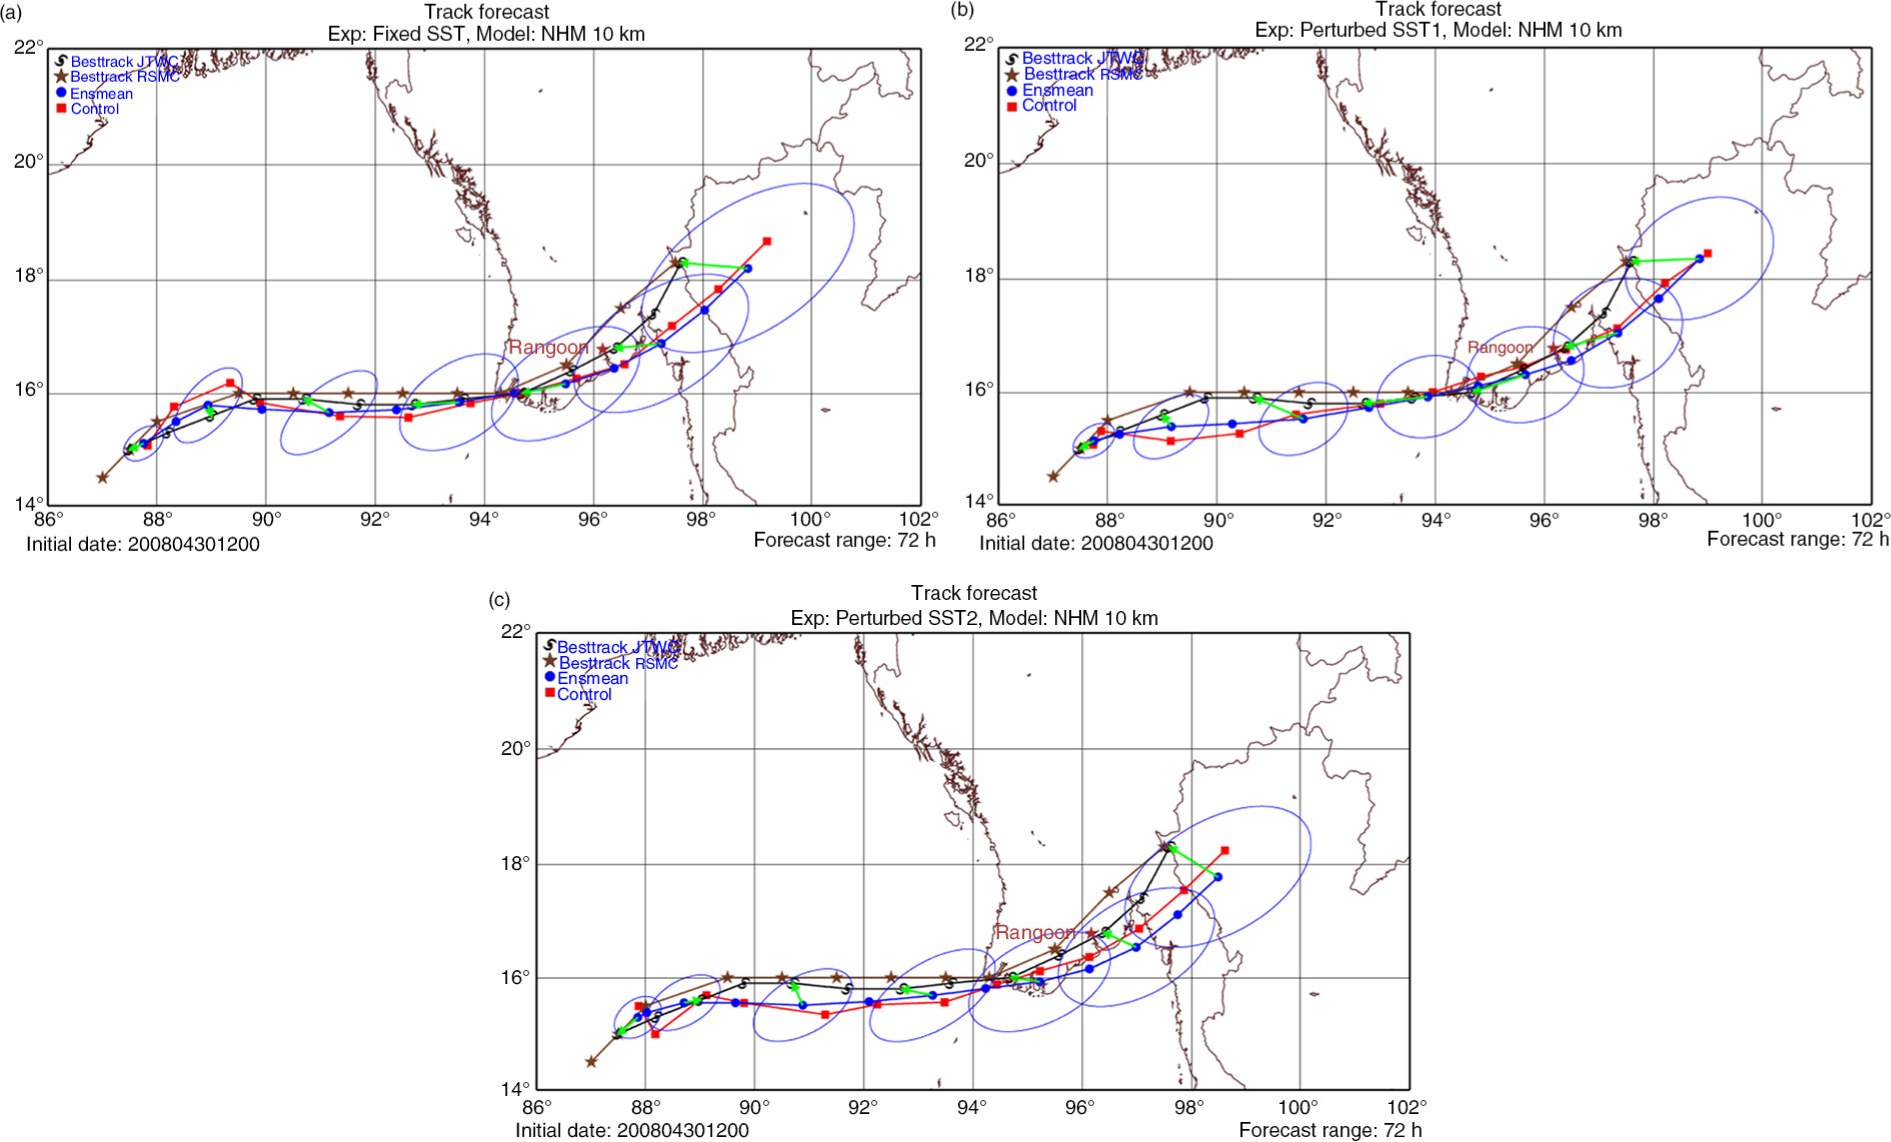
Fig. 9
The 72-hour forecasted tracks of Nargis when NHM–LETKF used: (a) fixed SSTs and perturbed SSTs in two different sampling methods, (b) perturbed SST 1 and (c) perturbed SST 2.
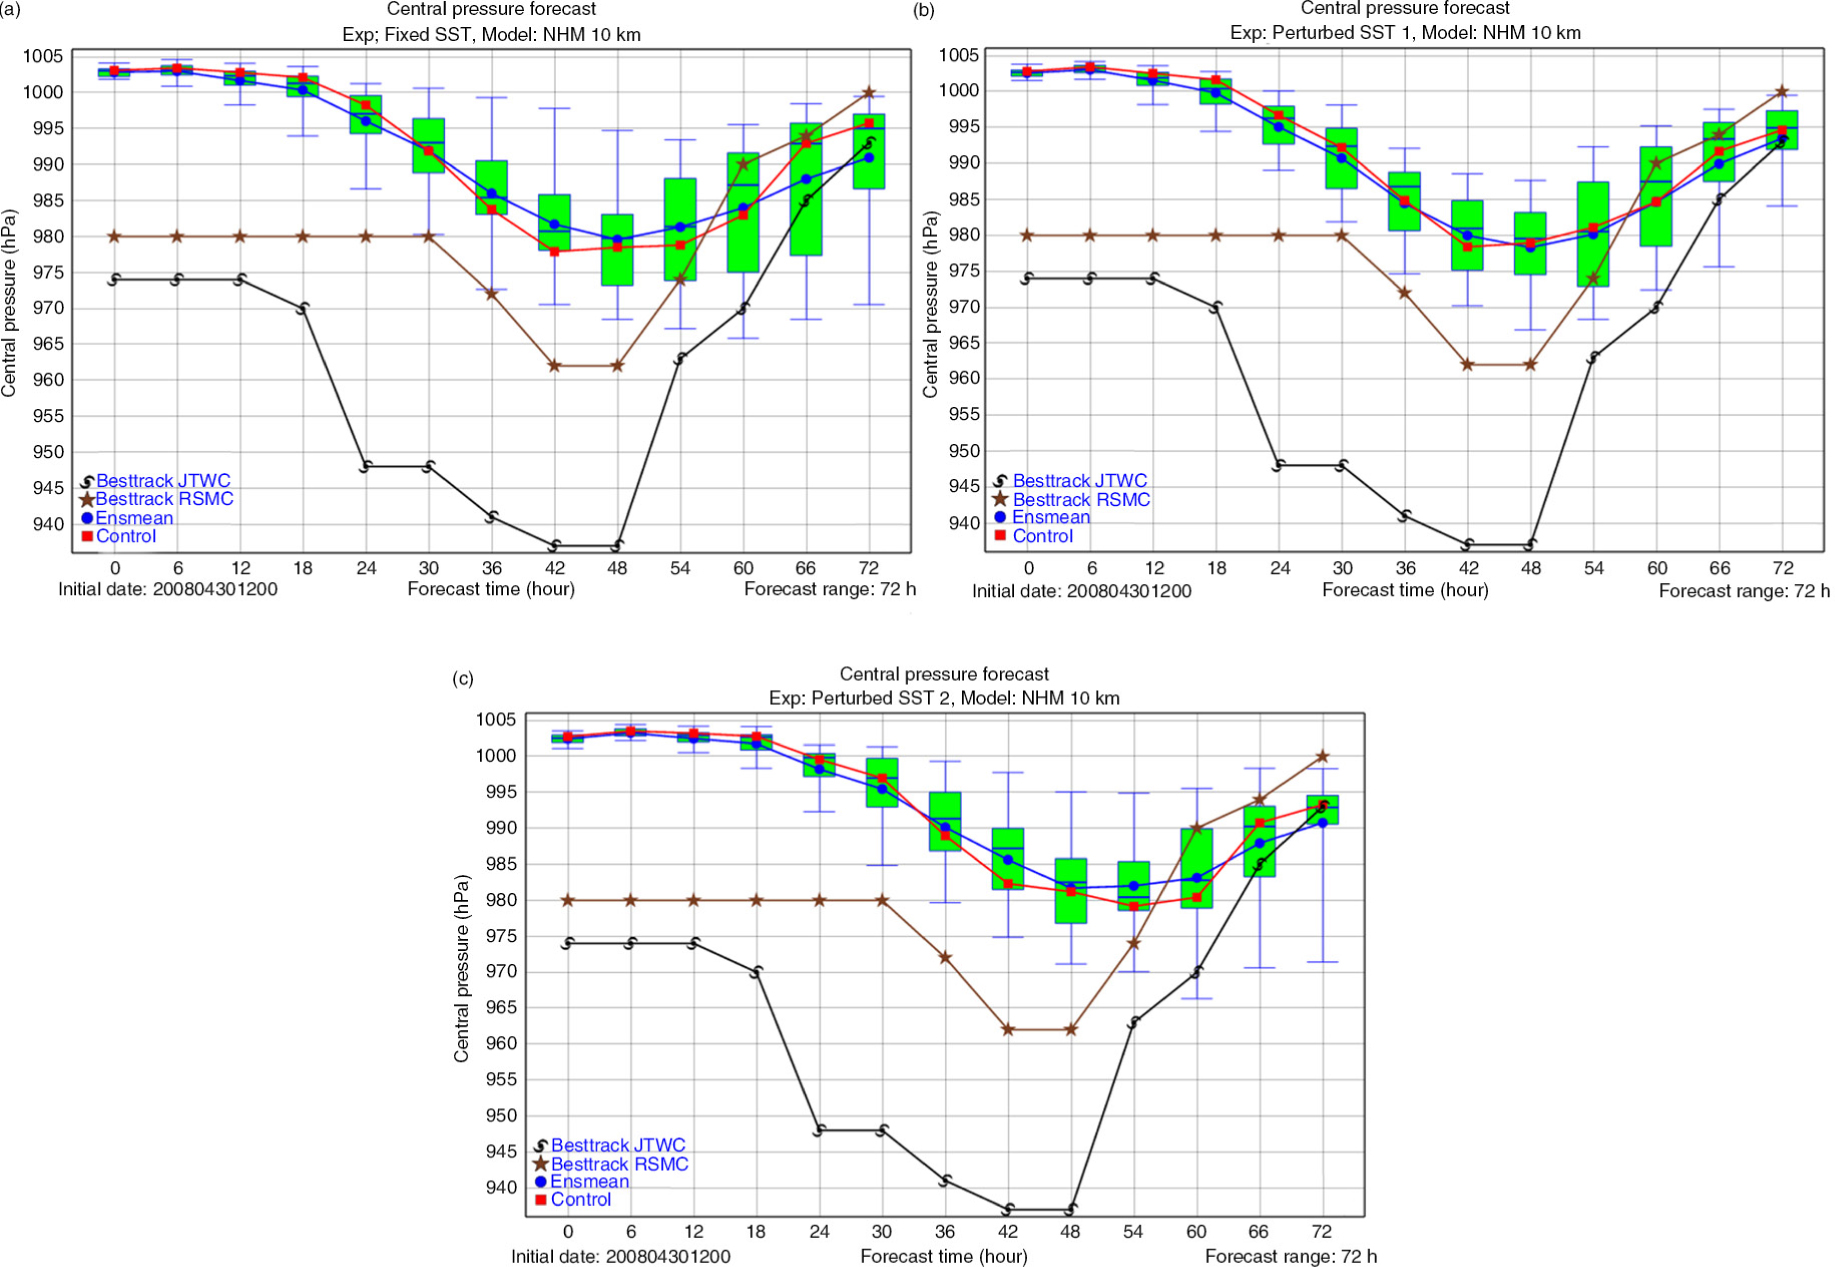
Fig. 10
As Fig. 9 but for the forecasted intensities.
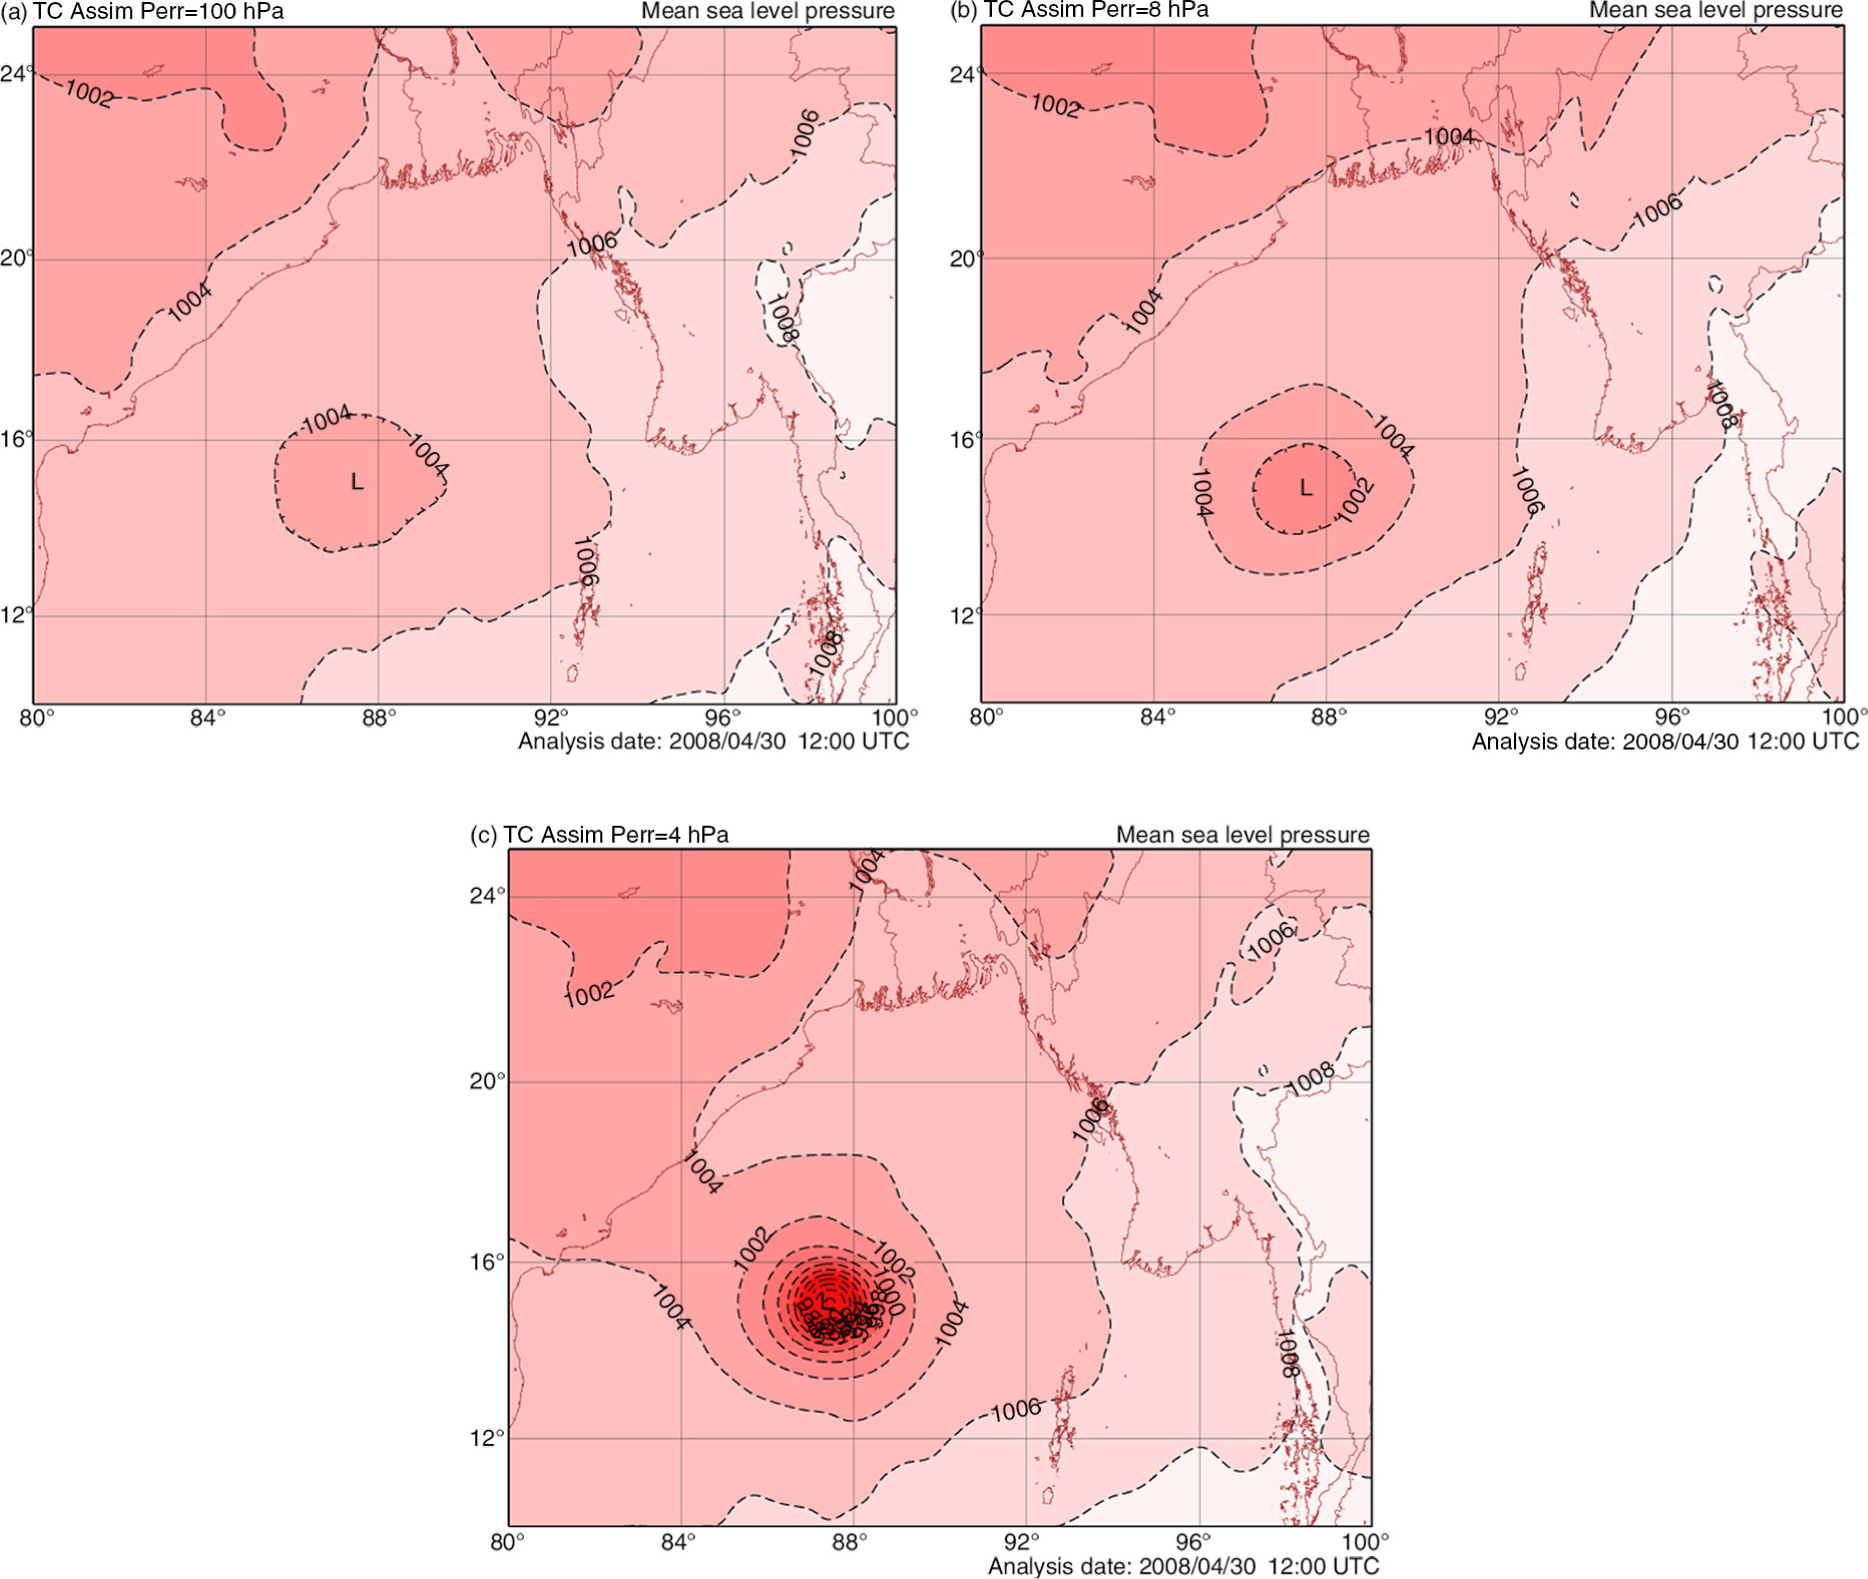
Fig. 11
Pmsl fields analysed by NHM–LETKF when assimilating TC advisories with different observational errors of central pressures (Perr): (a) Perr=100 hPa, (b) Perr=8 hPa, (c) Perr=4 hPa.
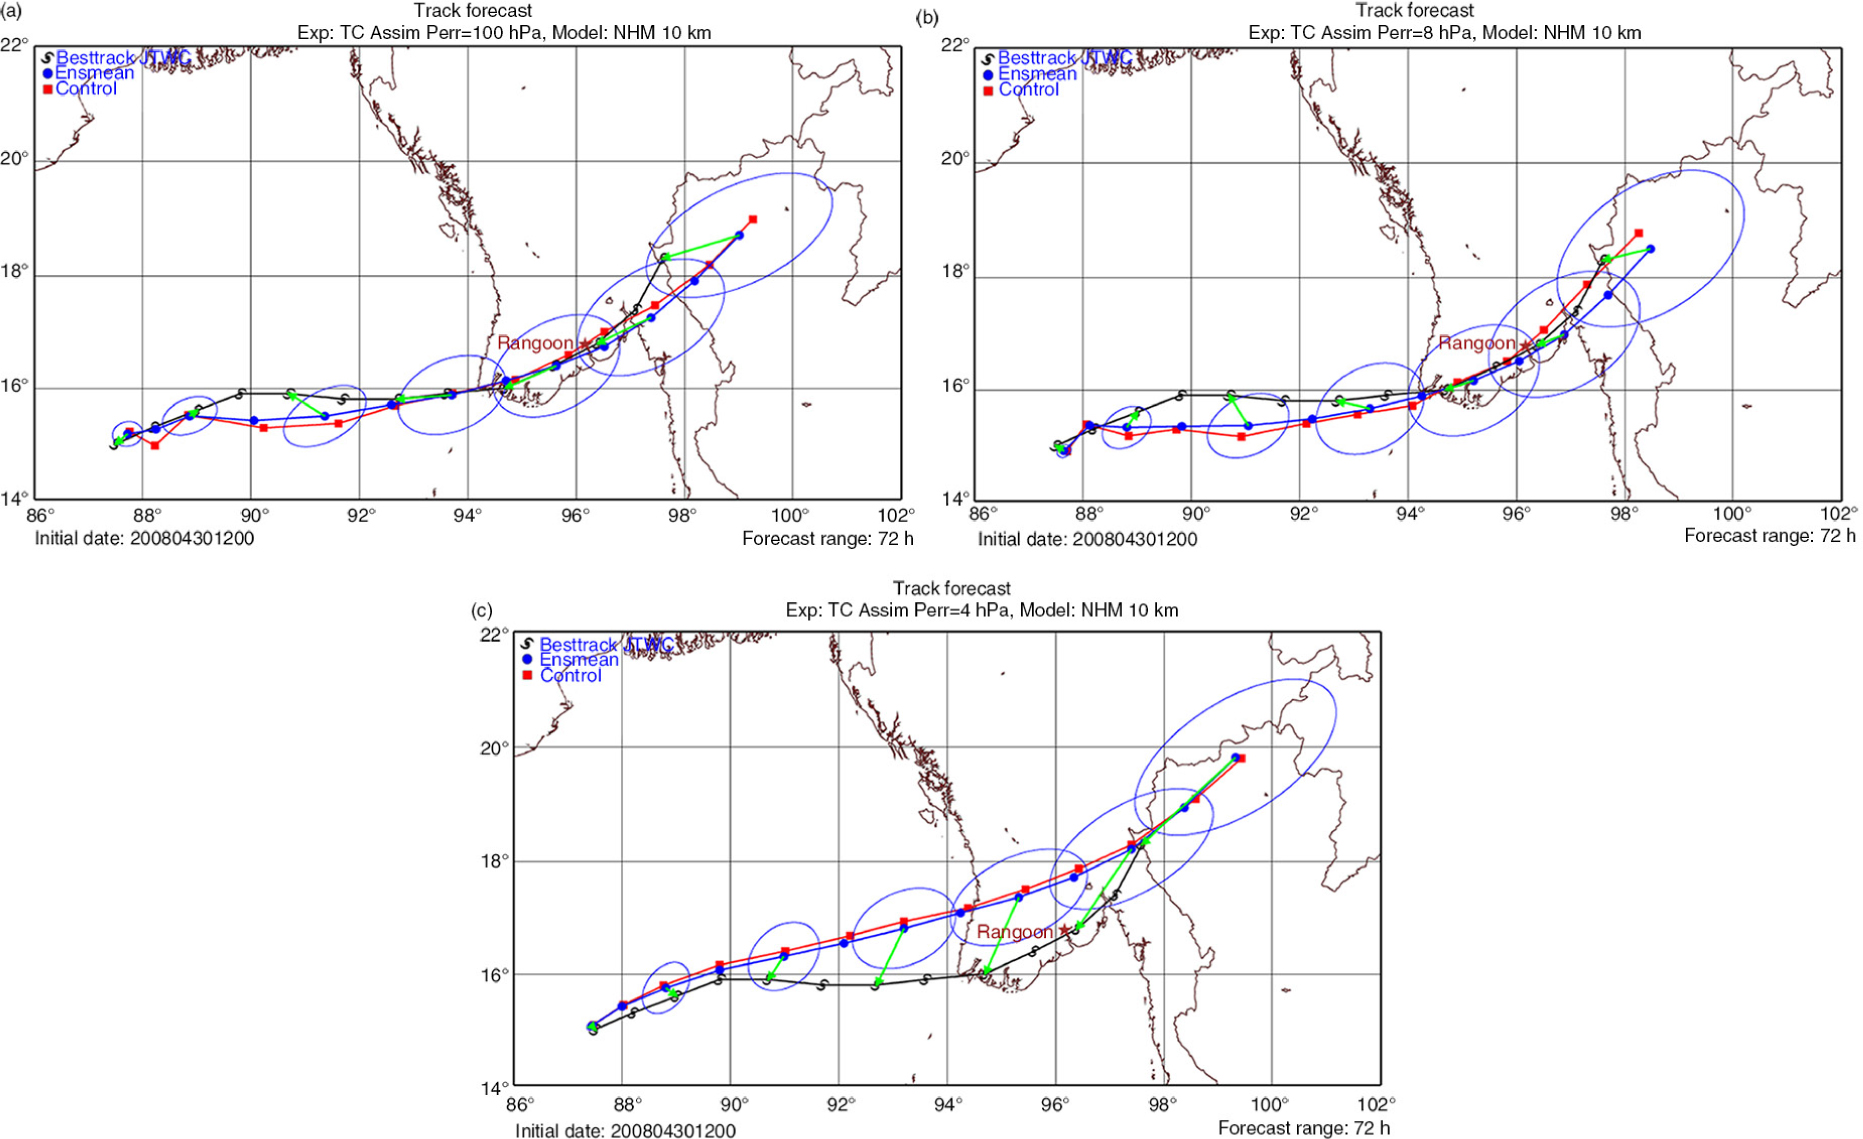
Fig. 12
As Fig. 11 but for the forecasted tracks.
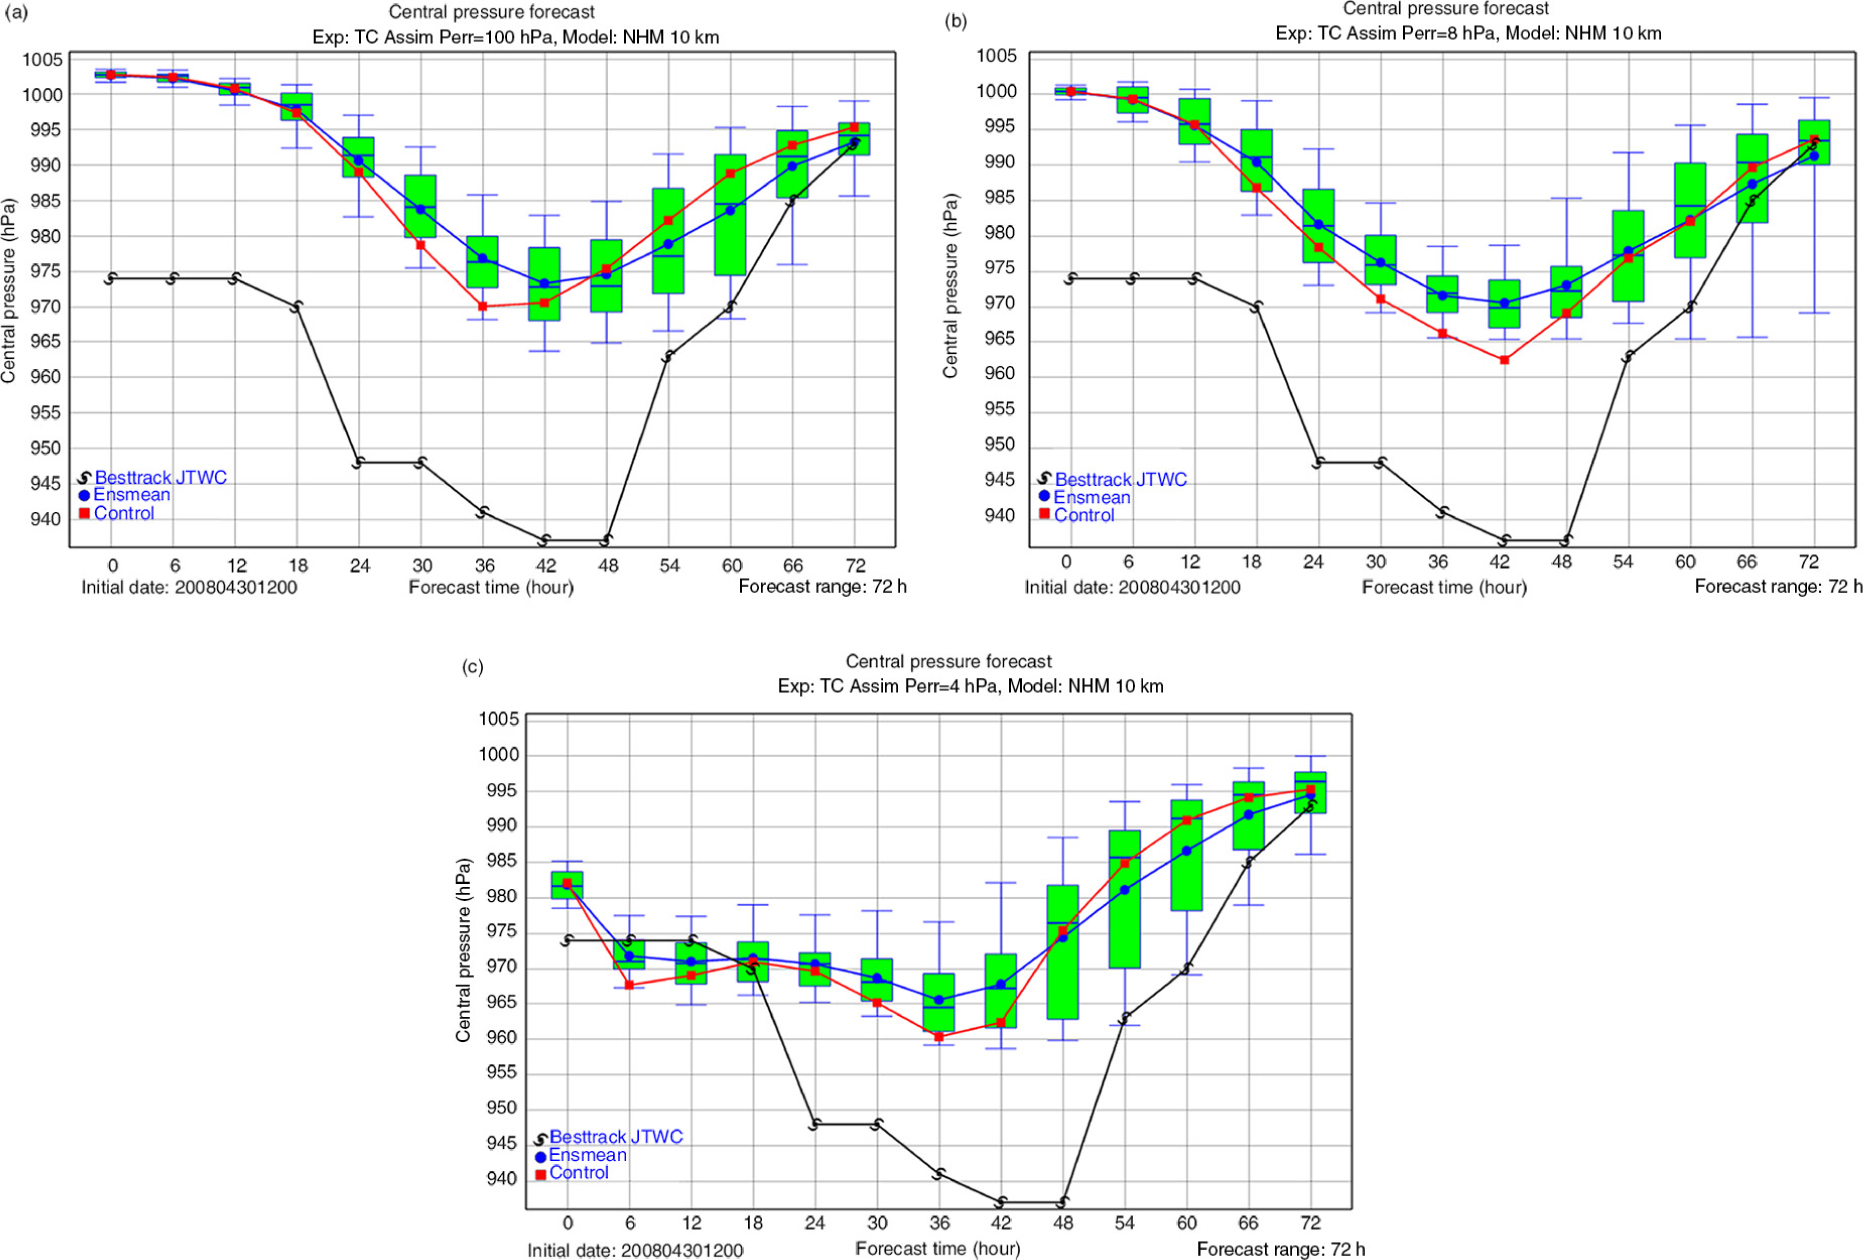
Fig. 13
As Fig. 11 but for the forecasted intensities.
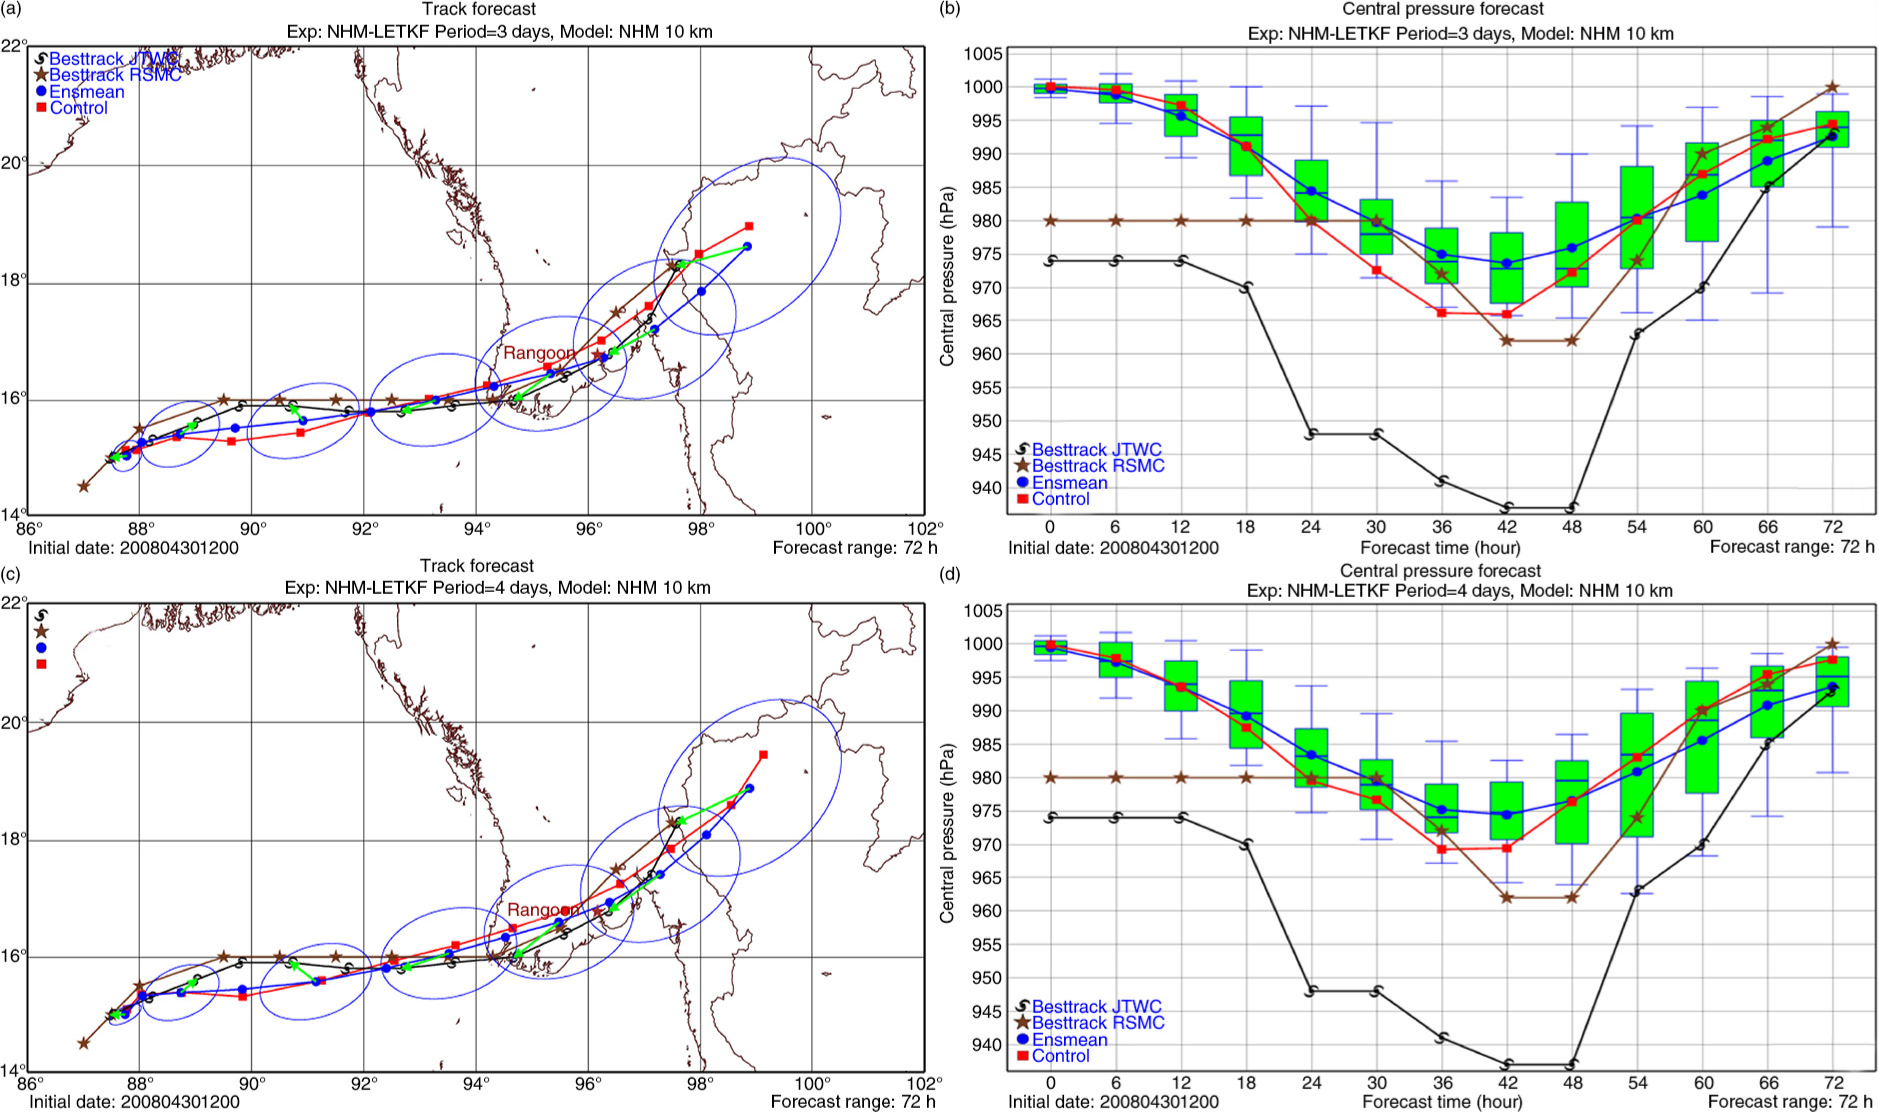
Fig. 14
The 72-hour forecasts of Nargis when increasing the assimilation period: (a) tracks and (b) Central pressures when the assimilation period was 3 d, and (c) tracks and (d) central pressures when the assimilation period was 4 d.
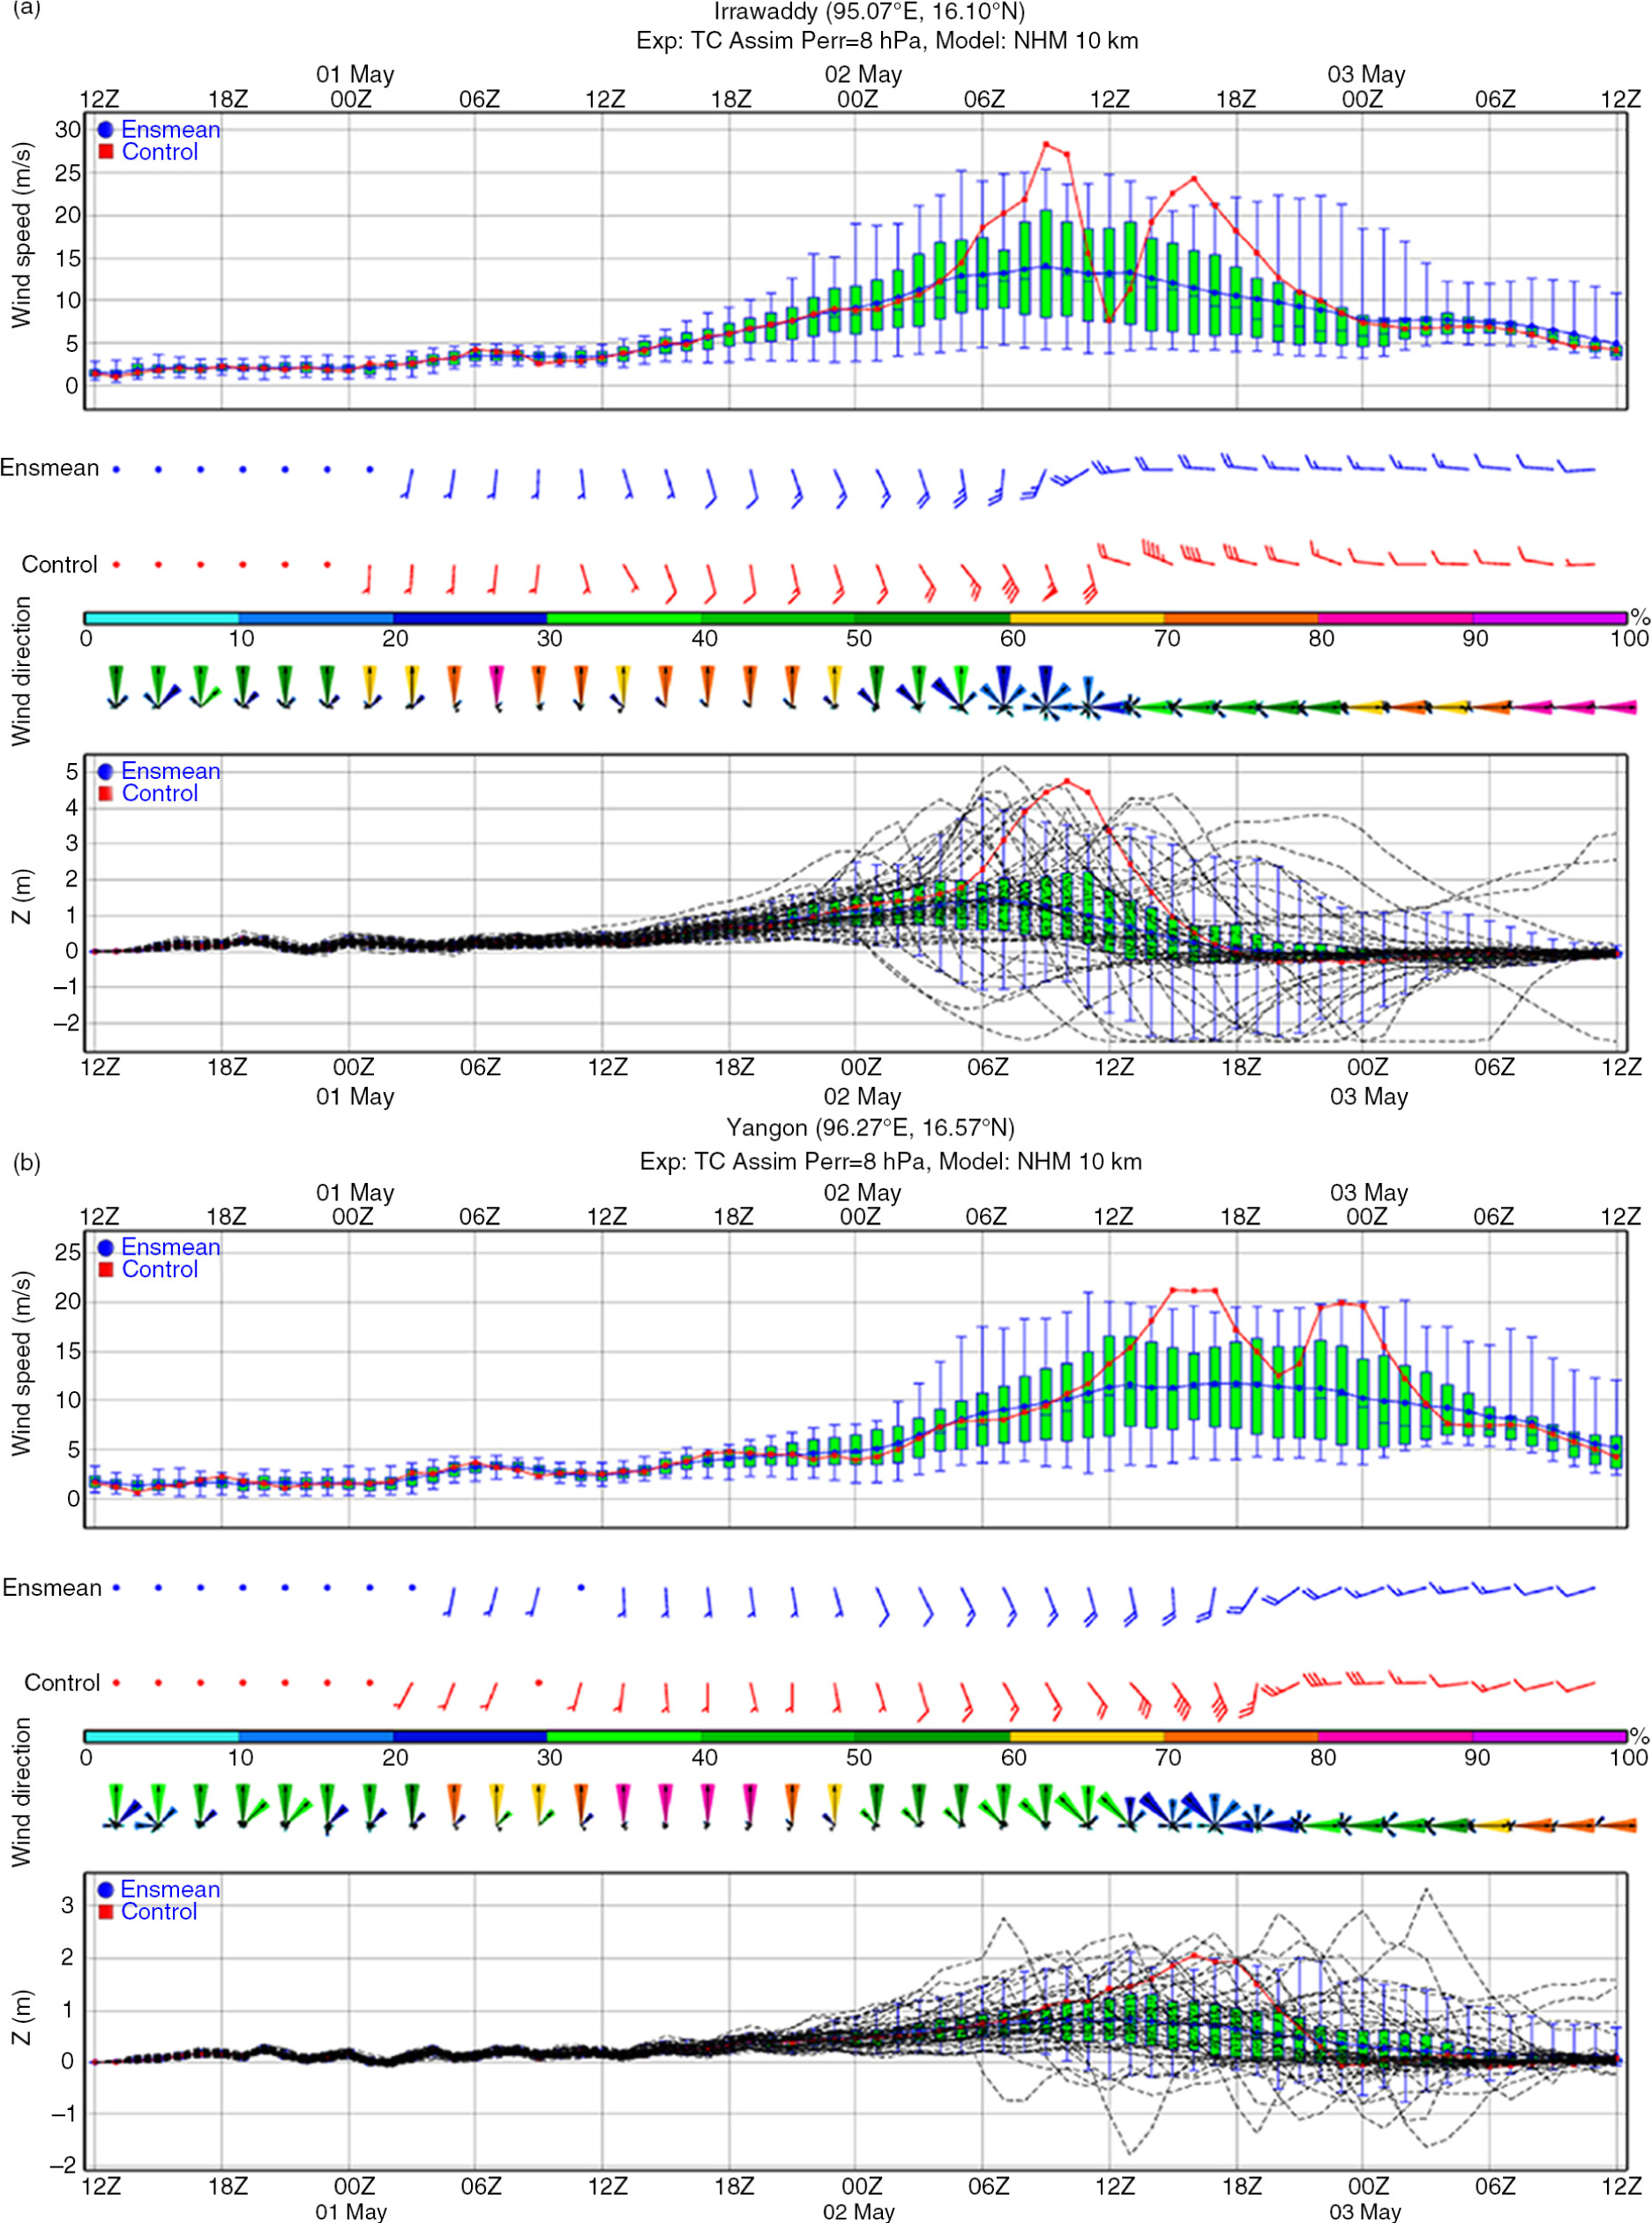
Fig. 15
Forecasts of wind speeds, wind directions and water levels based on the NHM–LETKF using assimilation of TC advisories with Perr=8 hPa at: (a) Irrawaddy point and (b) Yangon point. The ends of the whiskers represent the 5th and 95th percentiles.
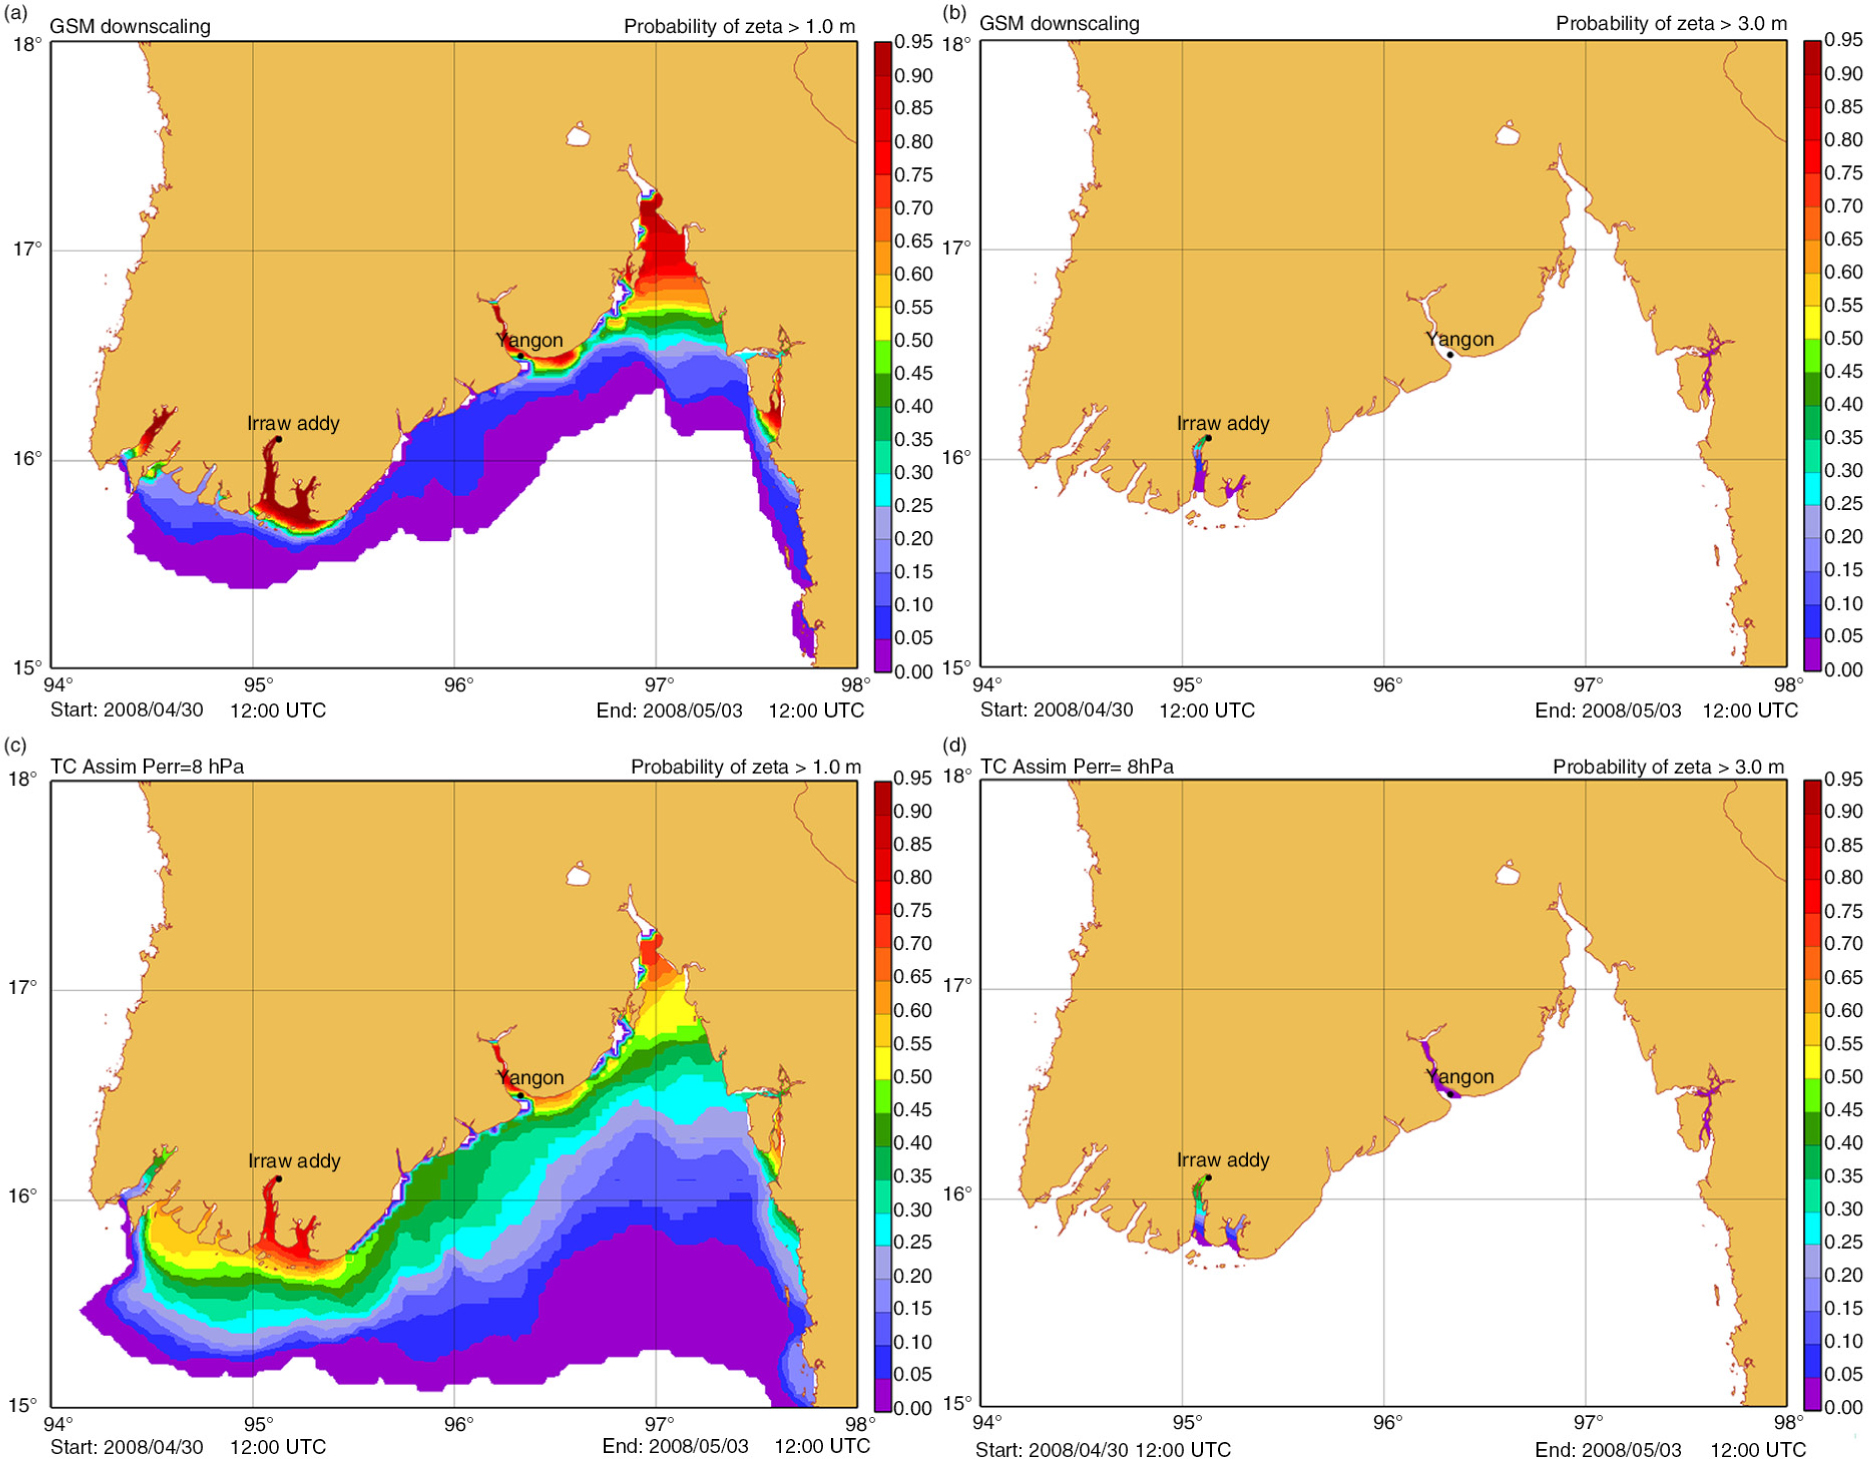
Fig. 16
Probabilistic maps of water levels above 1 m (a, c) and 3 m (b, d). The top panel shows forecasts based on the GSM downscaling, and the bottom panel forecasts based on the NHM–LETKF using assimilation of TC advisories with Perr=8 hPa.