

Fig. 1
Initial state: Pressure–latitude cross section of zonal mean state, (a) temperature (K), (b) zonal wind (m/s) and (c) stereographic projection of zonal wind (m/s) at 300 hPa layer. Latitudes start at 10°S, and shaded regions indicate winds stronger than 30 m/s.
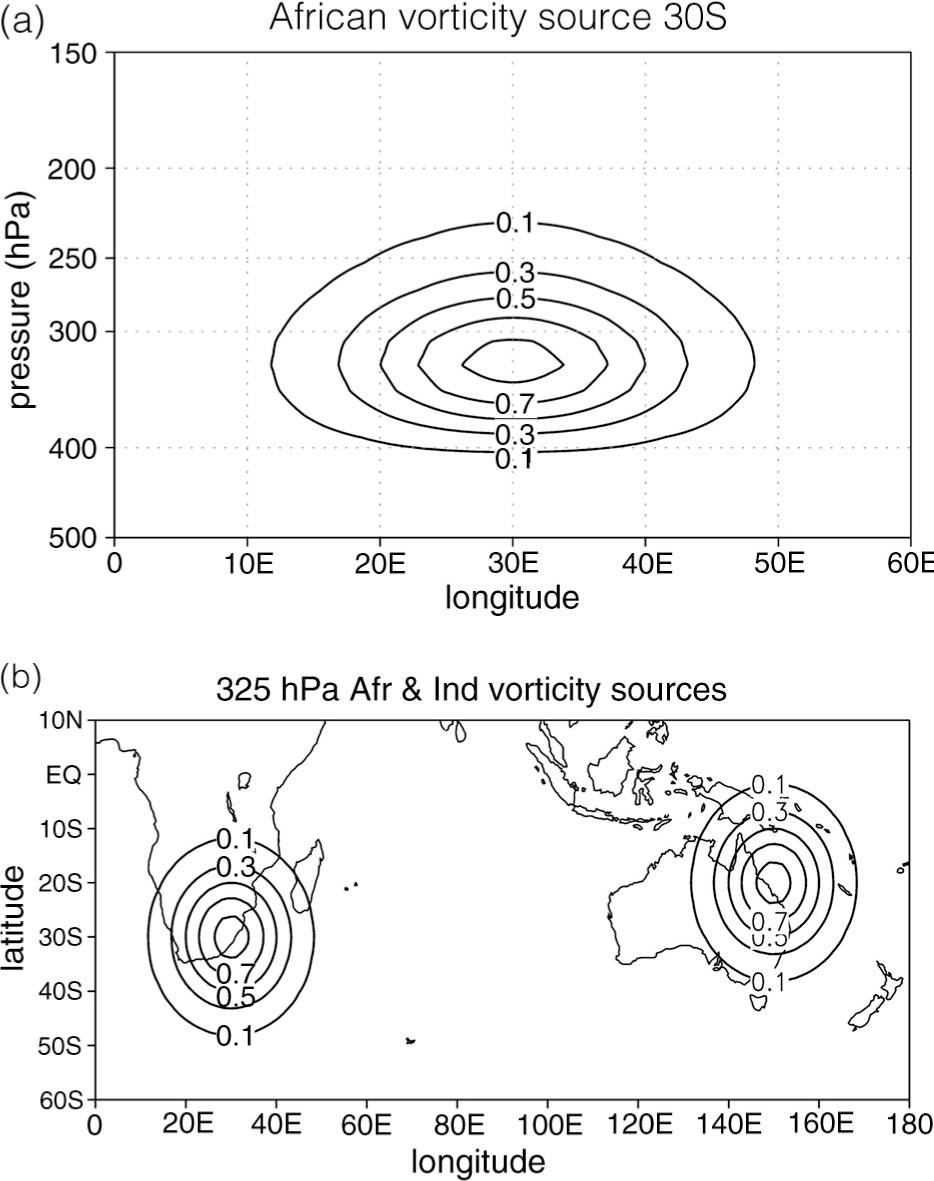
Fig. 2
(a) Pressure–longitude cross section of African wave maker distribution (normalised) with its centre at 30°S, and at 325 hPa layer; (b) latitude–longitude location of African and Indonesian wave maker at 325 hPa layer (about 8 km altitude). Contours are shown from 0.1 with an interval of 0.2.
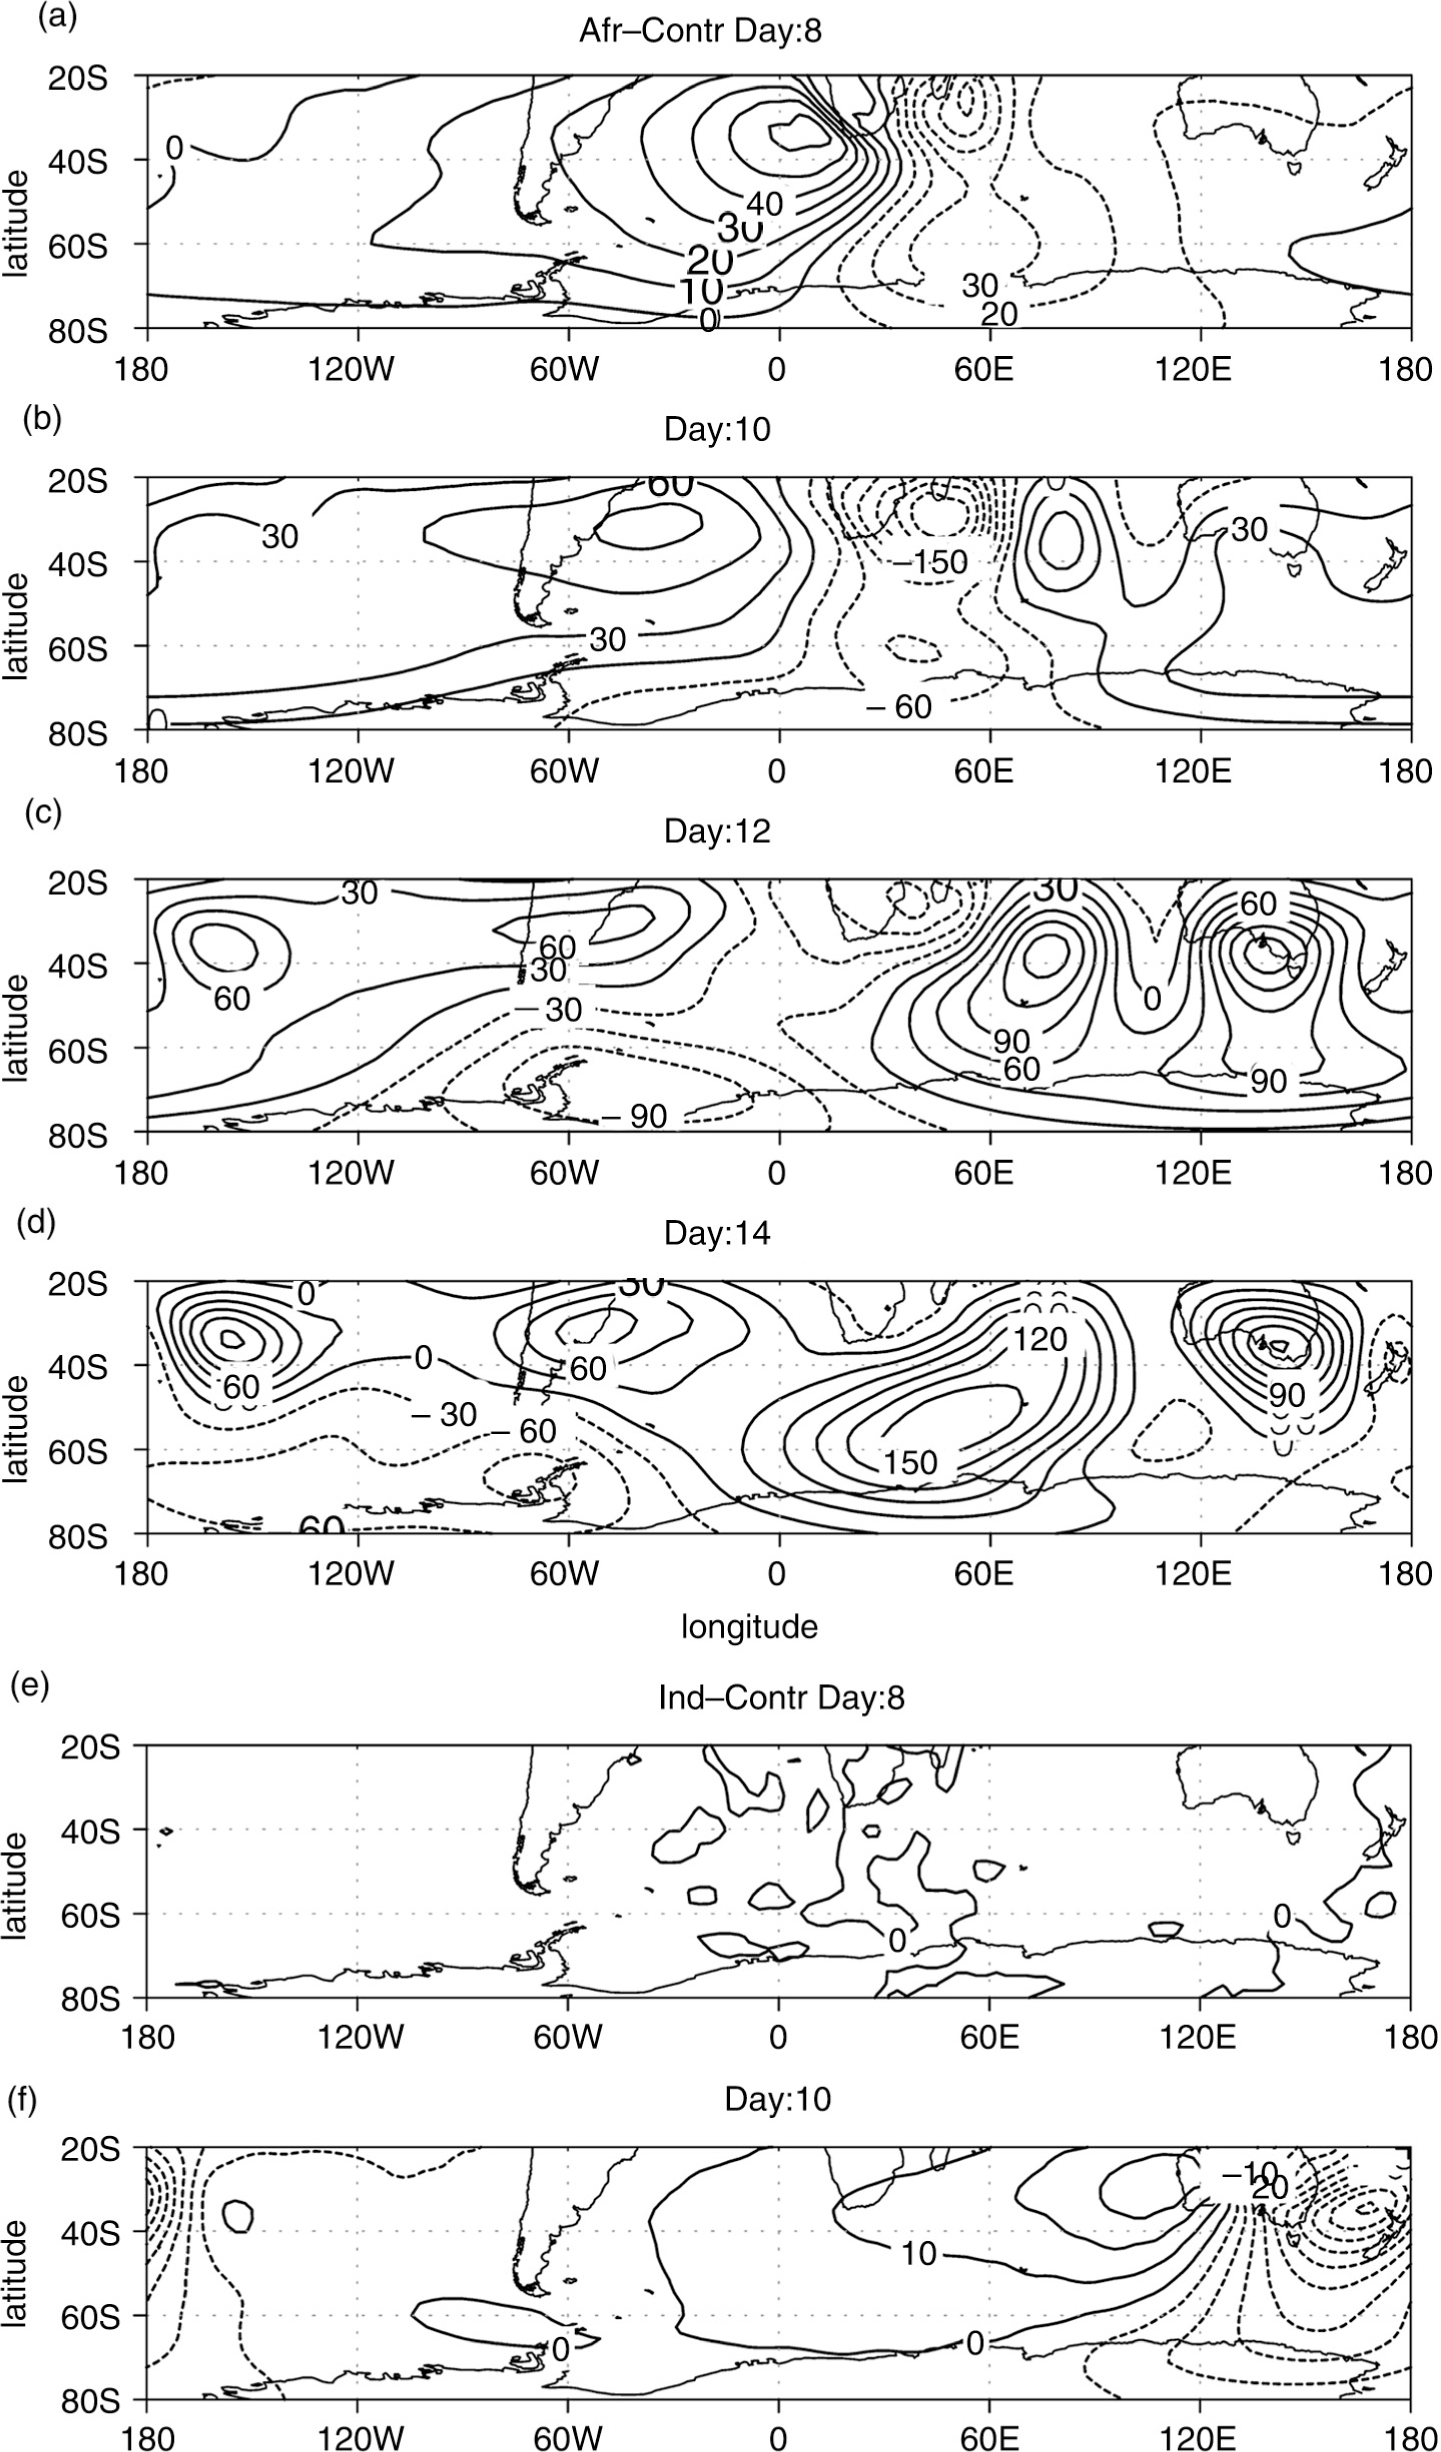
Fig. 3
Latitude–longitude cross section at 100 hPa layer: Evolution of geopotential height difference (GHD; m) for day 8, 10, 12, and 14: (a–d) runs for African wave maker forcing (Afr) minus control run (Contr), and (e–h) runs for Indonesian wave maker forcing (Ind) minus control run. Note the Indonesian wave maker was switched on 2 d later.
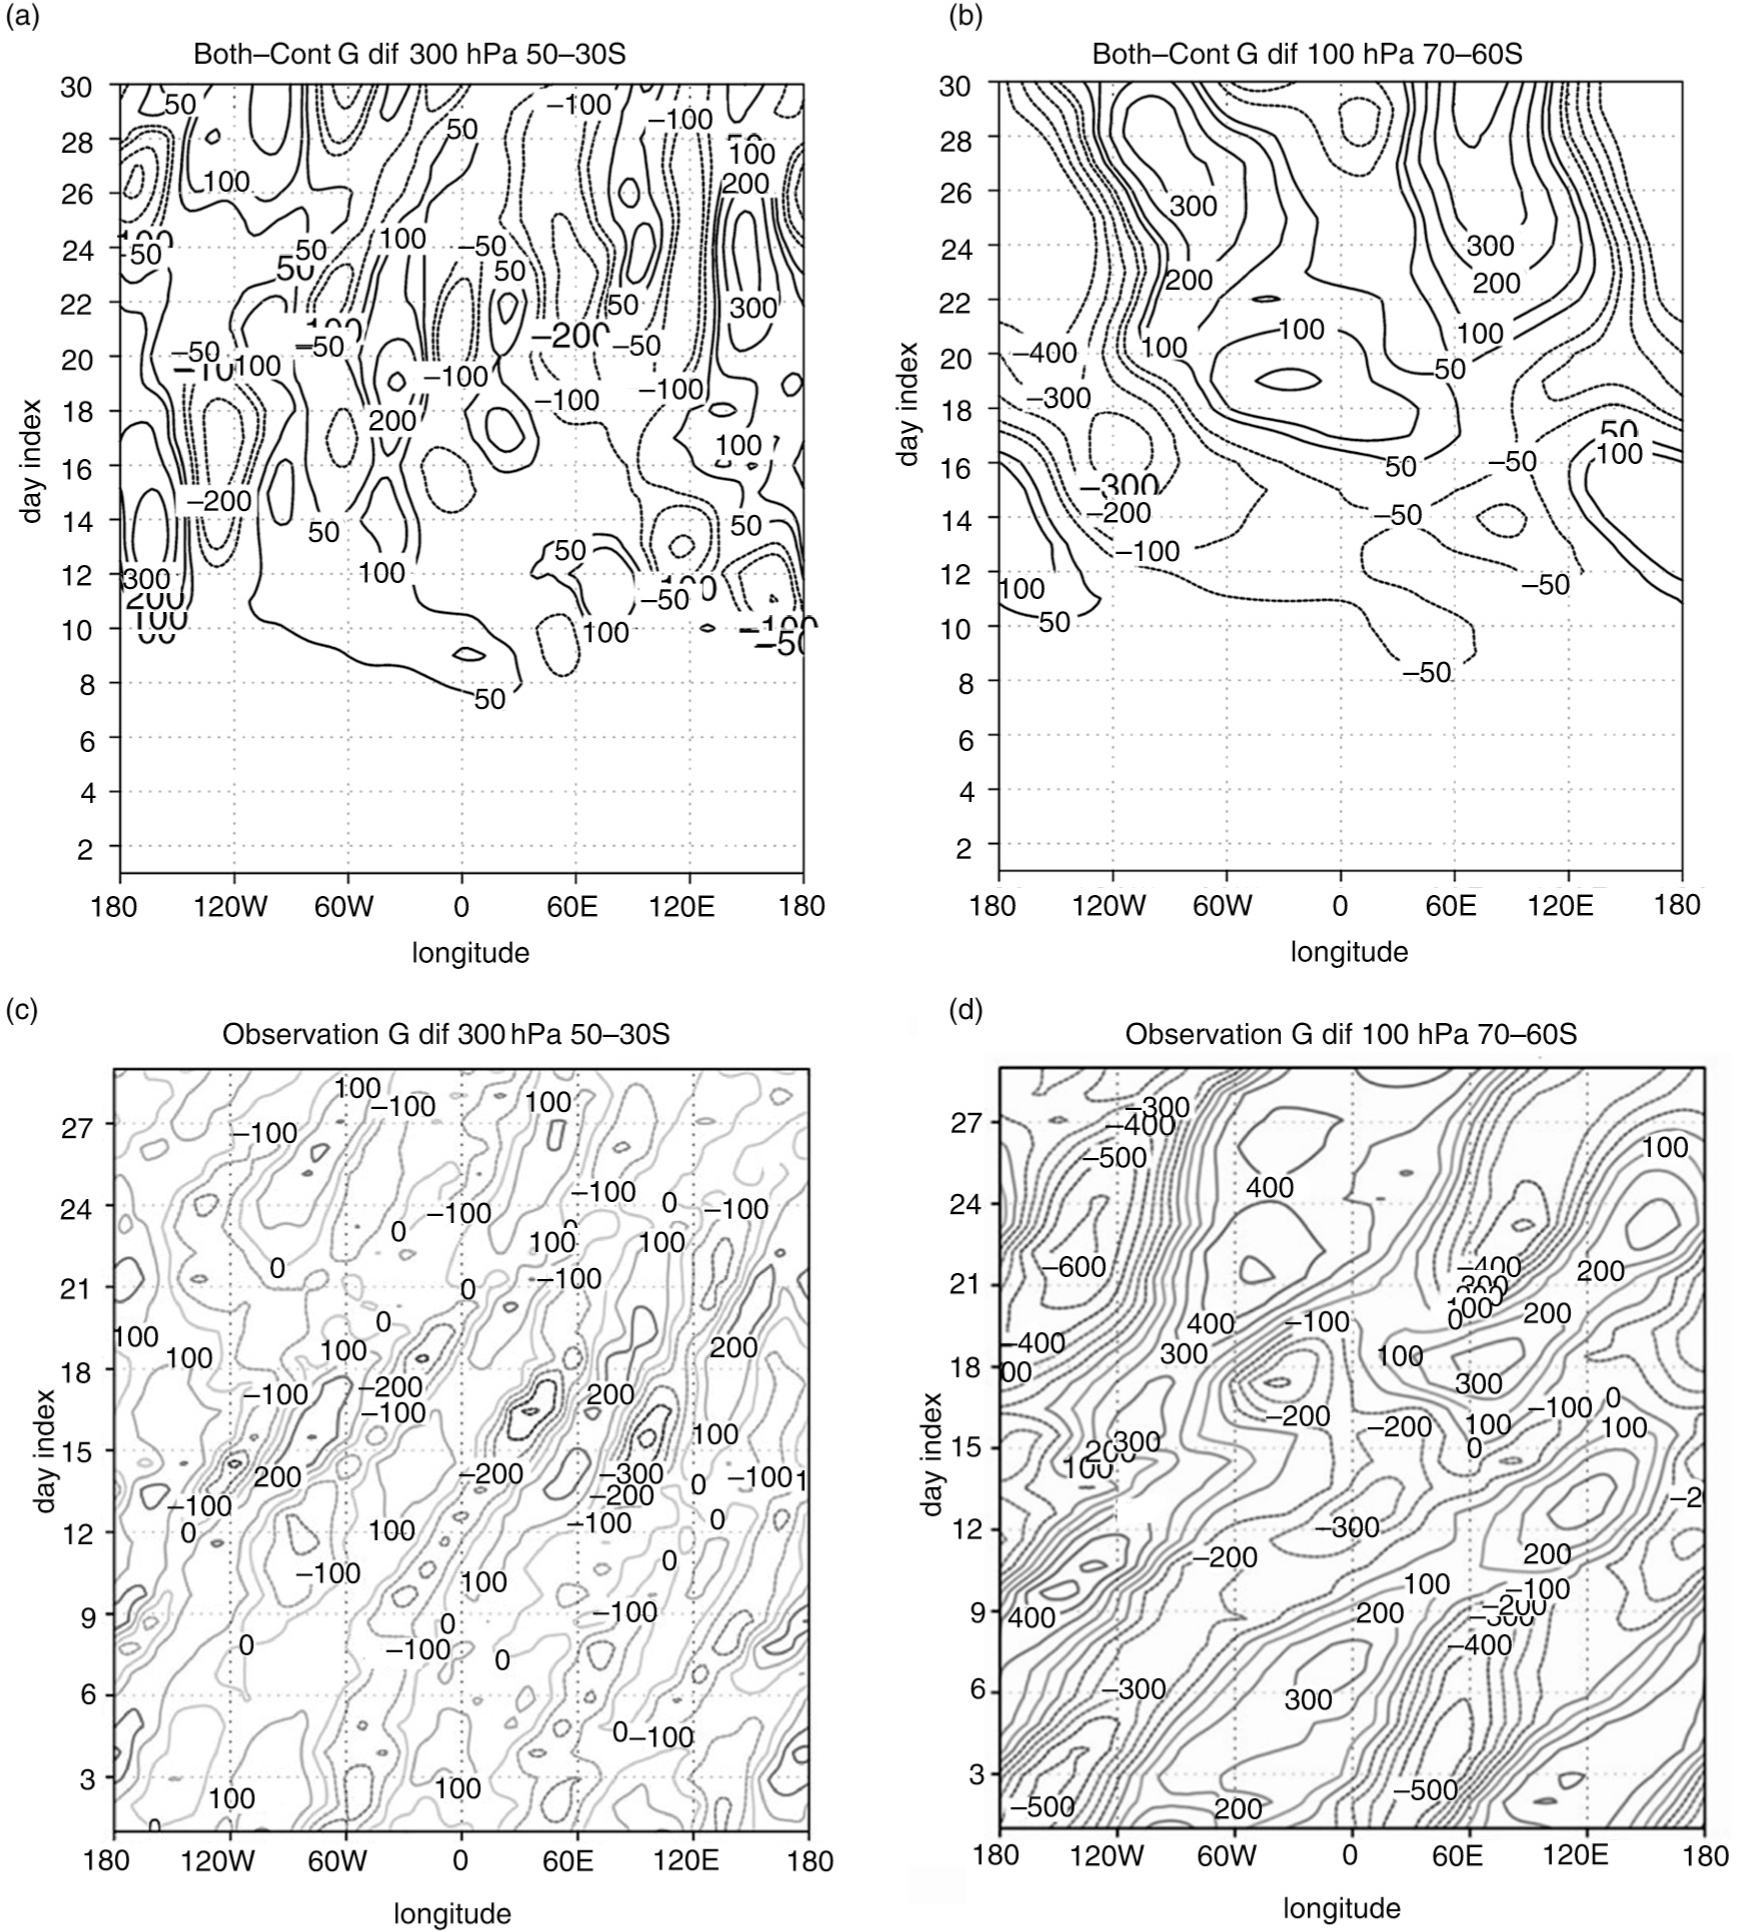
Fig. 4
Hovmöller diagram of geopotential height difference (GHD, m): (a, b) run with both wave makers minus control run, (c, d) observations based on ERA-Interim, September 2002 minus (1979–2008). (a, c) averaged over the latitudinal belt 50°–30°S at 300 hPa layer, and (b, d) averaged over 70°–60°S at 100 hPa.
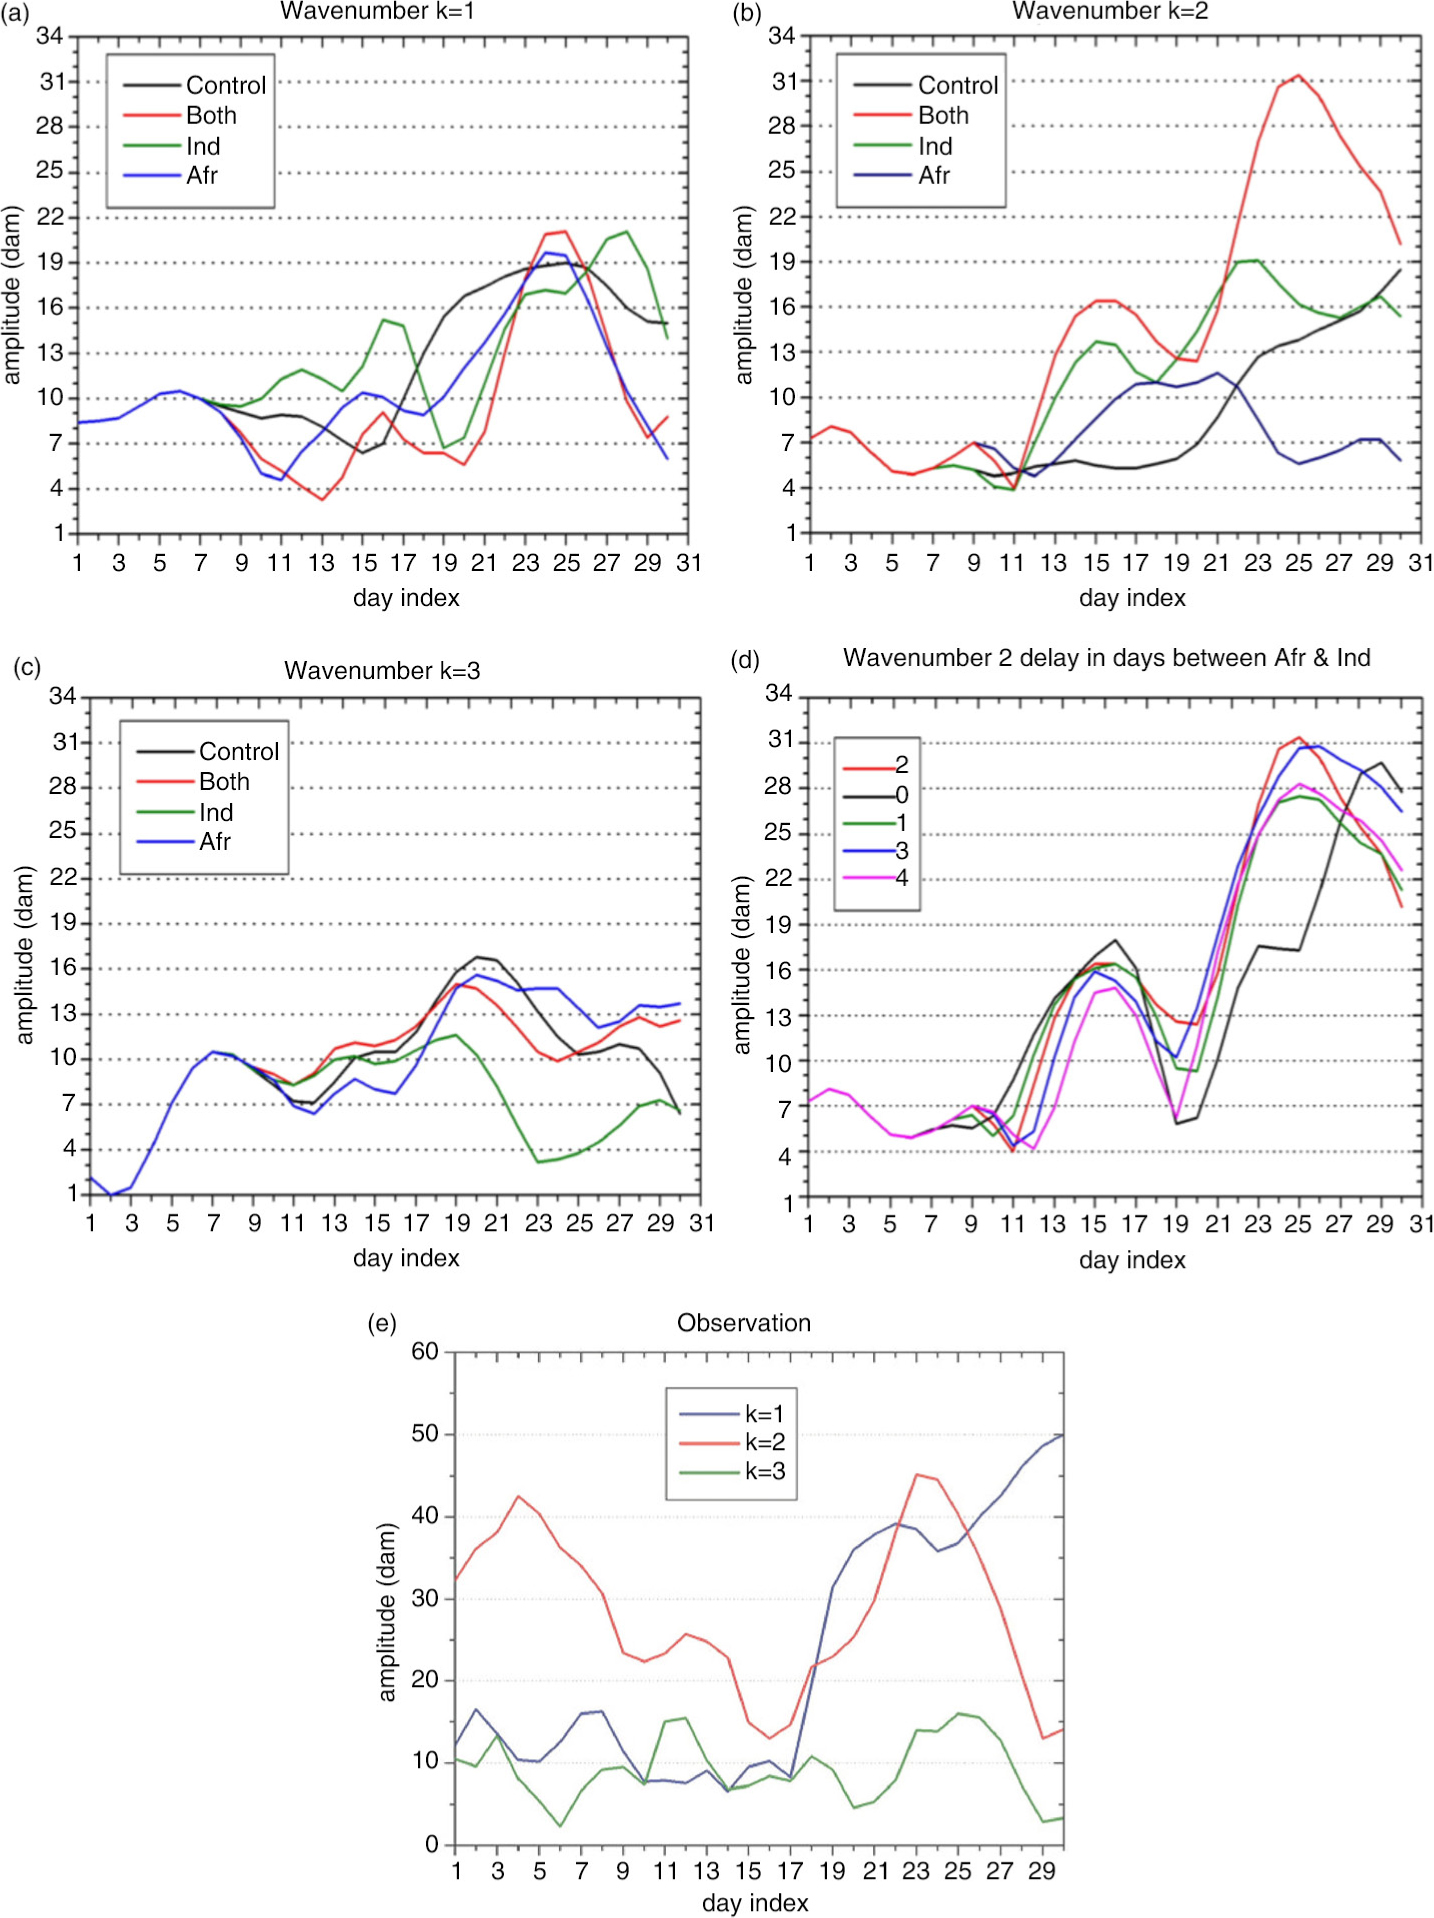
Fig. 5
Evolution of geopotential height amplitude (dam) averaged over 70°–60°S at 100 hPa layer for different wave makers: (a) planetary wave 1; (b) wave 2; (c) wave 3; and (d) planetary wave 2 with different delay times (in days) of switching on the Indonesian wave maker; (e) observation based on ERA-Interim.
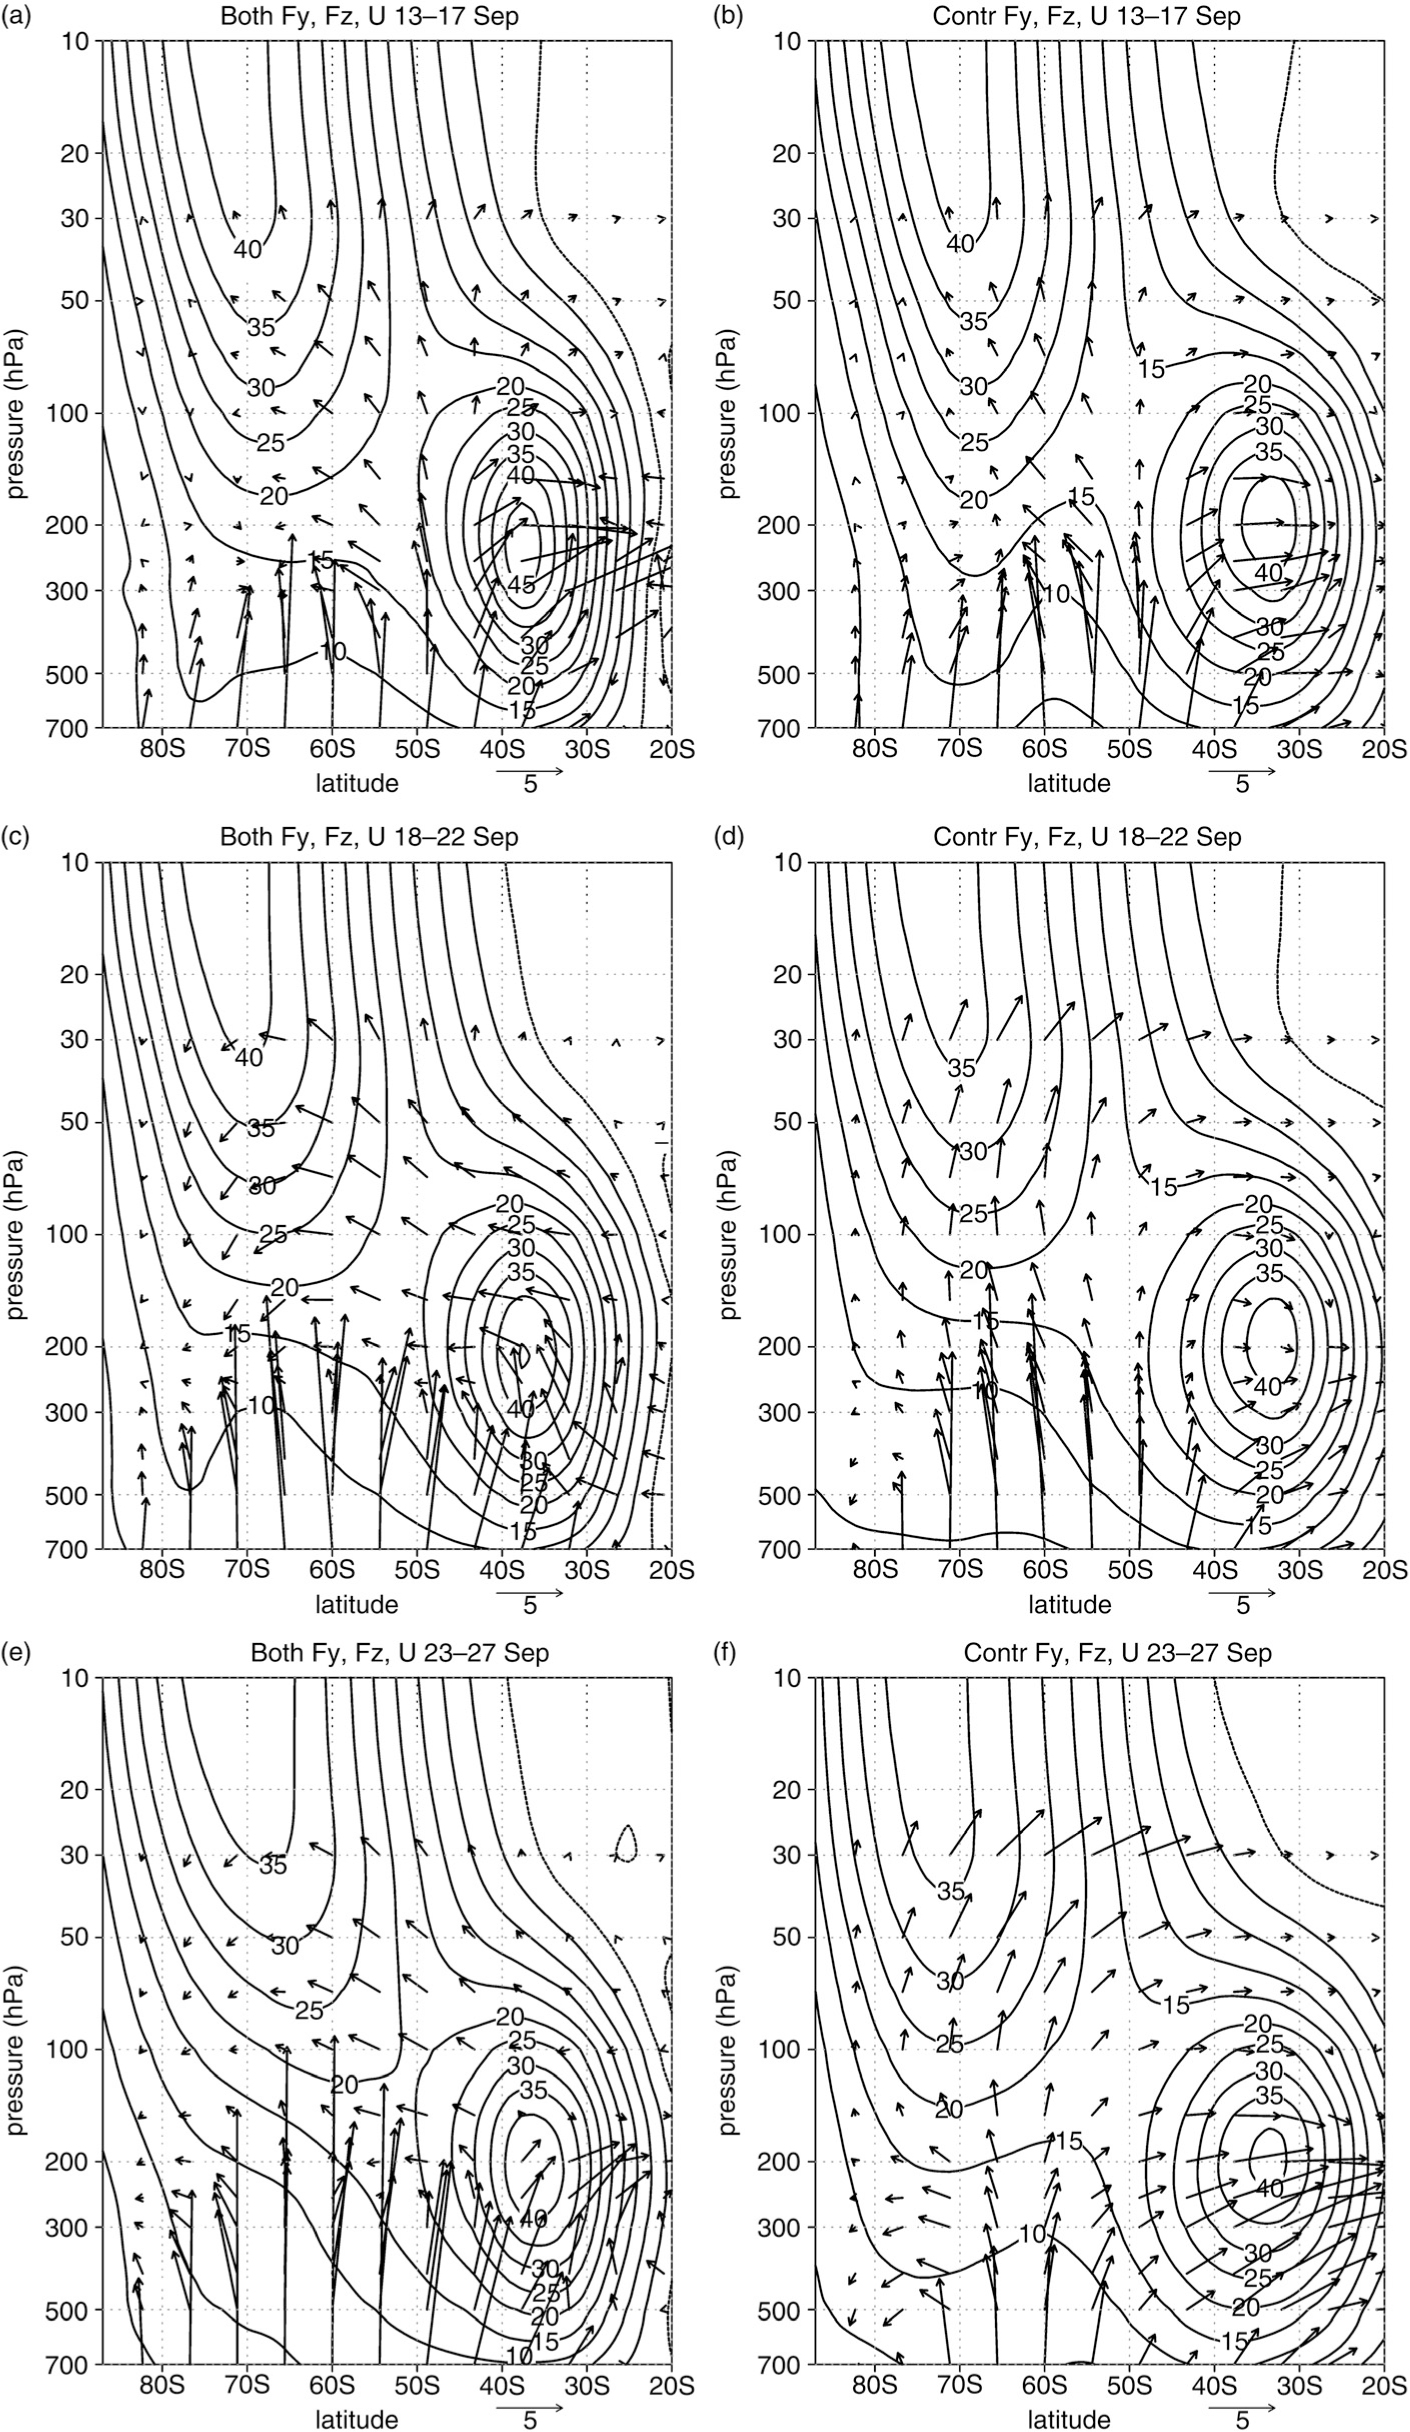
Fig. 6
Pressure–latitude cross sections of Eliassen–Palm flux (arrows, m2/s2) and zonal mean zonal wind contours (m/s) averaged over a 5 d period: (a, b) 13–17, (c, d) 18–22, and (e, f) 23–27 September of model simulation according to both wave makers (a, c, e), and control run (b, d, f).
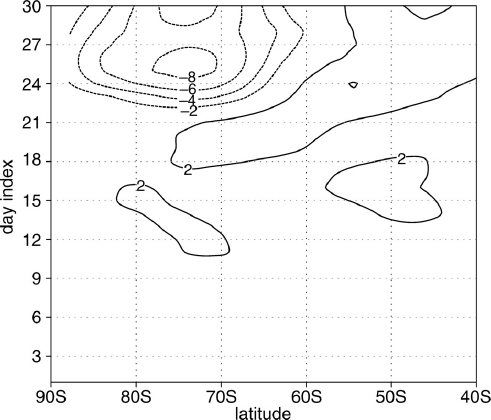
Fig. 7
Hovmöller diagram of the difference of zonal mean zonal wind (m/s) induced by model run with both wave makers minus control run at 70 hPa layer.