
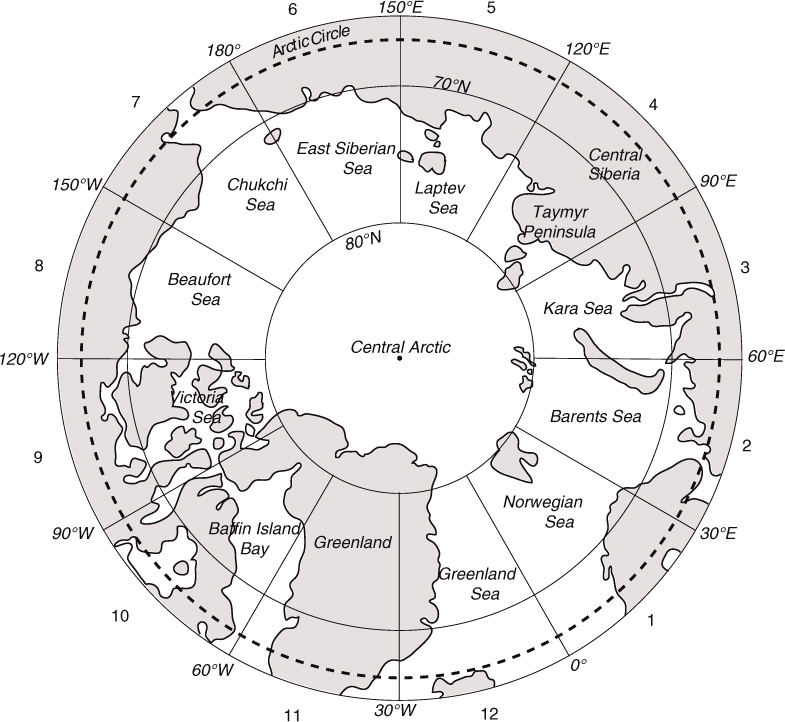
Fig. 1
Longitude sections used in this study (adapted from Sorteberg and Walsh, 2008). Each section is referred to by a number (1–12) and its adjacent ocean or land region. The dashed line indicates the Arctic Circle (66.6°N).
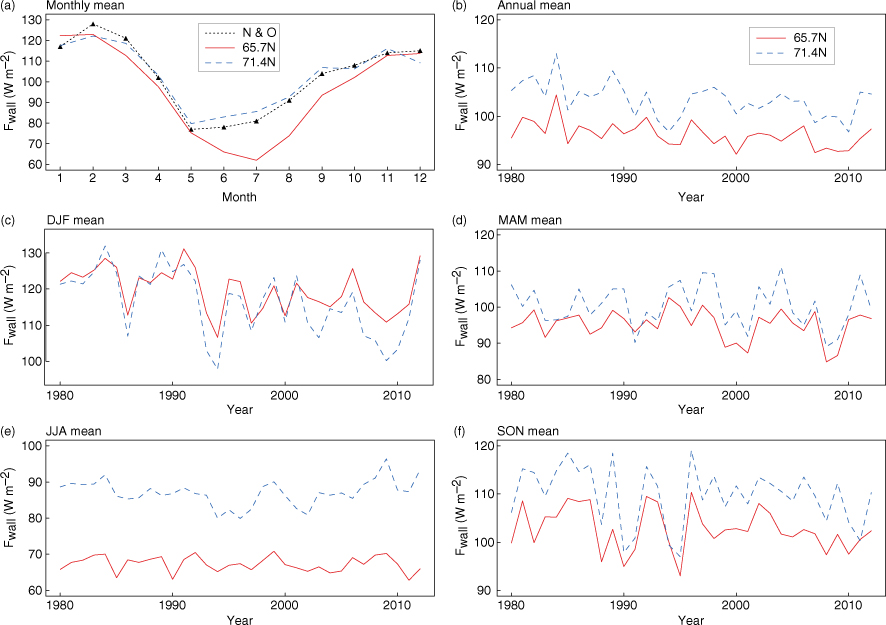
Fig. 2
Zonally and vertically integrated poleward heat transport (Fwall) calculated at 65.7°N and 71.4°N, respectively. The fluxes are normalised by the enclosed polar surface areas to facilitate inter-comparison with radiative fluxes. (a) Monthly mean fluxes for the period 1979–2012; N&O indicates 10-year average fluxes calculated at 70°N by Nakamura and Oort (1988). (b)–(f) Annual, DJF, MAM, JJA and SON mean fluxes.
Table 1. Linear trends of atmospheric northward energy transport at 65.7°N (divided by the total area north of the latitude) between 1979 and 2012
(W m−2 a−1)
Annual−0.13±0.04DJF−0.26±0.10MAM−0.07±0.07JJA−0.03±0.04SON−0.11±0.08
Table 2. Partitioning of atmospheric northward energy transport (in terawatt) in winter (DJF) between 1979 and 2012
Stationary[v*q*]9020[v*T*]1205285[v*z*]742951Transient[v'q’]240128[v'T’]1145771[v'z’]231156Mean circulation[v][q]89[v][T]145189[v][z]−1288−964Total25161545
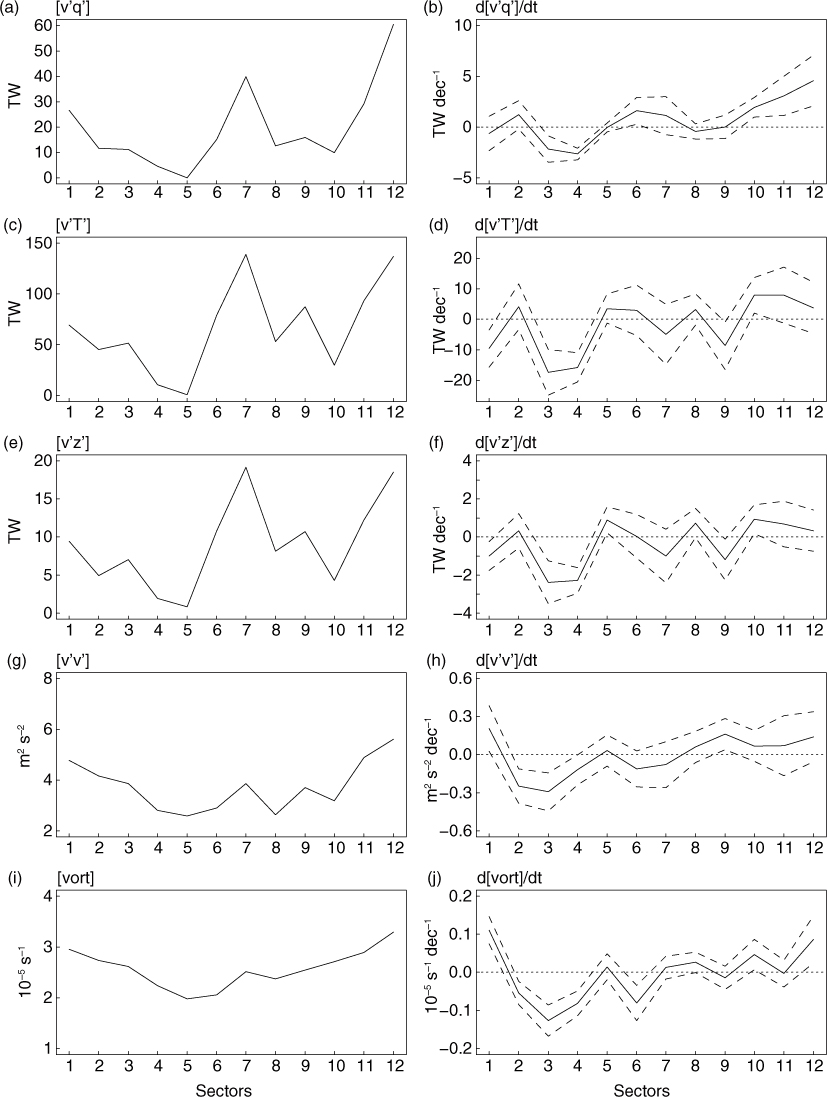
Fig. 3
Average wintertime (DJF) northward energy fluxes by transient eddies through cross-sections (~400 hPa – surface, 30° longitude bins) at 65.7°N near the Arctic Circle, variances of v-wind, positive vorticities and their respective linear trends between 1979 and 2012. Cross-section index increases eastward from 0° to 360°. Variances of v-wind and positive vorticities are calculated at 65.7°N and 71.4°N and averaged. (a) latent heat flux [v'q’], (b) d[v'q’]/dt, (c) sensible heat flux [v'T’], (d) d[v'T’]/dt, (e) potential energy flux [v'z’], (f) d[v'z’]/dt, (g) v-wind variance [v'v’], (h) d/[v'v’]/dt, (i) positive vorticity [vort], (j) d[vort]/dt. Dashed lines indicate ±1-σ for the linear trends.
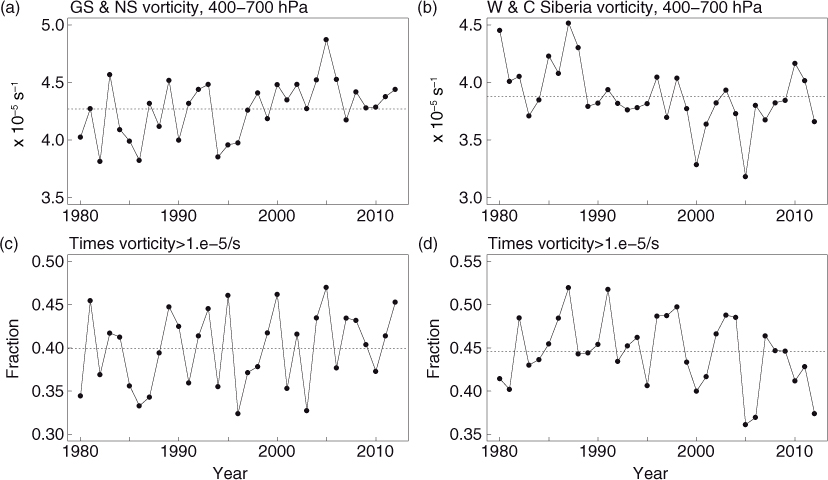
Fig. 4
Winter averages of high vorticity (vort>1.0×10⁻⁵ s−1) between approximately 400 and 700 hPa at 65.7°N over the Greenland Sea (GS) to the Norwegian Sea (NS) (30°W–30°E) (a) and west-central Siberia (60°E–120°E) (b), and the time fraction of high local vorticity over the GS and NS (c) and W and C Siberia (d).
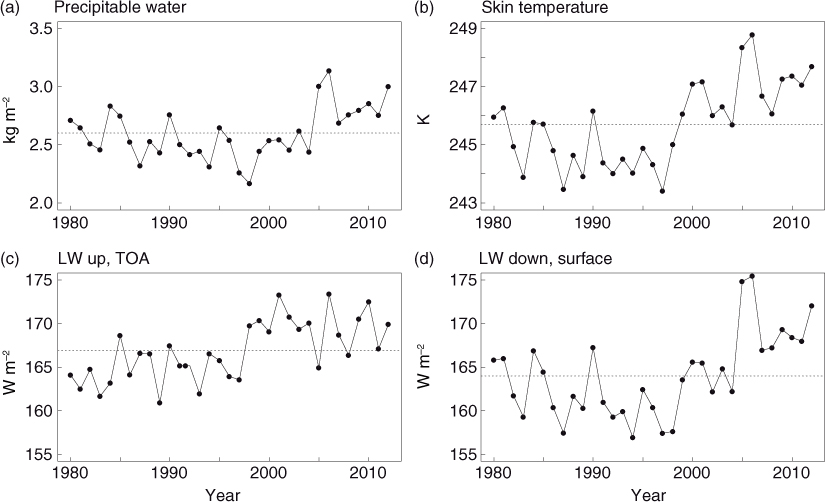
Fig. 5
Winter mean precipitable water (a), skin temperature (b), upward longwave flux at top-of-atmosphere (c) and downward longwave flux at the surface (d), averaged for the polar region north of 70°N.
Table 3. Correlation coefficients between winter average parameters#
Zonal section average
400–700 hPa (~70°N)
30°W–30°E[vort]0.340.180.340.10TFHV0.330.230.27−0.13 60°E–120°E[vort]−0.41−0.26−0.43−0.12TFHV−0.73−0.69−0.67−0.17 700–1000 hPa (~70°N)
30°W–30°E[vort]0.12−0.010.08−0.20TFHV0.370.270.29−0.04 60°E–120°E[vort]−0.46−0.33−0.50−0.25TFHV−0.66−0.60−0.66−0.27