
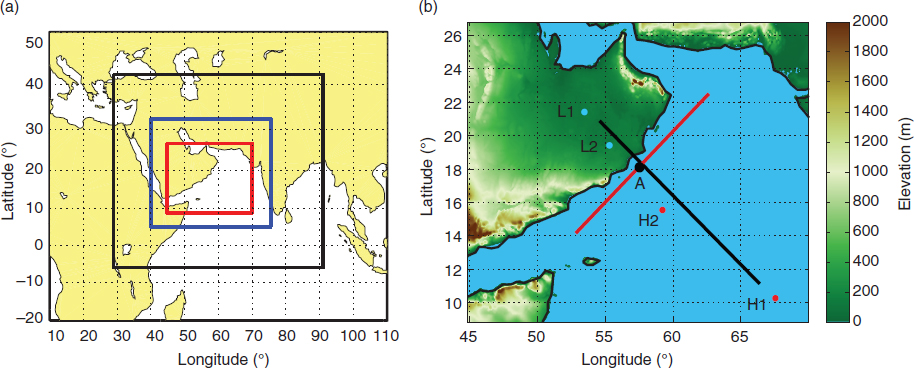
Fig. 1
(a) COAMPS® domains used in the downscaling, from outermost to innermost domain with horizontal resolution of 54 km (black line), 18 km (blue line) and 6 km (red line), respectively, and (b) inner domain, with topography height contours, showing the key points L1 and H1, and L2 and H2 (see Figs. 14 and 15), and A (CLLJ point as black dot at 18°N, 57°E), and the cross-section lines for cross-coast (black line) and along-coast (red line) used in Fig. 8.
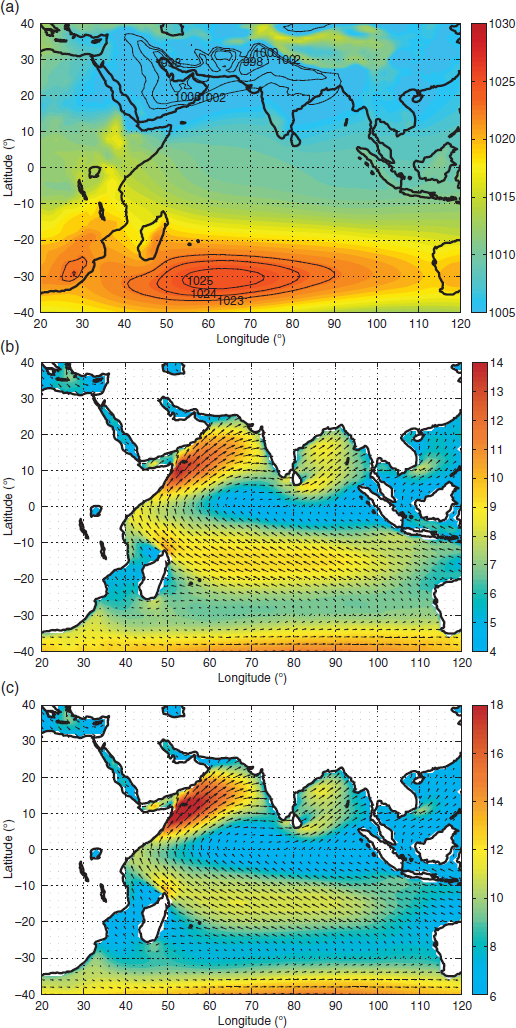
Fig. 2
Seasonal averages (JJA) from ERA-Interim of (a) MSLP (hPa), (b) wind speed at the lowest level (~25 m) and (c) wind speed at ~400 m a.s.l. (m s−1) with arrows representing the wind direction. Note the differences in colour scale between panels b and c. The data are from the period 1980–2011.
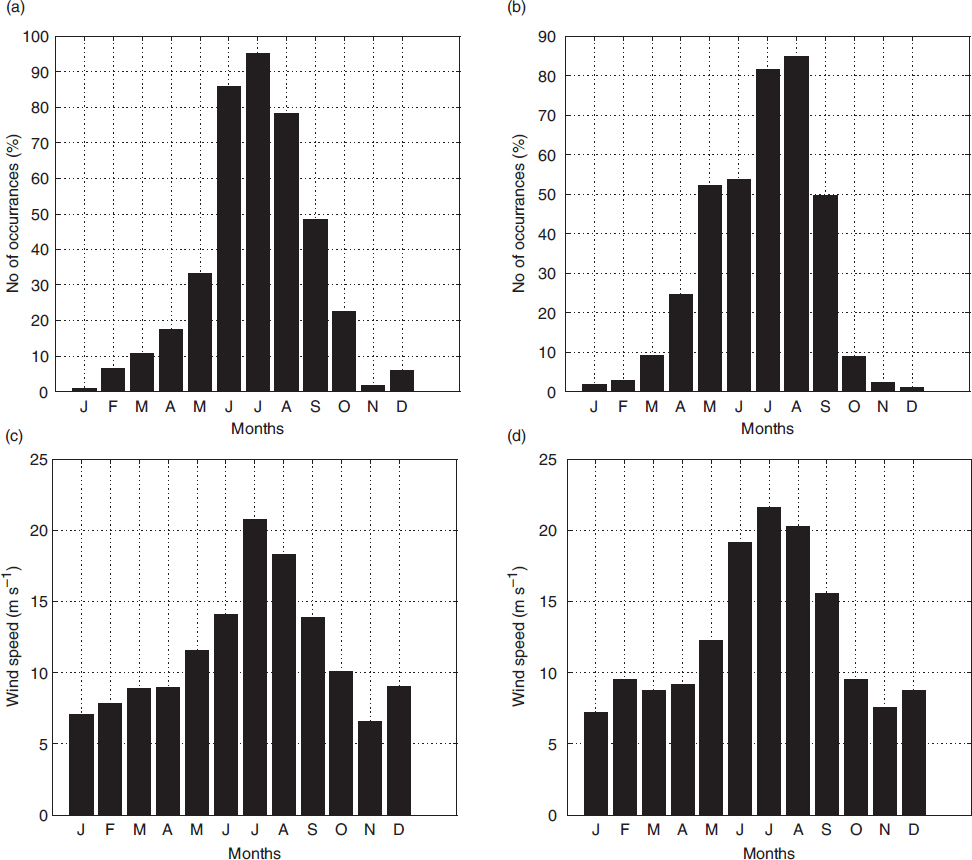
Fig. 3
Monthly mean maximum CLLJ frequencies of occurrence (%) for each month from ERA-Interim for an area coinciding with the inner modelling domain (see Fig. 1b) for (a) 2009, and (b) 1980–2011, and monthly mean of maximum wind speeds when CLLJs occur, for the same area, also from ERA-Interim, for (c) 2009, and (d) 1980–2011 (m s−1).
Table 1. Error statistics of COAMPS® innermost domain surface wind speeds against CCMP winds
Wind speed0.65−1.02.53.081.05u0.69−0.82.523.270.93v0.70−0.92.172.850.95
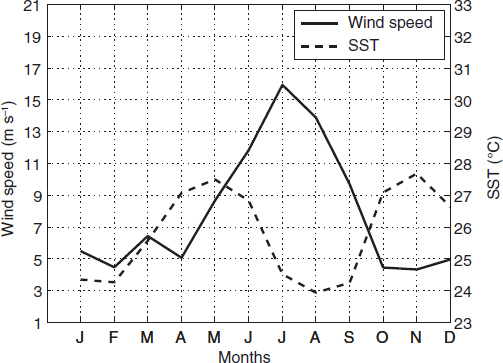
Fig. 4
Time series of monthly mean wind speed at ~400 m a.s.l. (m s−1) and SST (°C) for 2009, from ERA-Interim at point A (see Fig. 1b).
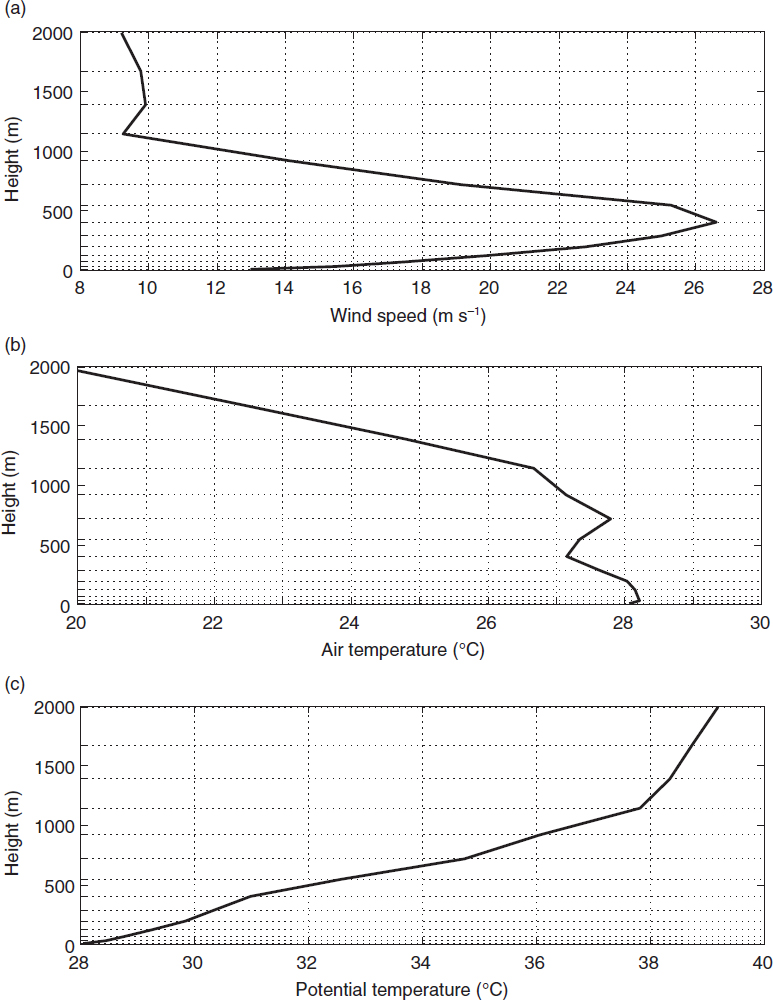
Fig. 5
Case-study vertical profiles from COAMPS®, of (a) wind speed (m s−1), (b) temperature (°C), and (c) potential temperature (°C) at point A, on 2 July 2009 at 20:00 LT (16:00 UTC). Ticks on the y-axis and corresponding grid lines represent the model vertical grid spacing.
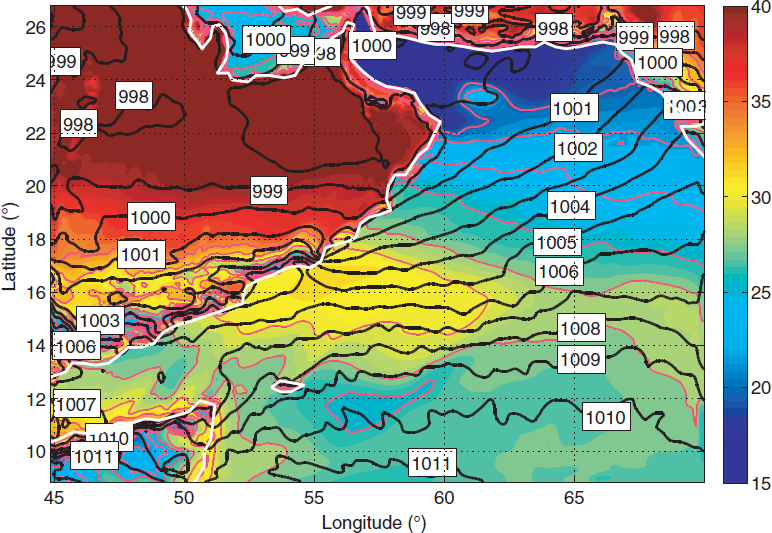
Fig. 6
Case-study horizontal fields from COAMPS® (2 July 2009 at 20:00 LT– 16:00 UTC) of temperature at 8 m (°C; background field and red lines) and MSLP (black lines with labels).
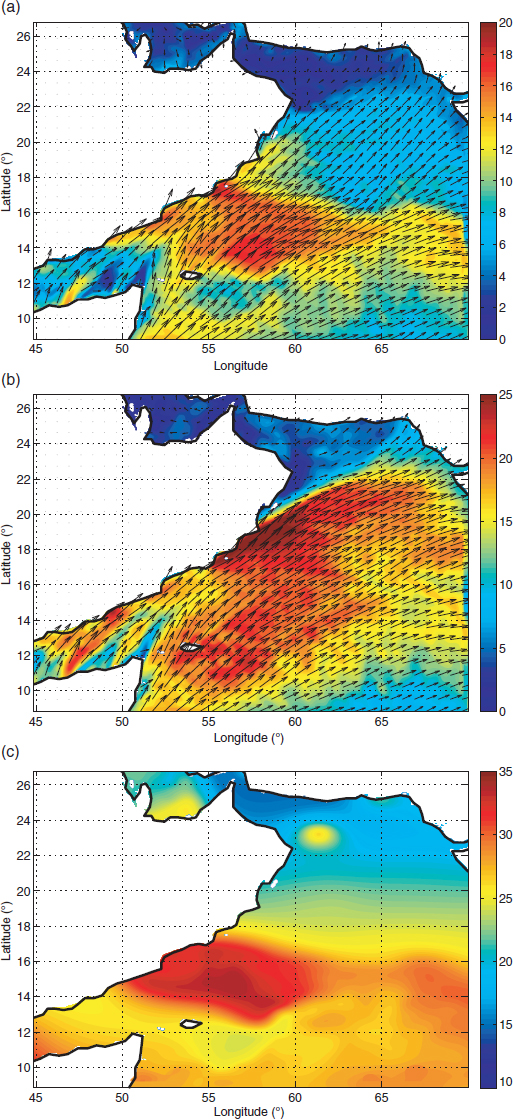
Fig. 7
Case-study horizontal fields from COAMPS® (2 July 2009 at 20:00 LT – 16:00 UTC) of (a) wind speed at 8 m (m s−1) a.s.l., (b) wind speed at ~400 m a.s.l. (m s−1), and (c) high-resolution SST (°C; from GHRSST) for the same day. The arrows represent the wind direction.
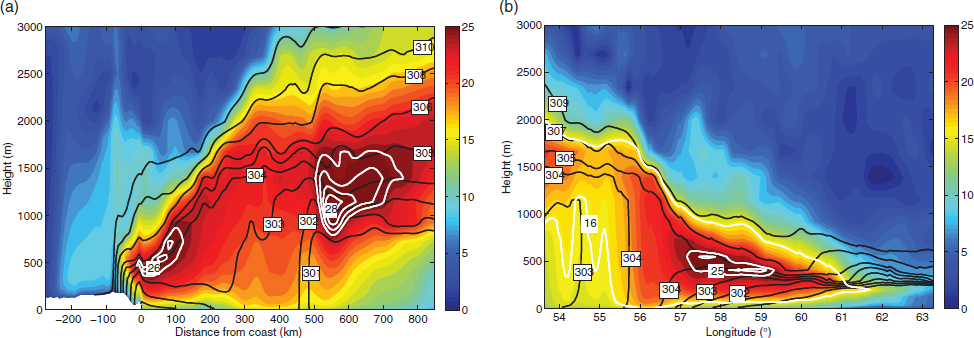
Fig. 8
Case-study vertical cross-sections from COAMPS® (2 July 2009 at 20:00 LT –16:00 UTC) of (a) cross-coast and (b) along-coast (see lines in Fig. 1b) of wind speed (m s−1; shading and selected white lines with labels) and potential temperature (K; black lines with labels).
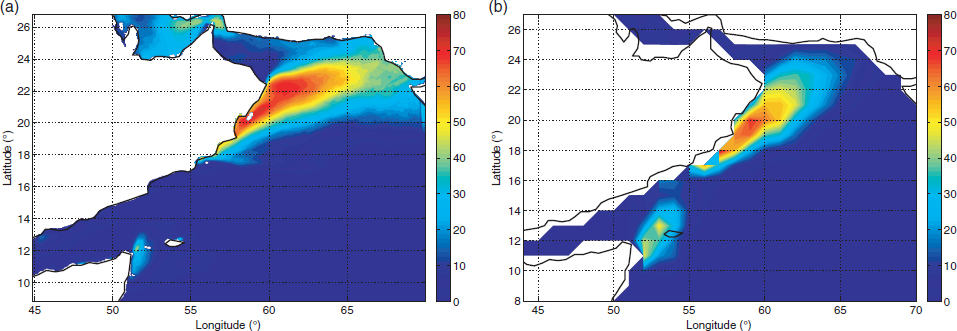
Fig. 9
CLLJ frequency of occurrence for JJA (%) (a) from COAMPS® results for the model inner domain (see Fig. 1b), and (b) from ERA-Interim.
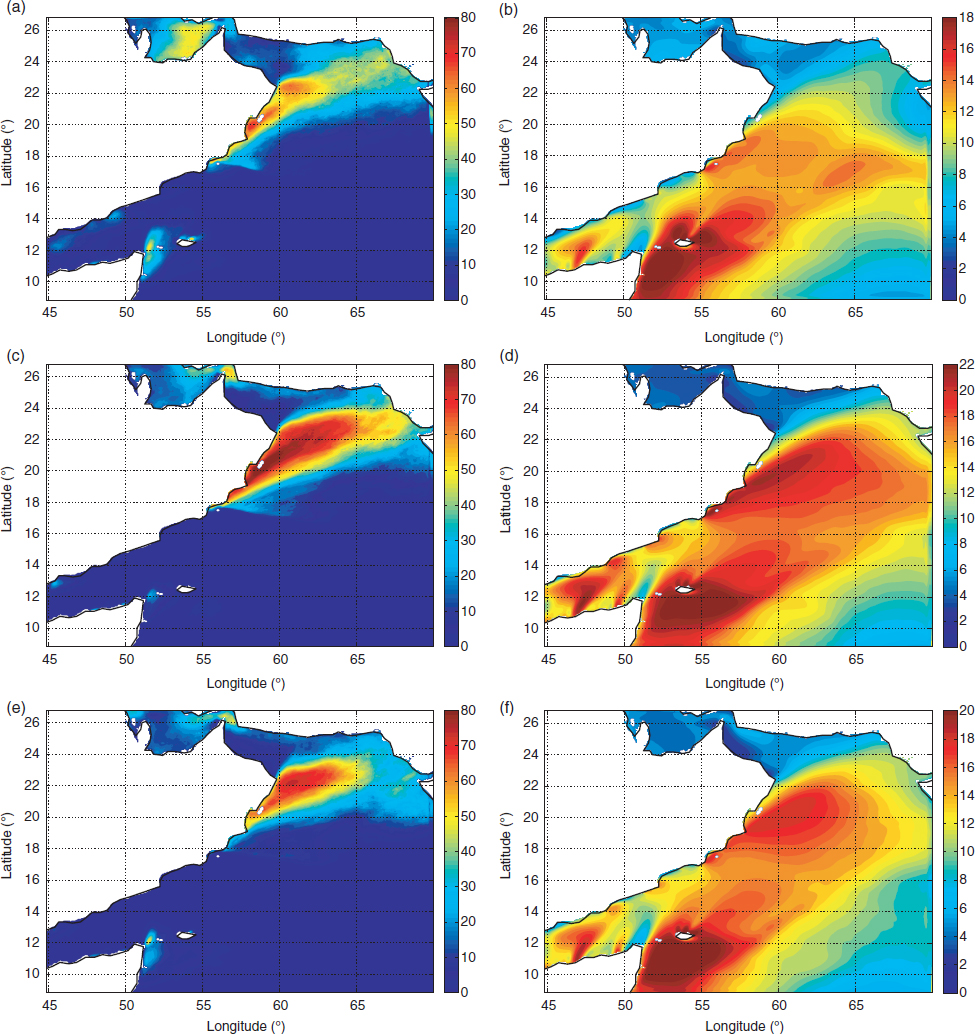
Fig. 10
Monthly (a, c and e) CLLJ frequency of occurrence (%), and (b, d and f) mean wind speed (contours) at 400 m a.s.l. (m s−1), from COAMPS®, for (a and b) June, (c and d) July, (e and f) August. Note the different colour scale in the wind speed plots, in accordance with monthly varying strength.
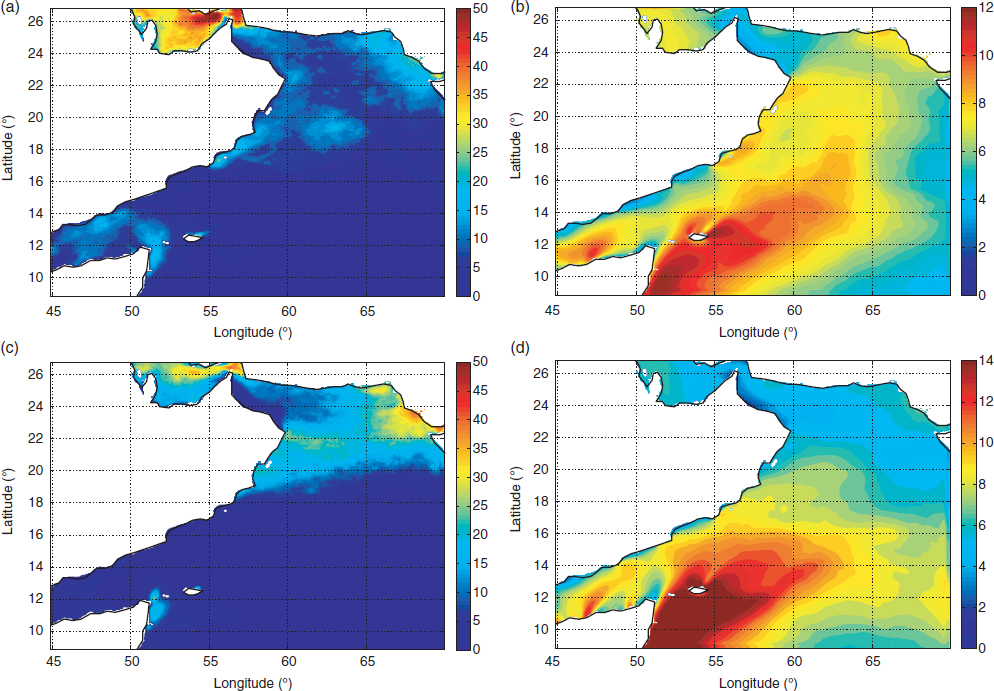
Fig. 11
Same as in Fig. 10 but for May (a and b) and September (c and d).
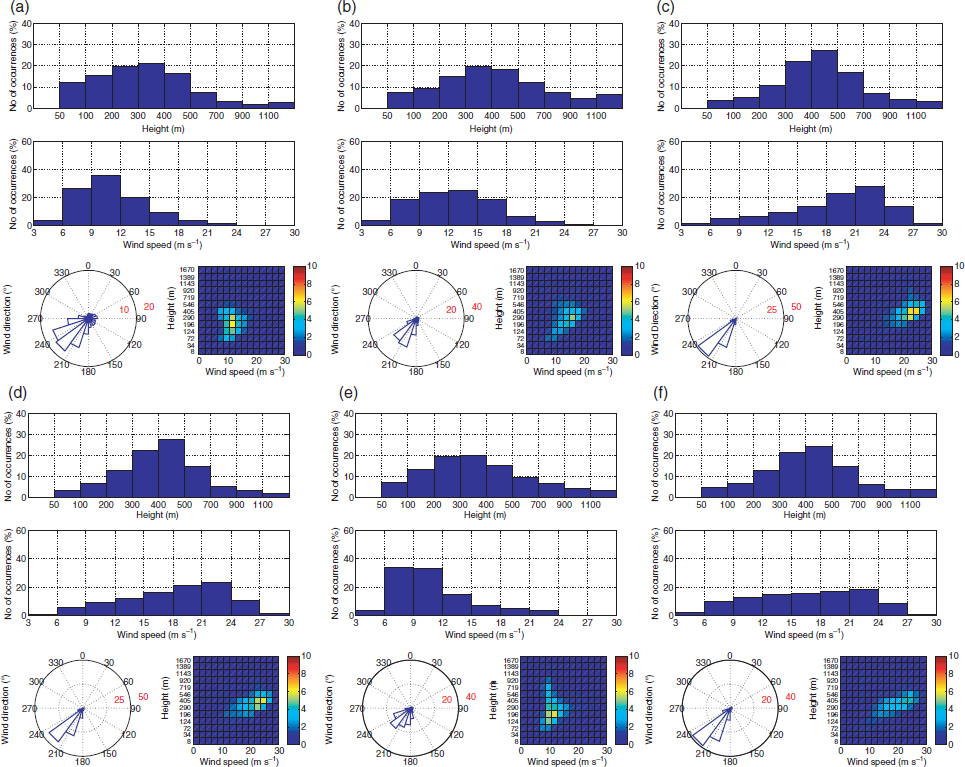
Fig. 12
CLLJ statistics for (a) May, (b) June, (c) July, (d), August, (e) September and (f) JJA, based on COAMPS® inner domain results for year 2009. Each panel comprises histograms of frequency of occurrence of CLLJ maxima height (m; top), wind speed (m s−1; middle), direction (0; lower left) and 2-D histogram of jet height and wind speed (%; lower right).
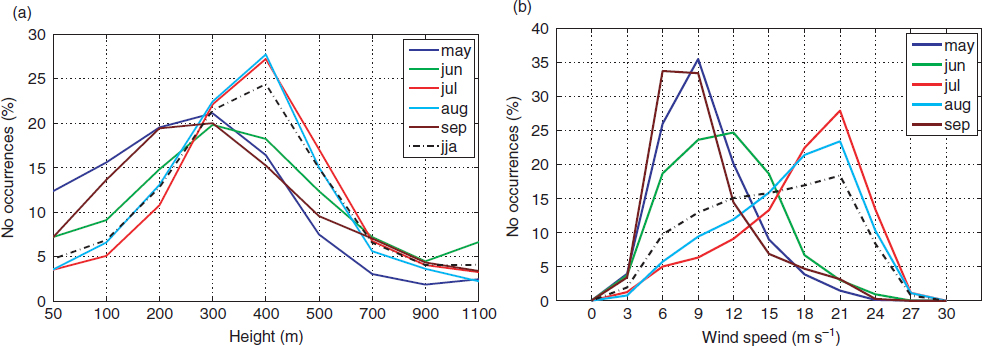
Fig. 13
Probability density functions for (a) height of CLLJ maxima and (b) wind speed for the May through September and for JJA from COAMPS®.
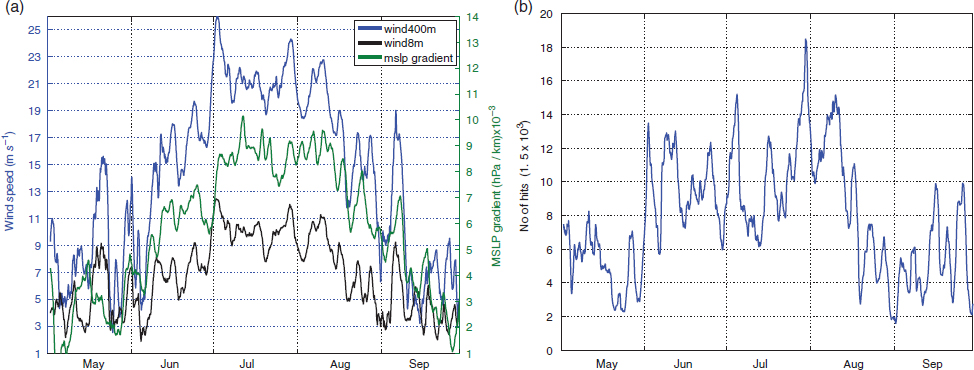
Fig. 14
Daily running average of (a) MSLP differences (hPa) between points L1 and H1 (see Fig. 1b), and wind speed at 8- and ~400 m a.sl. at point A (m s−1) and (b) number of CLLJ counts for entire inner COAMPS® domain, with masked land, for May–September.
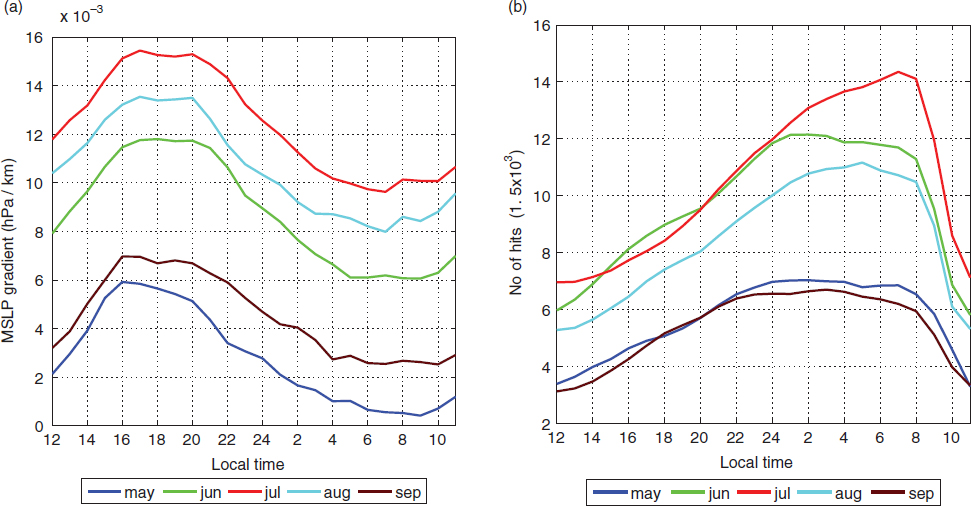
Fig. 15
Mean monthly diurnal cycles from COAMPS® for May through September of (a) MSLP gradient (hPa/km) between points L2 and H2 and (b) number of CLLJ counts for point A. See Fig. 1b for geographical references.
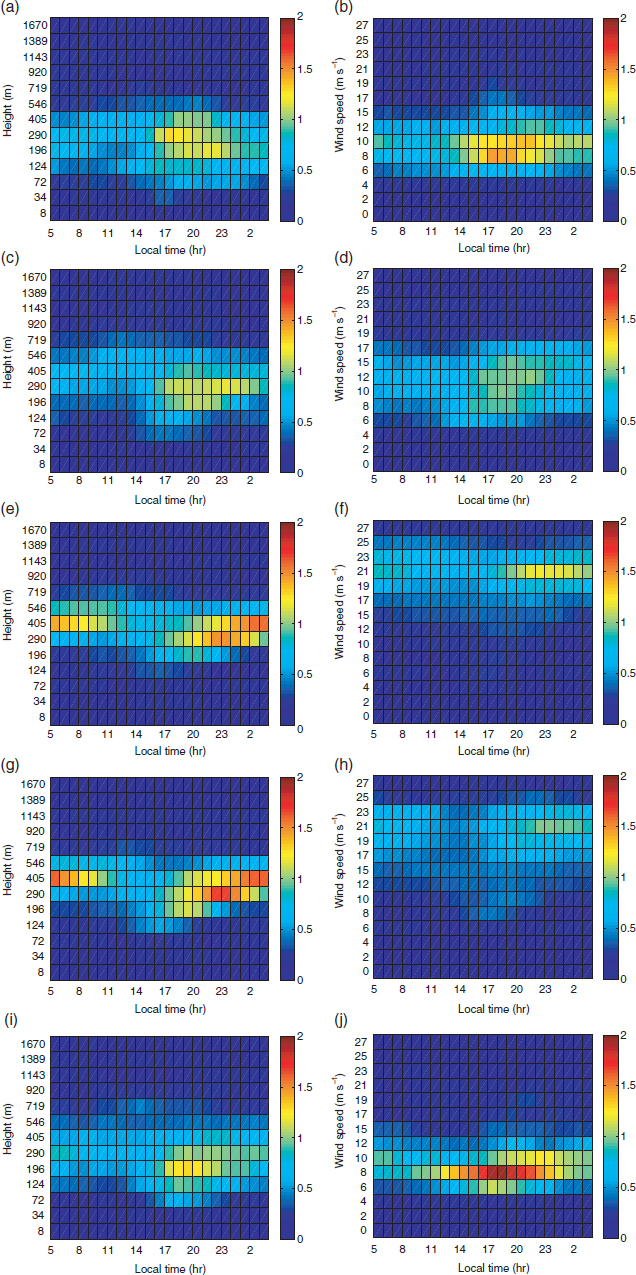
Fig. 16
Two-dimensional probability of the mean monthly diurnal cycles of (a, c, e, g, i; left column) jet heights and (b, d, f, h, j; right column) wind speed for (from top to bottom) May, June, July, August and September.