
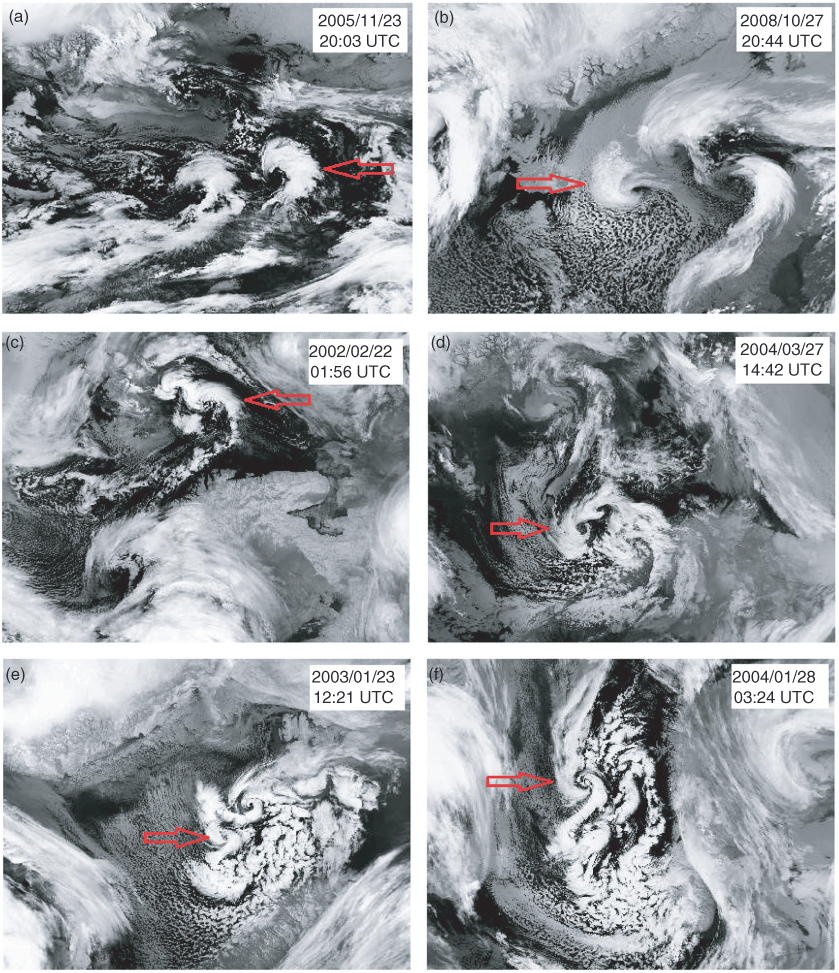
Fig. 1
Different examples of multiple systems: (a) a dual system, (b) a multiple system, (c) and (d) wave systems and (e) and (f) merry-go-round systems. Red arrows show the deepest lows.
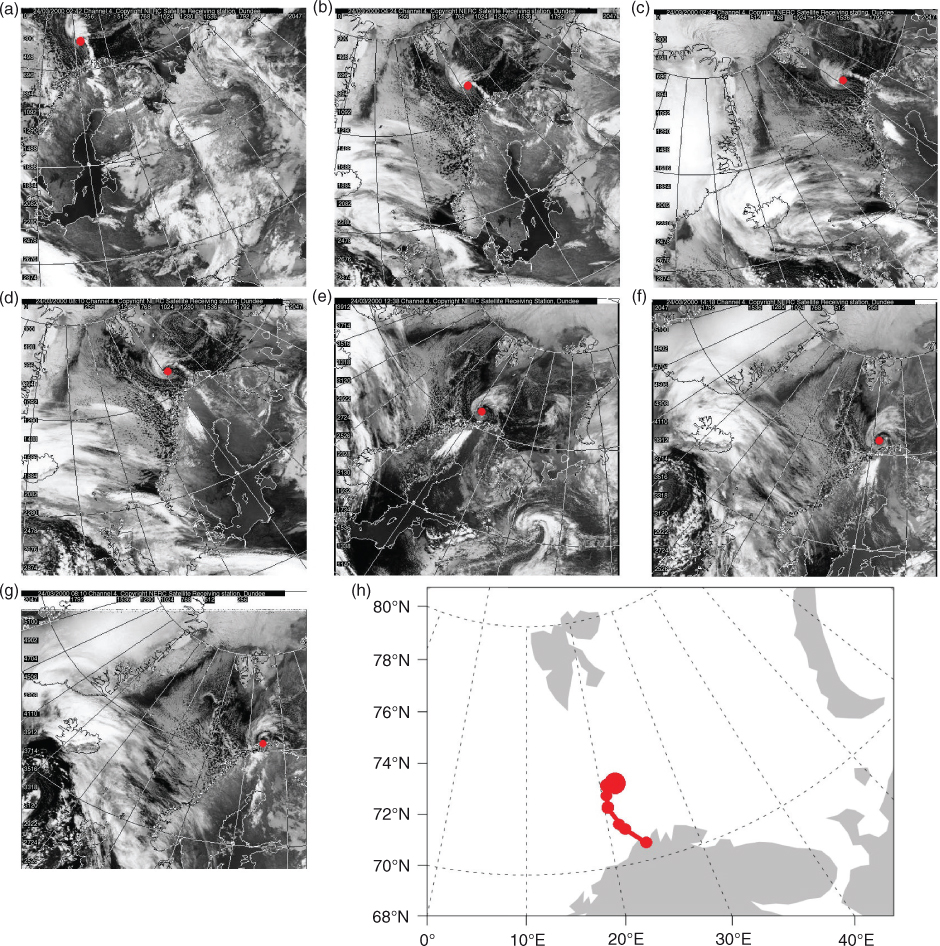
Fig. 2
Example of a PL manual tracking using AVHRR images for the PL event of 24/03/2000. On initial images (a, b and c), a comma-shaped PL forms between Svalbard and Norway. As it moves southward, the PL changes to a spiraliform system (transition stage on image (d)). On the last image (g), the PL decays over the coast of Finnmark (Norway). Red points show the centre of the PL. Image h shows the approximate track of this PL event.
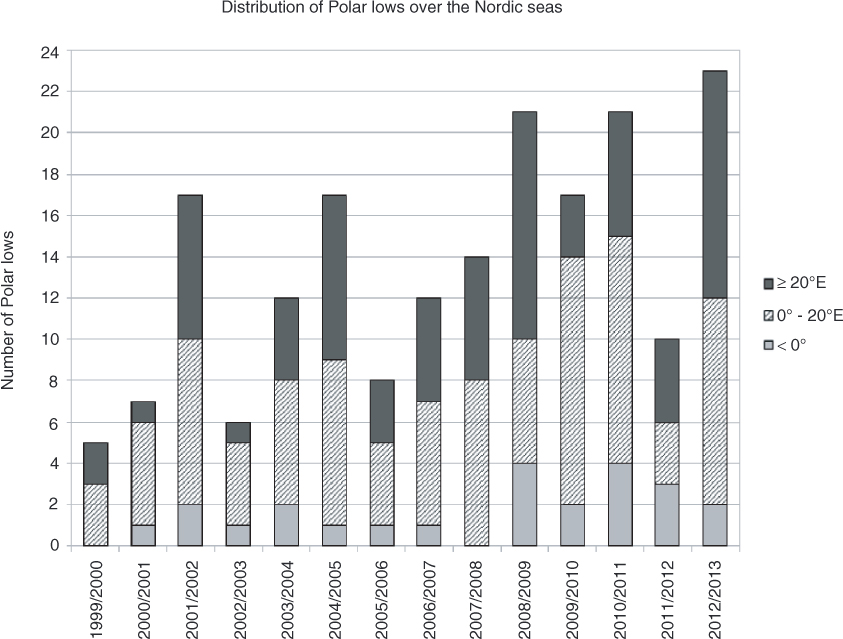
Fig. 3
Inter-annual variability of PLs over the Nordic Seas from winter 1999/2000 to winter 2012/2013. Polar lows that form over the Greenland Sea (west of 0°) are represented in light grey, those that form over the Norwegian Sea (between 0° and 20°E) are represented in striped black and white and those that form over the Barents Sea (east of 20°E) are represented in dark grey.
Table 1. Monthly distribution of observed PLs over Nordic Seas for the 14-winter period
1999/2000–––12–2––52000/2001––––1231–72001/2002–141532–1172002/2003–––13–2––62003/2004–1–5222––122004/2005––523142–172005/2006–1211–3––82006/2007–11242–2–122007/20081––12262–142008/2009–1613514–212009/2010––––33911172010/2011–233328––212011/2012––12–232–102012/2013–1–112135–23Total182221332658192190Average frequency0.070.571.621.502.362.044.141.400.1413.57
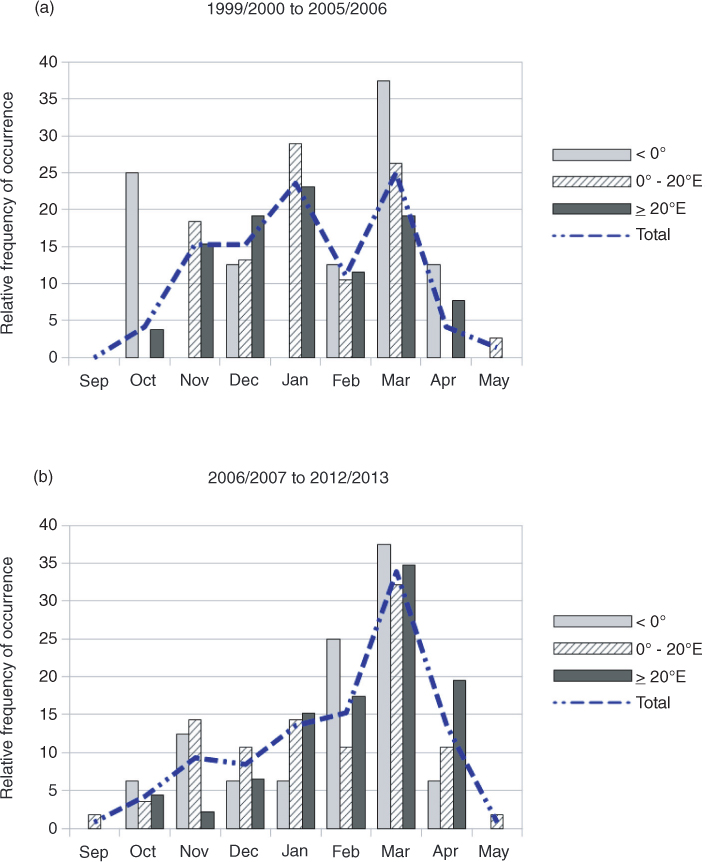
Fig. 4
Monthly distribution of PLs over Nordic Seas found from (a) winter 1999/2000 to winter 2005/2006 and (b) winter 2006/2007 to winter 2012/2013. Number of PLs per category for the period 1999/2006: eight PLs for≤0°, 38 PLs for>0°–20°E <and 26 PLs for≥20°E. Number of PLs per category for the period 2006/2013: 16 PLs for≤0°, 56 PLs for>0°–20°E<and 46 PLs for≥20°E.
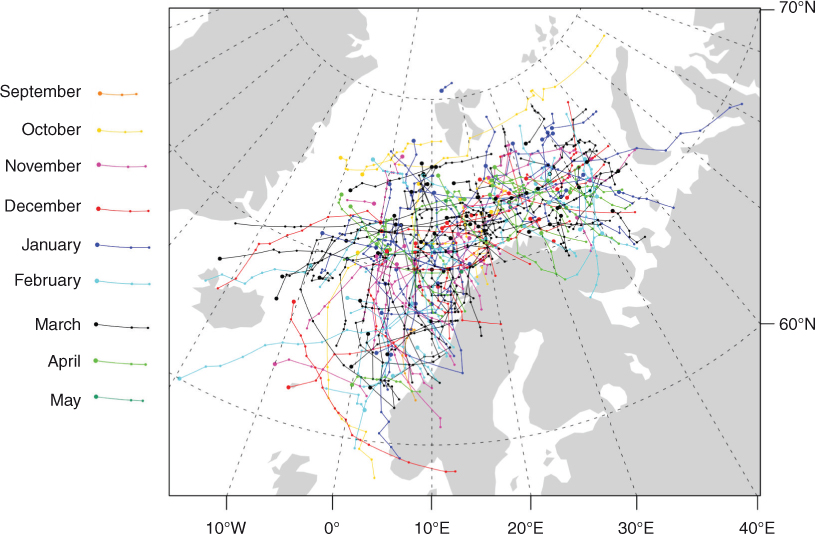
Fig. 5
The diagnosed 14-yr (winters 1999/2000 to 2012/13) polar low tracks over the Nordic Seas.
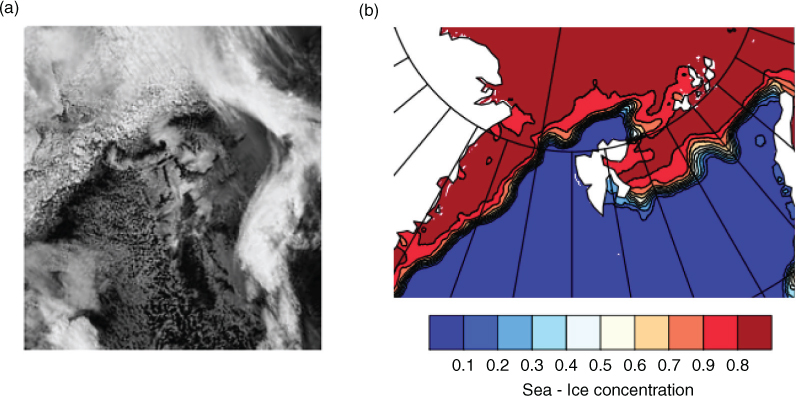
Fig. 6
(a) Image TIR AVHRR showing the northernmost case of PL, 8 January 2010 at 11:08 UTC. (b) Sea-ice concentration for the day 8 January 2010, data from OSTIA.
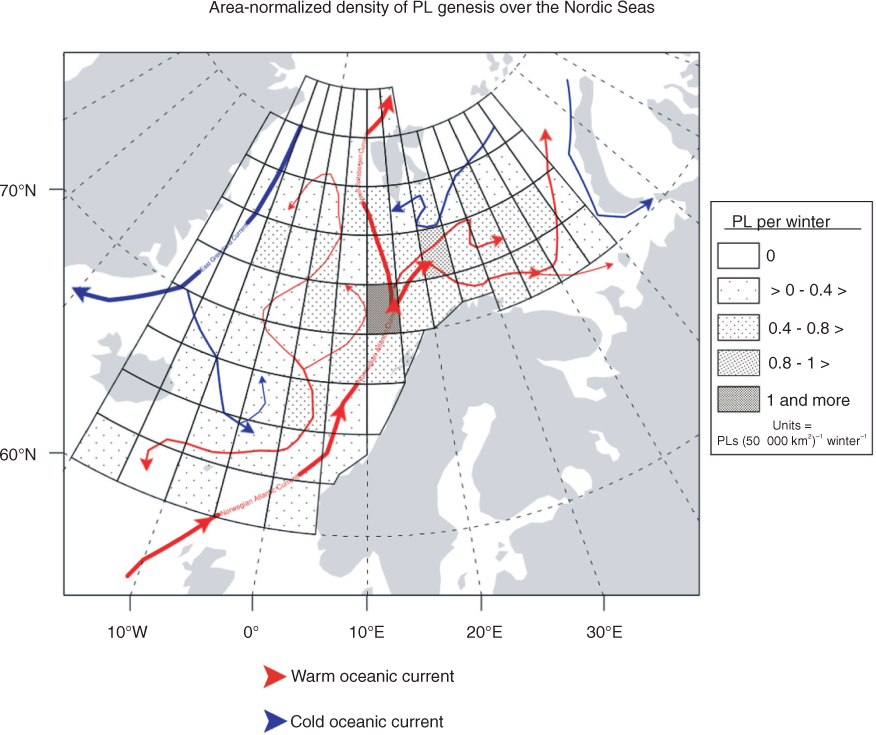
Fig. 7
Area of PLs genesis over the Nordic Seas from winter 1999/2000 to winter 2012/2013. Normalised distribution per winter [Units=PLs (50 000 km2)−1 winter−1]. Red and blue arrows show approximately the warm and cold ocean currents for the region of investigation.
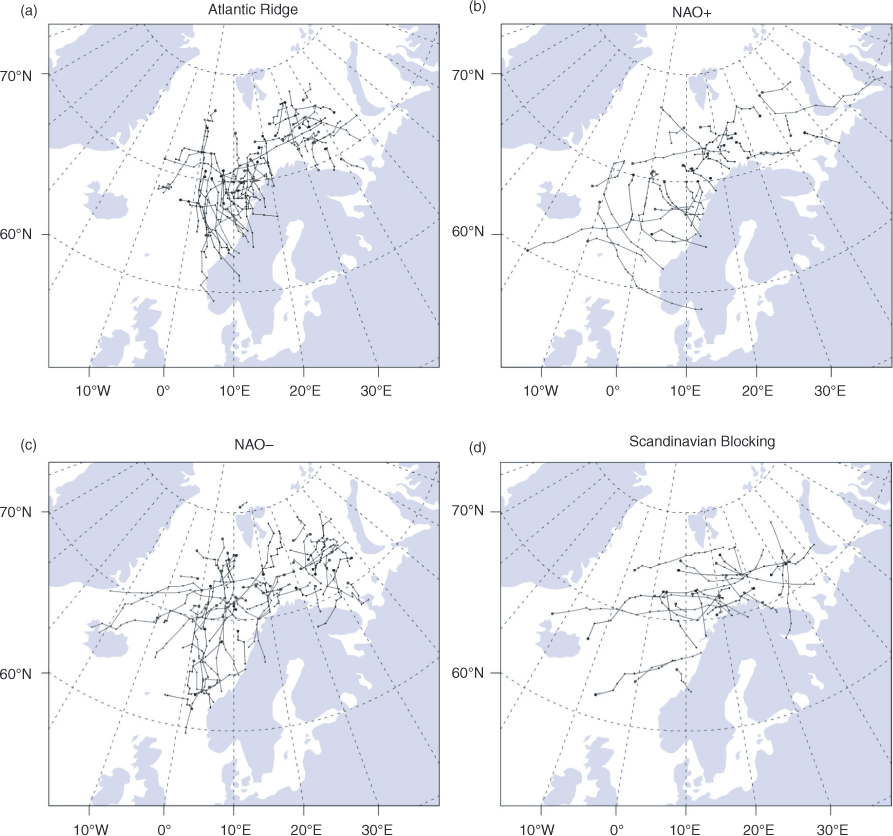
Fig. 8
The diagnosed 14-winter polar low tracks over the Nordic Seas according to weather regimes. (a) Atlantic Ridge, (b) NAO+, (c) NAO− and (d) Scandinavian Blocking.
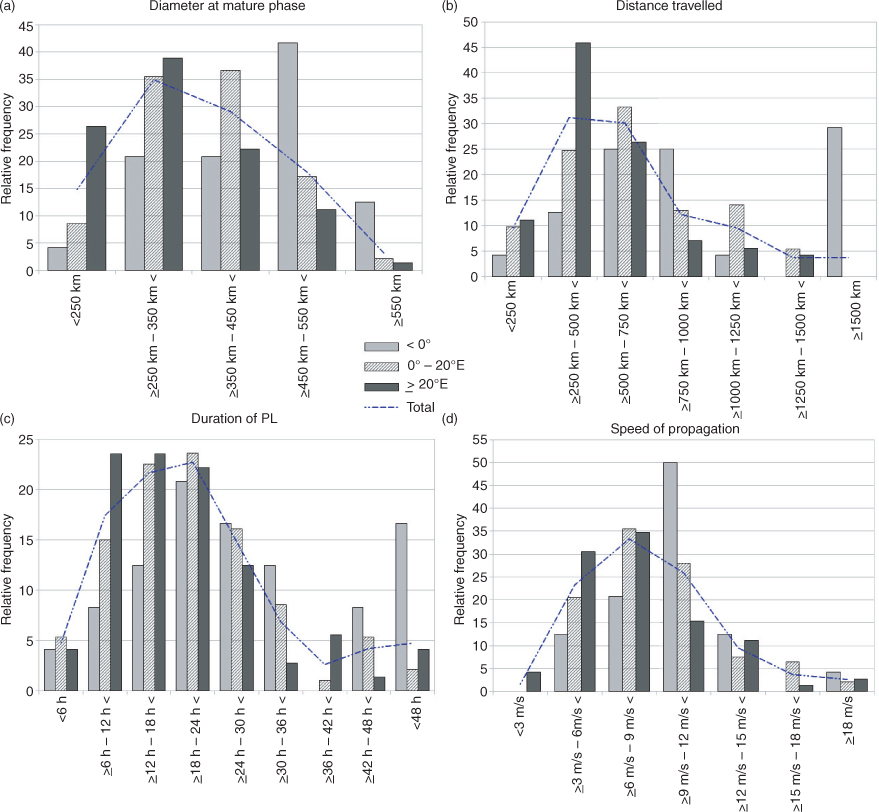
Fig. 9
PLs characteristics according to their genesis areas. (a) diameters, (b) total distance travelled, (c) lifespan and (d) speed of propagation. Number of PLs per category: ≤0° (24 PLs),>0°–20°E<(94 PLs), ≥20°E (72 PLs) and Total (190 PLs).
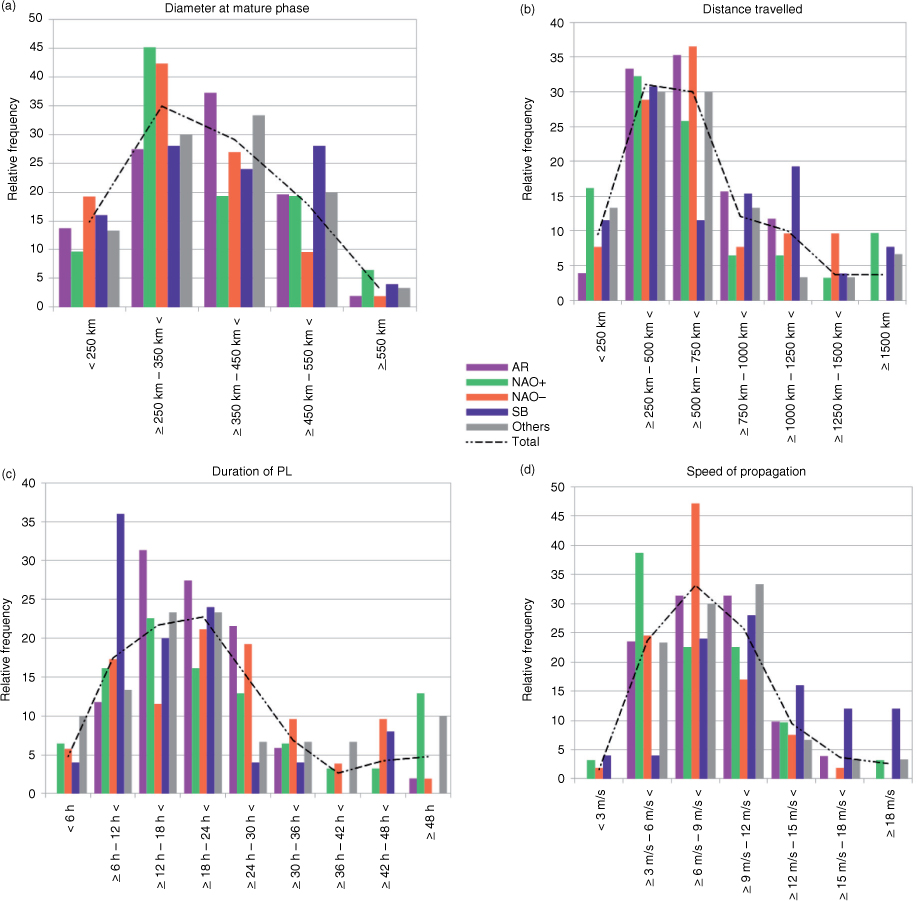
Fig. 10
PLs characteristics according to weather regimes. (a) diameters, (b) total distance travelled, (c) lifespan and (d) speed of propagation. Number of PLs per category: AR (51 PLs), NAO+ (31 PLs), NAO− (52 PLs), SB (26 PLs), Others (30) and Total (190 PLs).
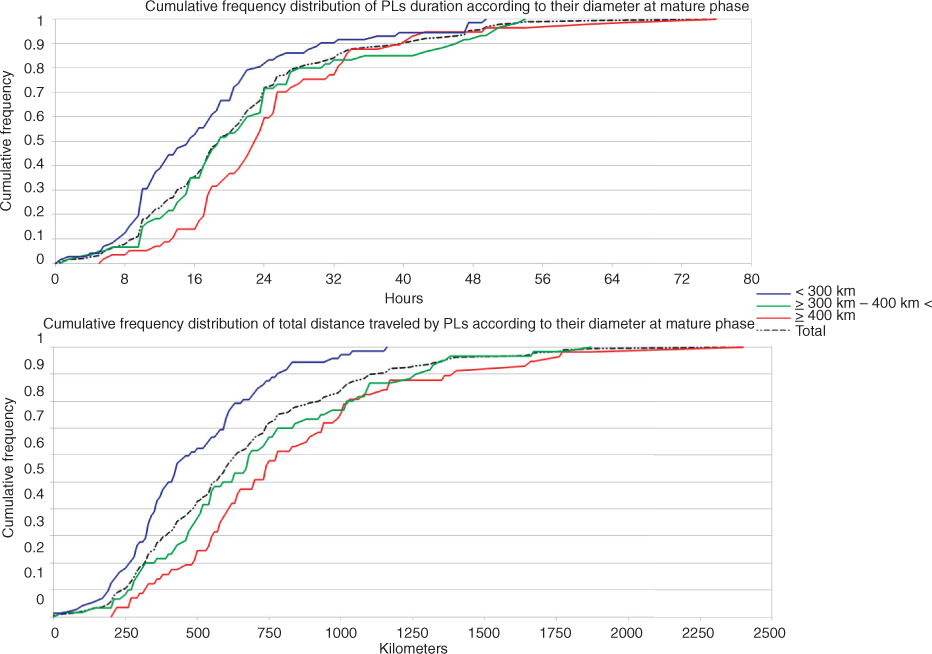
Fig. 11
Cumulative frequency distribution of PL duration and total distance travelled according to size at the mature phase. Blue line represents PLs which do not exceed 300 km at mature phase, green line represents PLs between 300 and 400 km at mature phase, red line represents PLs which exceed 400 km at mature phase and the black dashed line represents all the PLs observed in our study.
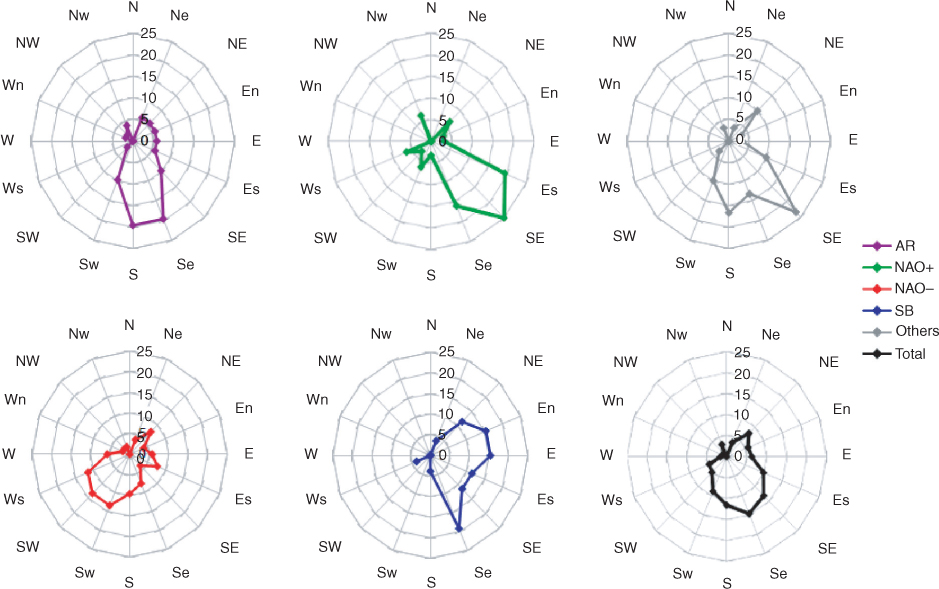
Fig. 12
Main directions (in percentage) of PLs over the Nordic Seas from winter 1999/2000 to winter 2012/2013, stratified by weather regimes.
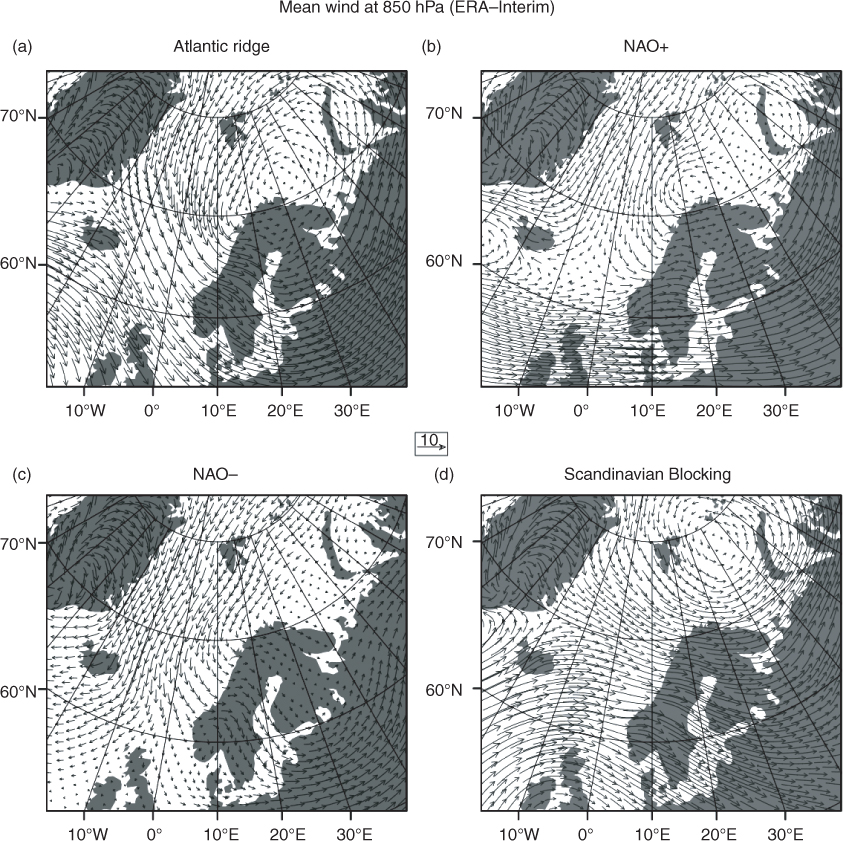
Fig. 13
Composite mean wind field at 850 hPa for PL events accompanying (a) AR, (b) NAO+, (c) NAO− and (d) SB configurations.
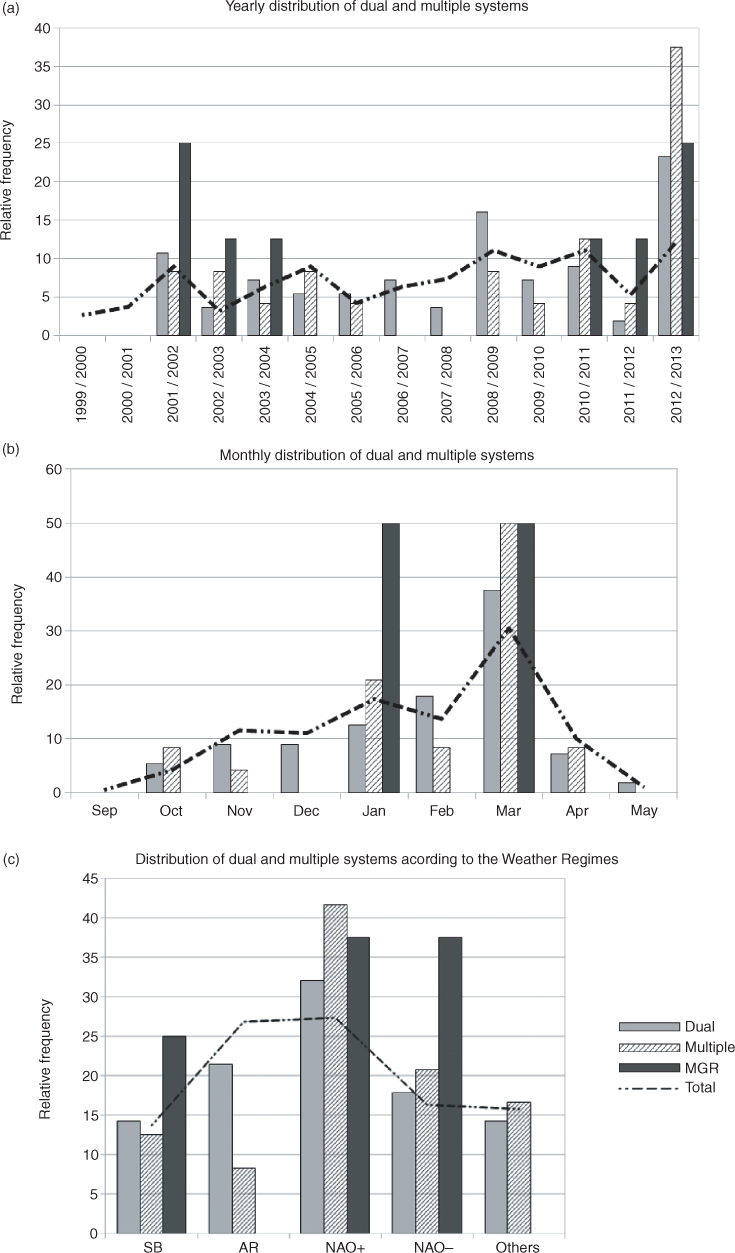
Fig. 14
Distribution (in percentage) of dual and multiple systems over Nordic Seas during the period 1999/2000 to 2012/2013. Parts (a) and (b) display the temporal distribution; (c) shows the distribution according to WRs.