
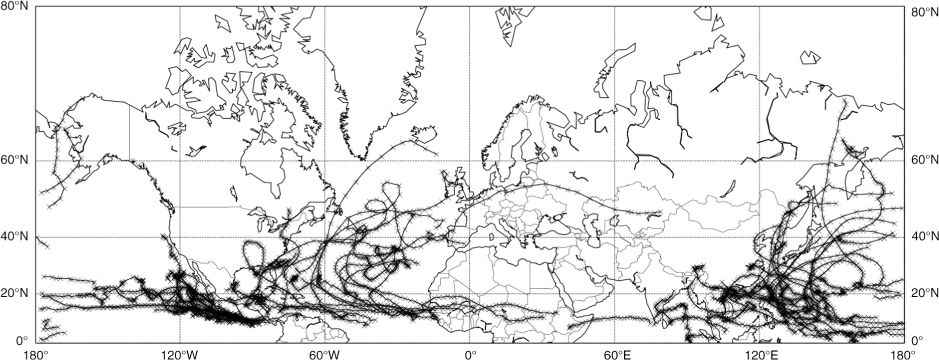
Fig. 1
Map of all storms in the dataset in 2012.
Table 1. All storms tracked in ECMWF operational analysis from 2008 to 2012. All these storms are used in the subsequent analysis
All basins3156967556262Atlantic Ocean72149191515E. Pacific Ocean811920121416W. Pacific Ocean1112527152024N. Indian Ocean3295783Tropical storm (<Cat. 1)1824343313728Category 1471088813Category 22655754Category 32756358Category 4 and 53265678
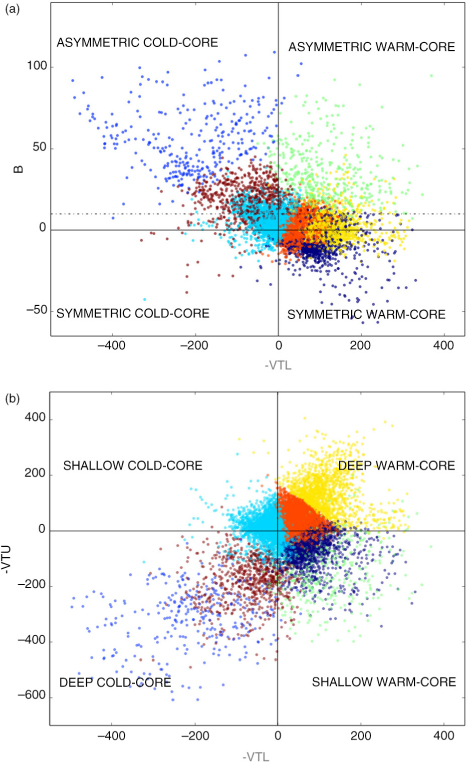
Fig. 2
Scatter plots of the K-means clustering (seven clusters) for all data points in the CPS. (a) Symmetry parameter against lower tropospheric thermal parameter. The dash line at B = 10 m is the point marking the onset of ET defined by Hart (2003). (b) Upper against lower troposphere thermal CPS parameters.
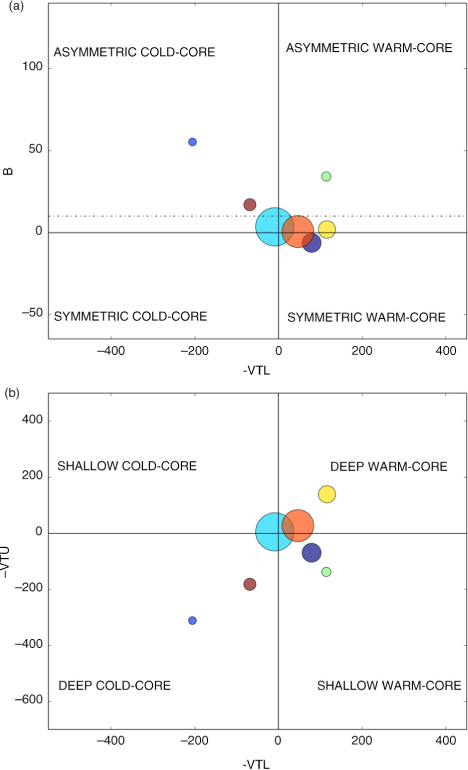
Fig. 3
Mean statistics of the K-means clustering (seven clusters) for all data points in the CPS (Hart, 2003). (a) and (b) as above. Each point corresponds to a cluster and represented with its size being proportional to the number of points in the cluster. The statistics for these clusters is shown in Table 2.
Table 2. Cluster characteristics
1Navy blue−5.083.5−52.523022Red15.8−70.1−191.58633Turquoise0.619.07.685284Yellow1.997.9117.722315Blue55.0−204.9−307.63946Light green33.5113.6−136.64807Orange8.0−28.213.42956
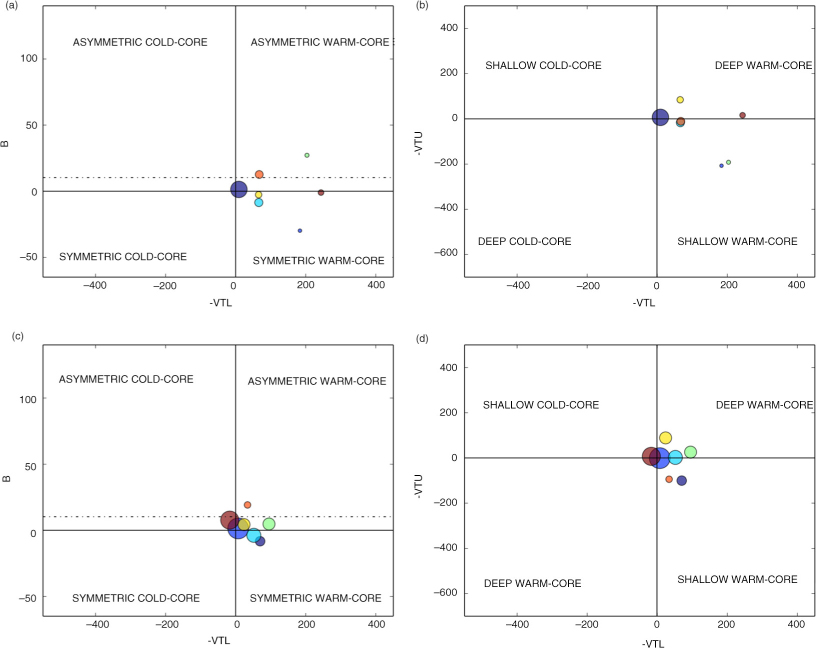
Fig. 4
Mean life-cycle stages for storm systems in (a) and (b) the northern Indian Ocean and (c) and (d) the eastern North Pacific. The size of the points is proportional to the number of points in the cluster. Note the same set of colours is used as in Fig. 4 but the same colour in different CPS diagrams do not correspond.
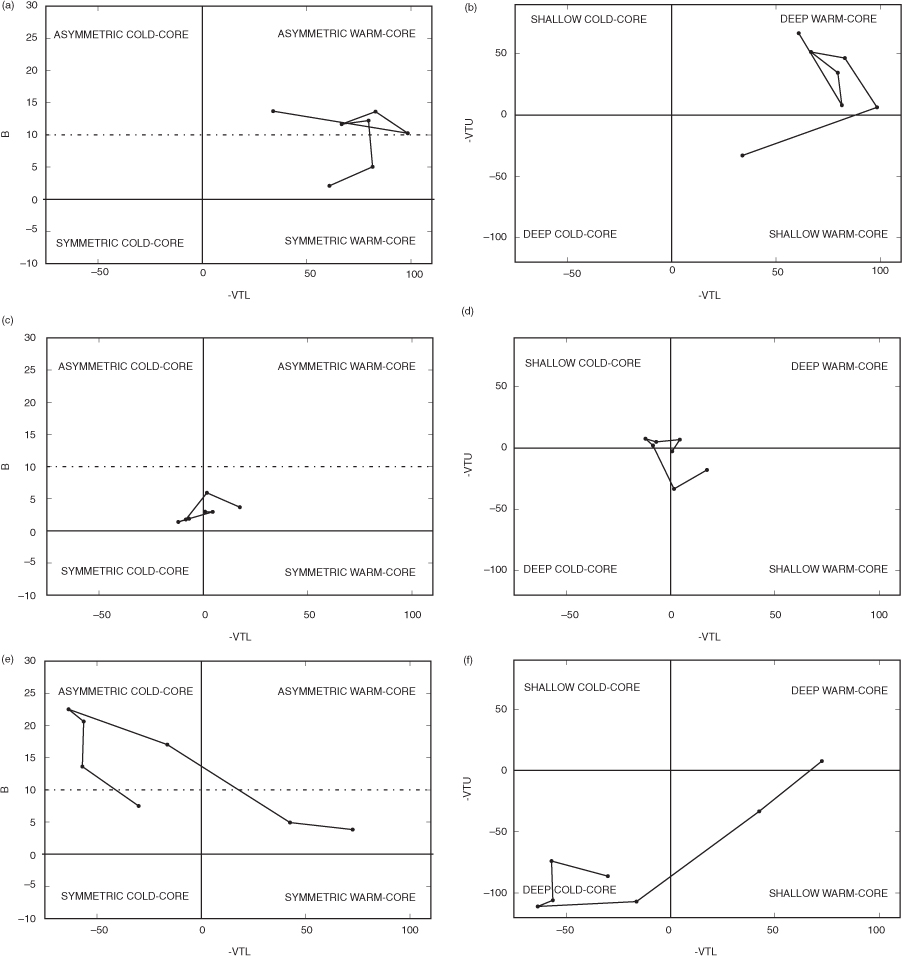
Fig. 5
Composite of extratropical transition for the Northern Hemisphere through the different pathways in the CPS. (a, b) Type one: asymmetric warm-core. (c, d) Type two: symmetric cold-core. (e, f) Type three: directly to asymmetric cold-core.
Table 3. Types of extratropical transition through the Cyclone Phase Space
OneVia asymmetric warm-core35% (648)TwoVia symmetric cold-core45% (846)ThreeDirectly to asymmetric cold-core20% (370)
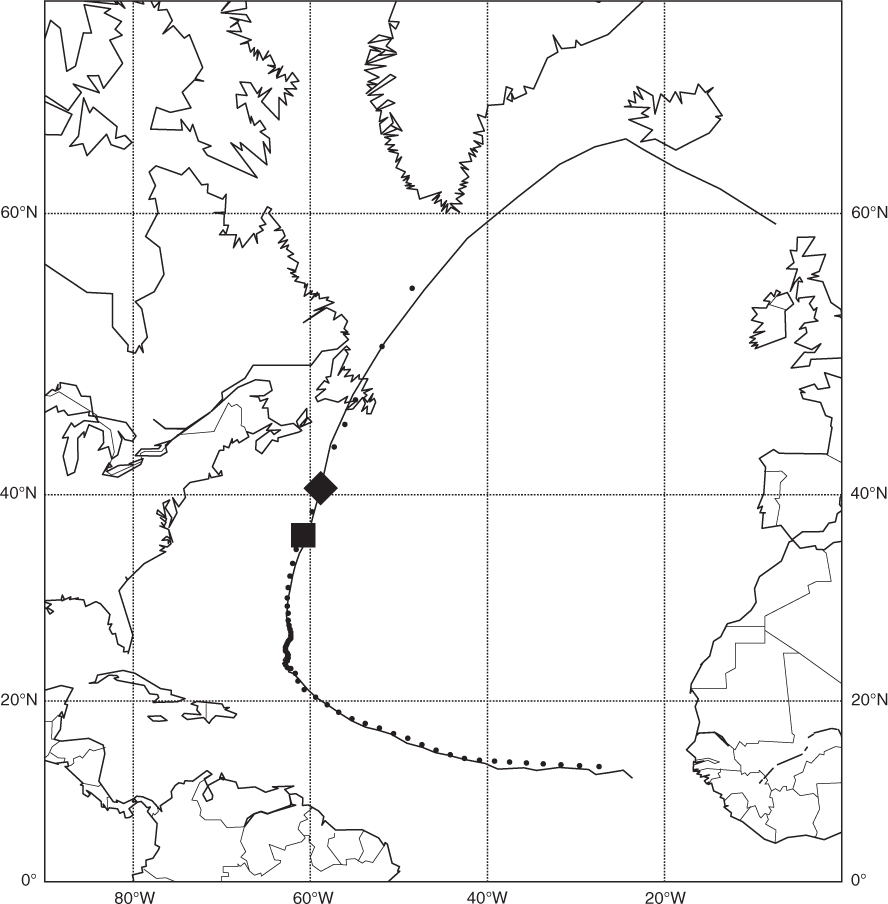
Fig. 6
The track of North Atlantic Hurricane Leslie in 2012. Solid black line is this analysis's storms track. Dots are the best track path of the storm (Stewart, 2013). The square is the location of the start of ET as declared in the best track archive and the diamond is the start of ET as determined by this methodology
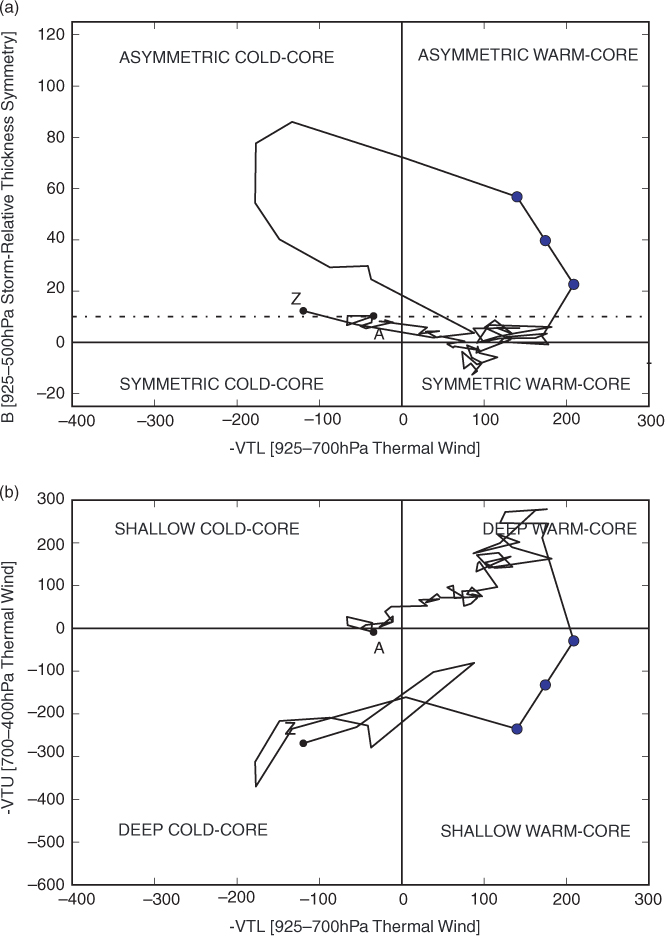
Fig. 7
The path of Hurricane Leslie through the CPS and ET determination. Points show period of extratropical transition. The green triangle marks the start of the track, and the red triangle the end point. (a) The CPS symmetry parameter against the lower tropospheric thermal parameter. (b) The upper and lower tropospheric thermal parameters of the CPS.
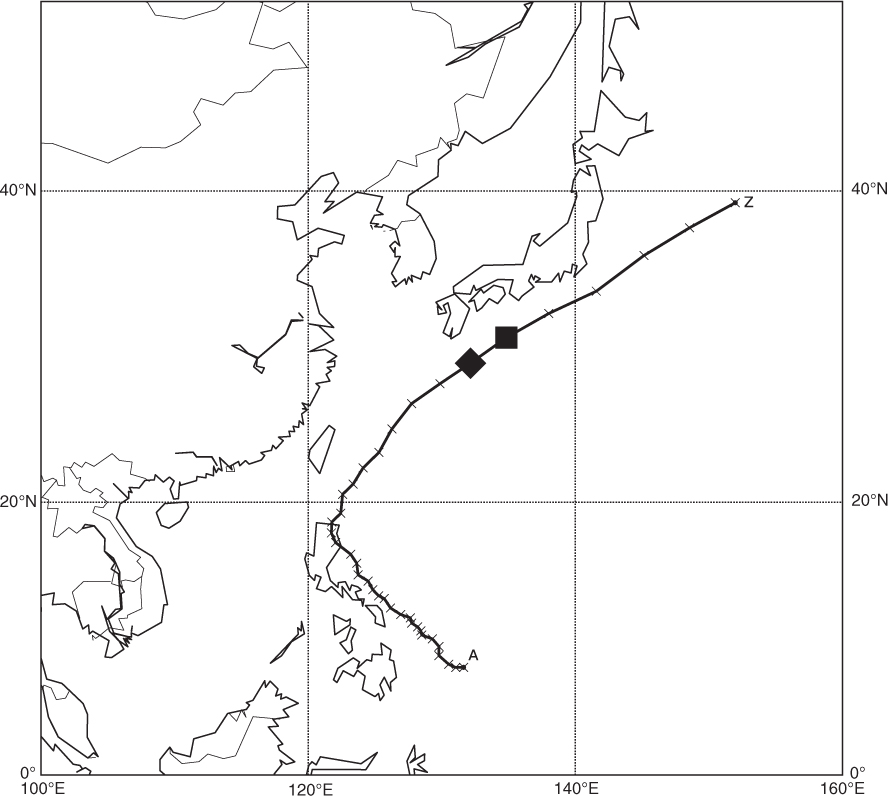
Fig. 8
The track of the western North Pacific tropical storm Aere (May 2011). The annotations A and Z mark the start and end of the track, respectively. The crosses that divide the track are the timesteps (every 6 hours) of the operational analysis. The square is the location of the start of ET as declared in Angove and Falvey (2011) and the diamond is the start of ET as determined by this methodology.
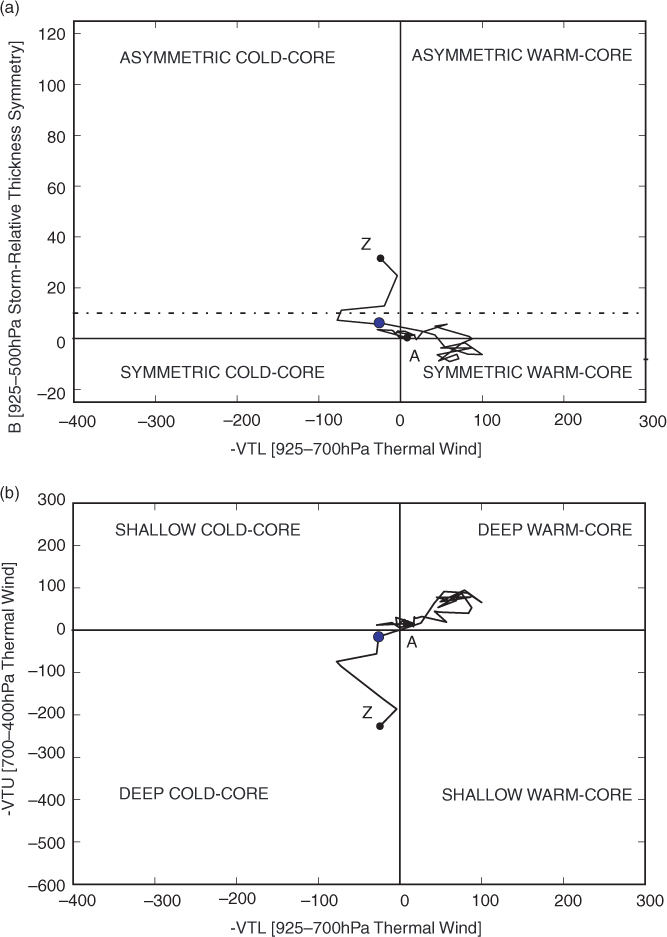
Fig. 9
The Cyclone Phase Space diagram for the tropical storm Aere, 2011. Point shows period of extratropical transition. The annotations A and Z mark the start and end of the track, respectively. (a) The CPS symmetry parameter against the lower tropospheric thermal parameter. (b) The upper and lower tropospheric thermal parameters of the CPS.
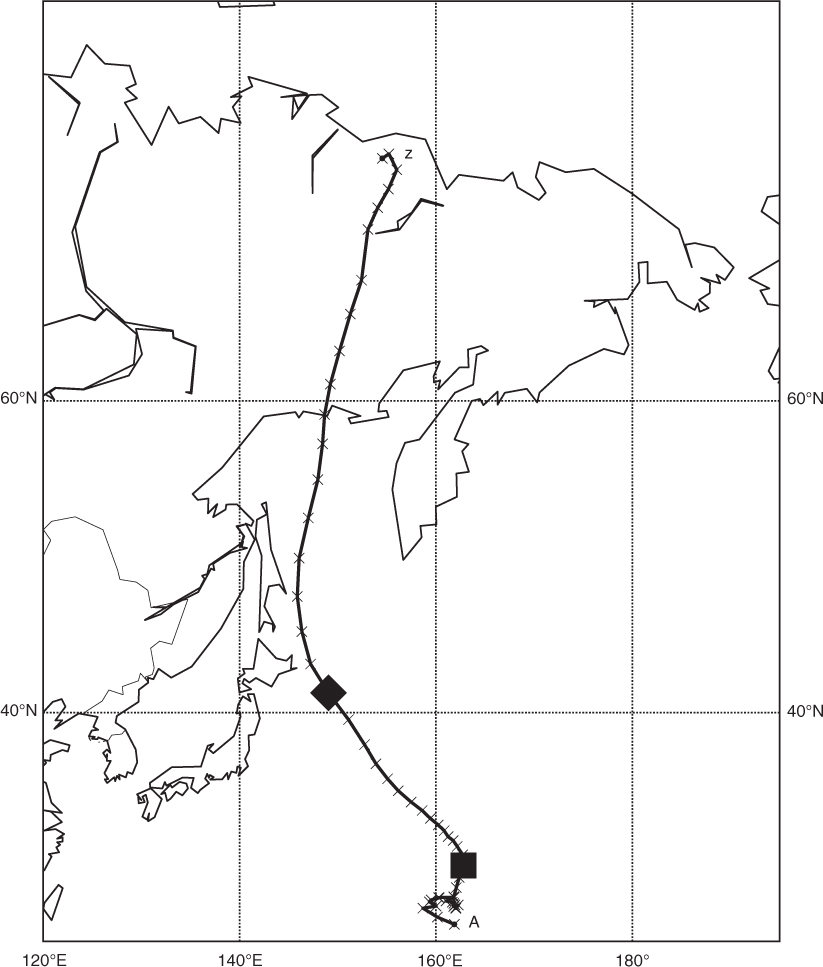
Fig. 10
The track of western North Pacific severe tropical storm Kirogi, August 2012. The square is the location of the start of ET as declared by the JTWC and the diamond is the start of ET as determined by this methodology.
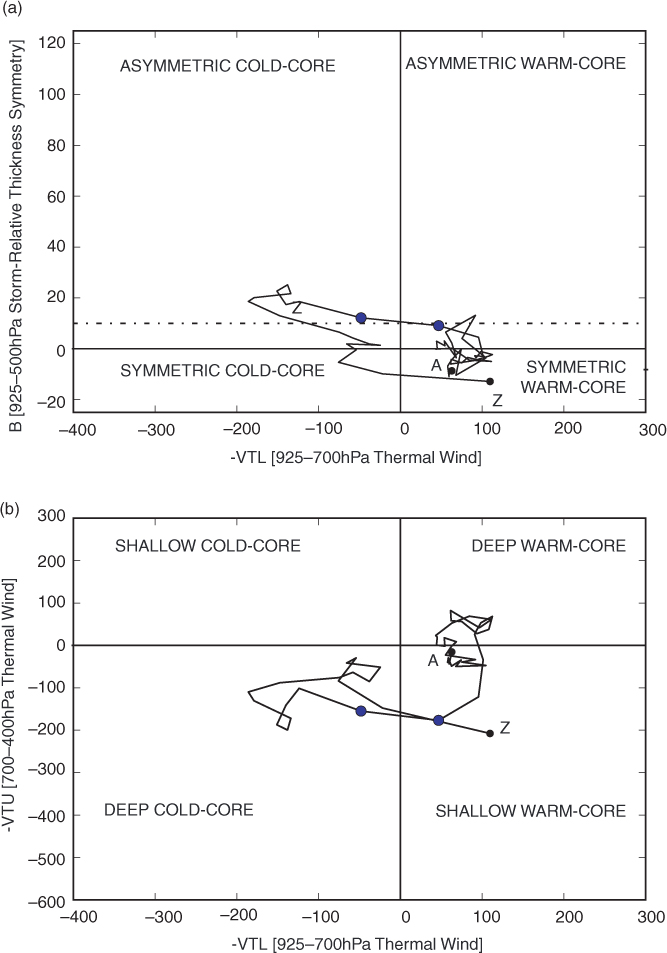
Fig. 11
The Cyclone Phase Space diagram for the severe tropical storm Kirogi, 2012. Points shows period of extratropical transition. The annotations A and Z mark the start and end of the track, respectively. (a) The CPS symmetry parameter against the lower tropospheric thermal parameter. (b) The upper and lower tropospheric thermal parameters of the CPS.
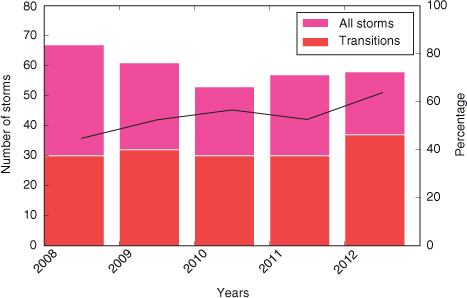
Fig. 12
Annual number of storms and determined transitions between 2008 and 2012. The lighter colour shows all storms and the darker only those that attempted extratropical transition. Percentage transition is shown with the black line on the second y-axis.
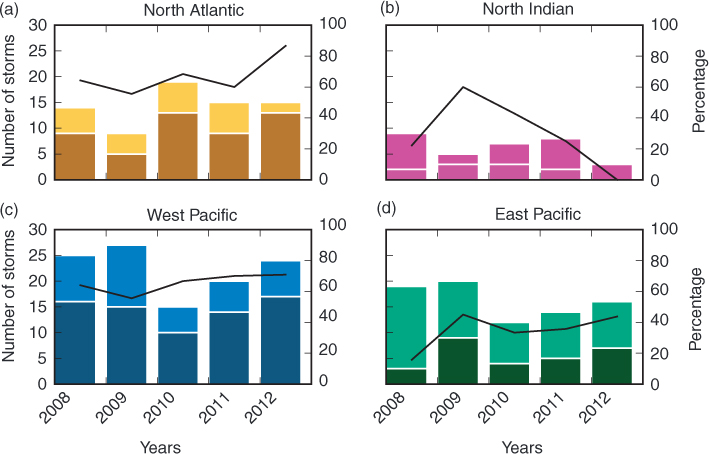
Fig. 13
Annual storm and transition totals between 2008 and 2012 by basin. (a) The North Atlantic, (b) the northern Indian, (c) the western North Pacific and (d) the eastern North Pacific. Lighter colours show all storms whilst darker colours only transitions. Percentage transitions are shown on the second y-axis with the solid black lines.
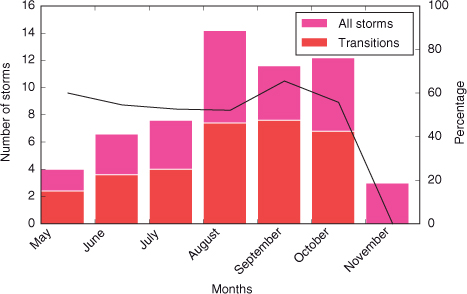
Fig. 14
Monthly distributions of storms and ET in the Northern Hemisphere. This is determined as the sum of the average of monthly totals across all basins in the years 2008–2012. The black line shows the percentage transition on the second y-axis.
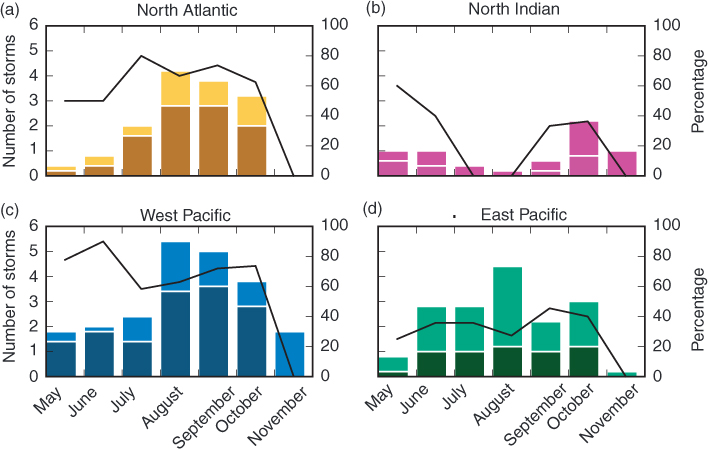
Fig. 15
Storm and transition monthly distributions across each of the four basins. (a) The North Atlantic, (b) the northern Indian, (c) the western North Pacific and (d) the eastern North Pacific. Darker colours show the number of storms that underwent ET compared to all the storms in the basin (lighter colour). Percentage transitions rates are shown on the second y-axis as the solid black line.
Table 4. Mean Hart parameters for extratropical transition determined from this dataset
Atlantic Ocean13.27.5N. Indian Ocean10.736.4W. Pacific Ocean12.89.5E. Pacific Ocean8.00.3Northern Hemisphere11.213.4
[i] The distribution for the four individual basins are shown in Fig. 16.
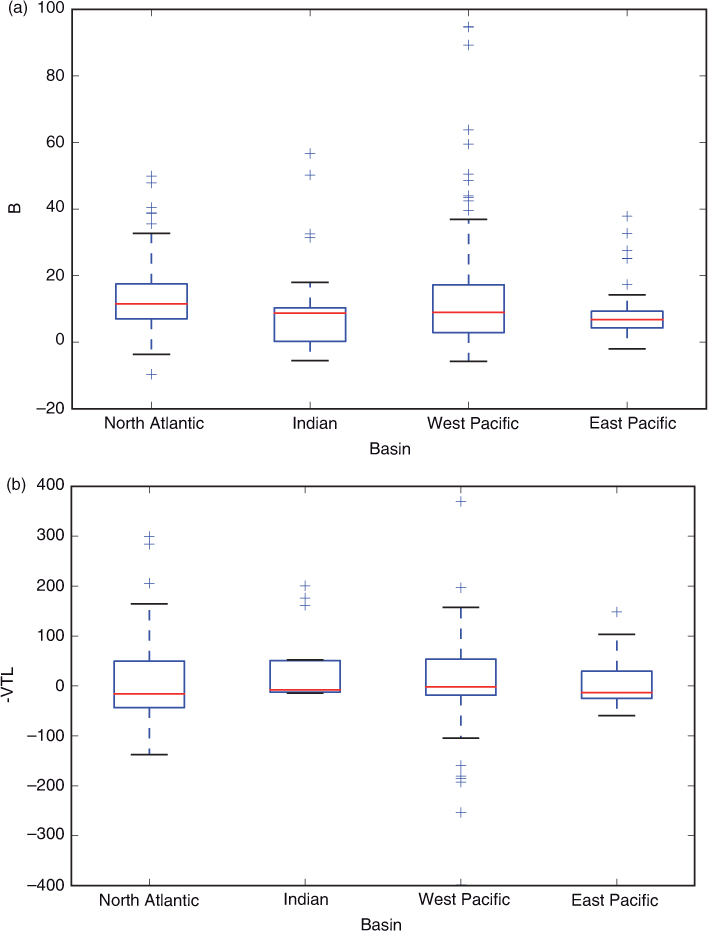
Fig. 16
Box and Whisker plots of CPS parameter across the four basins. (a) B at ET onset and (b) at ET completion.[10].