
Fig. 1
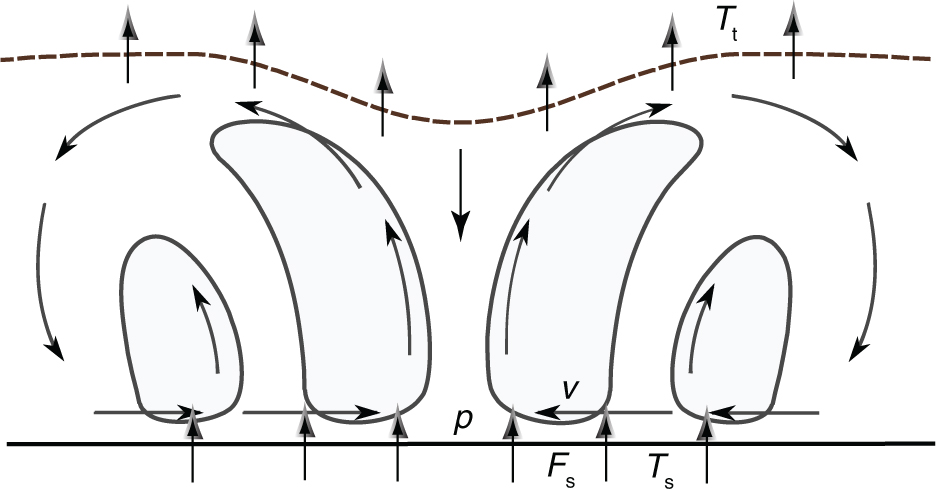
A schematic cross-section of a tropical cyclone. The air is heated at the sea surface with temperature T s and is cooled at the top of the troposphere with temperature T t. The heated air is ascending at the centre, and the cooled air is descending in the margin, thereby forming a circulatory motion.
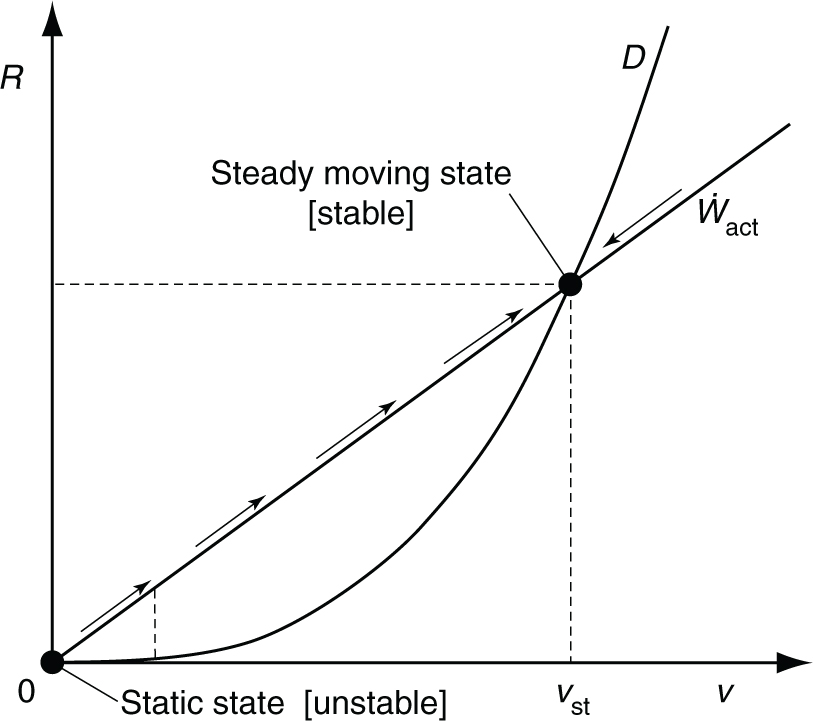
Fig. 2
The actual working rate act and the viscous dissipation rate D as functions of mean wind velocity v at the surface.
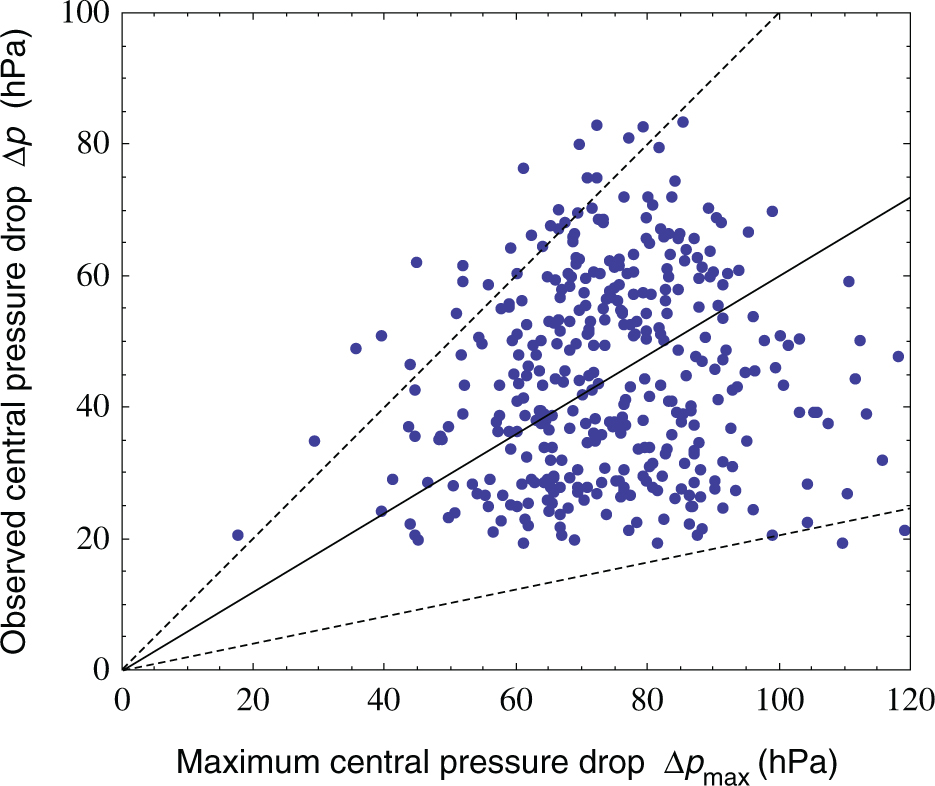
Fig. 3
Relation between the observational central pressure drop Δp and the maximum central pressure drop Δp max estimated from temperature and humidity profiles of the atmosphere at the sea surface. Each point indicates the relationship between Δp and Δp max averaged over a developed stage of a typhoon with an observed central pressure of less than 995 hPa. The gradient corresponds to the relative efficiency factor k in eq. (25). The solid line indicates k=0.6 and the dashed lines indicate k=0.2 and 1, respectively.
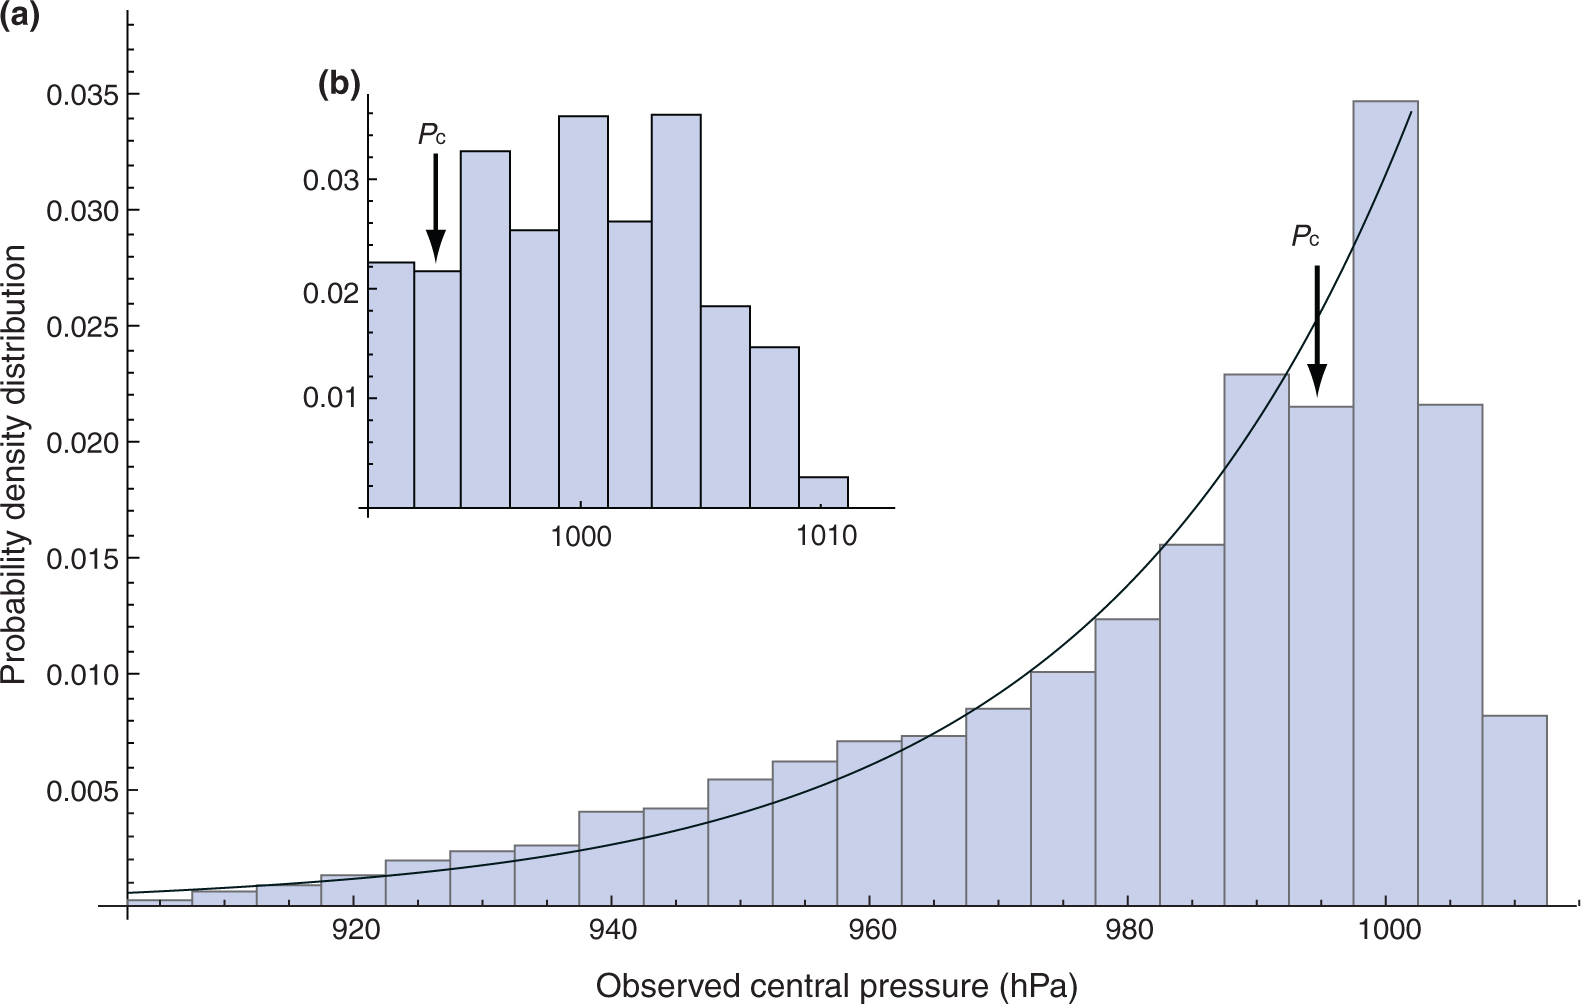
Fig. 4
Probability density distribution of central pressures observed for 633 typhoons over 23 yr from 1982 to 2005. (a) Distribution of central pressures between 905 and 1010 hPa, over bins of 5-hPa intervals; (b) distribution of central pressures between 992 and 1010 hPa, over bins of 2-hPa intervals. The superimposed line shows a best-fit exponential distribution: P(Δp)=C 1 exp (C 2 Δp), with C 1 =0.0545 hPa−1 and C 2 =0.0413 hPa−1, whereby statistical mean pressure depression is =1/C 2≈24 hPa. A slight deviation from the exponential distribution exists at the critical pressure of p c=995 hPa (arrows).
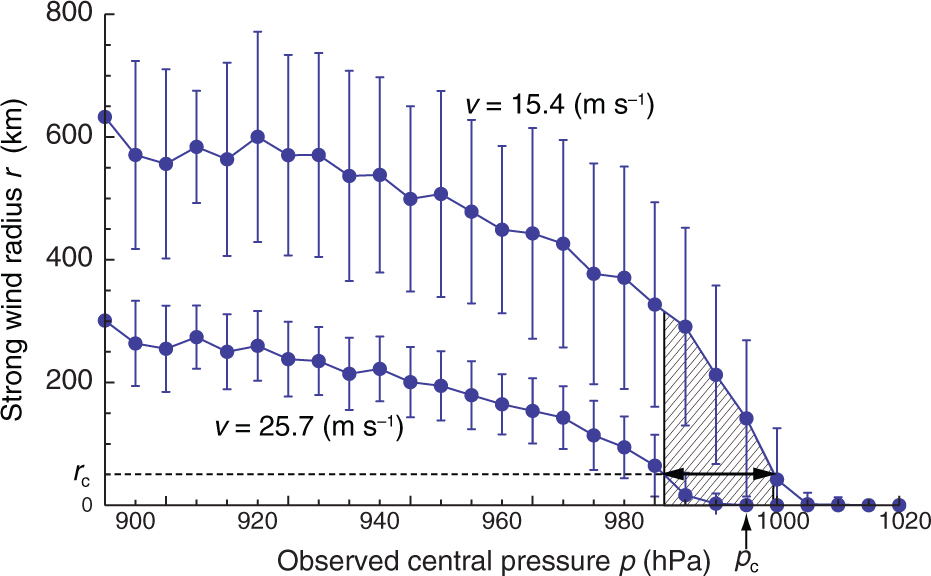
Fig. 5
Relation between observed mean radii of strong wind regions (v=15.4 m s−1 and v=25.7 m s−1) and central pressures observed for 633 typhoons over 23 yr. Solid curves with dots show the mean values, and the error bars show standard deviation. The shaded region corresponds to a pressure range where the radii exceed the critical size r c=50 km, and where the radii increase rapidly with decreasing central pressure.
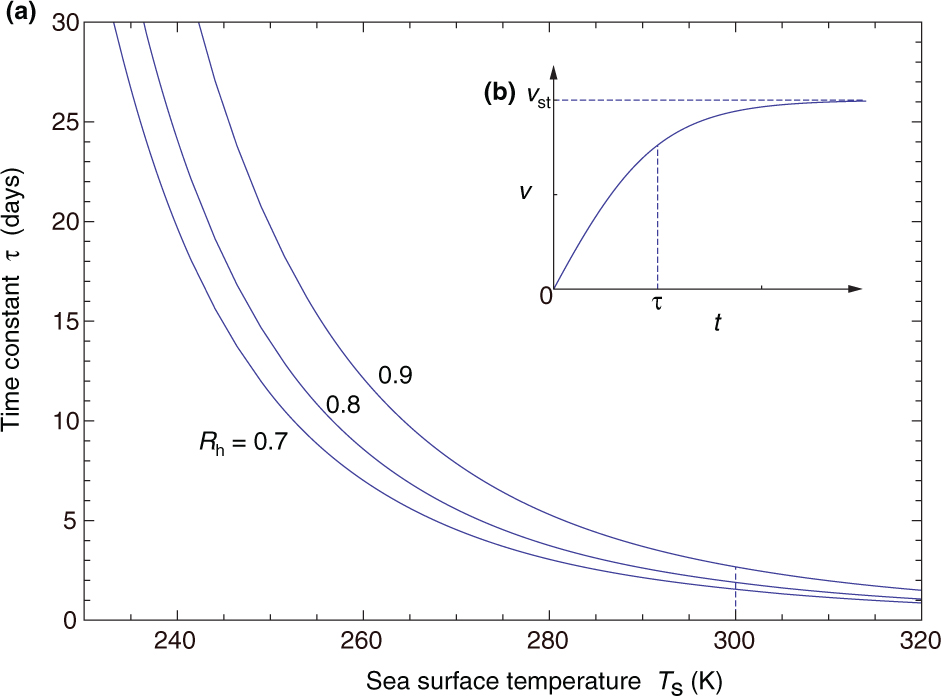
Fig. 6
(a) Characteristic time constant for the growth of tropical cyclones as a function of the sea surface temperature for different values of the relative humidity: R h=0.7, 0.8 and 0.9. (b) Time evolution of the mean velocity of a tropical cyclone.