
Table 1. Abbreviations for the various observation types used in this study
METOP-AFirst satellite in the operational low earth-orbiting satellite series by the European Organization for the Exploitation of Meteorological SatellitesNOAAOperational low earth-orbiting satellite series operated by the National Oceanic and Atmospheric Administration of the USAAMSU-AAdvanced Microwave Sounding Unit-AMHSMicrowave Humidity SounderIASIInfrared Atmospheric Sounding InterferometerAIRSAtmospheric Infrared SounderHIRSHigh-resolution Infrared Radiation SounderGOESGeostationary Operational Environmental SatelliteMFGMeteosat First Generation (Meteosat-7) by the European Organization for the Exploitation of Meteorological SatellitesMSGMeteosat Second Generation (Meteosat-9) by the European Organization for the Exploitation of Meteorological SatellitesMTSATMulti-functional Transport SatelliteKMA COMSCommunication, Ocean, and Meteorological Satellite by the Korea Meteorological AdministrationSSMI/SSpecial Sensor Microwave Imager/SounderASCATAdvanced ScatterometerGPSROGlobal Positioning System Radio OccultationSOUNDUpper-air observations from a radiosondeDROPSONDEUpper-air observational device designed to be dropped from an aircraftPROFLUpper-air wind profile from a ProfilerPILOTUpper-air wind profile from a pilot balloon or radiosondeAIRCRAFTUpper-air wind and temperature from aircraftSYNOPLand surface synoptic weather observationsSHIPSea surface weather observation by shipBUOYSea surface weather observation by buoyTCBOGUSTropical cyclone bogus observations generated by national meteorological centres
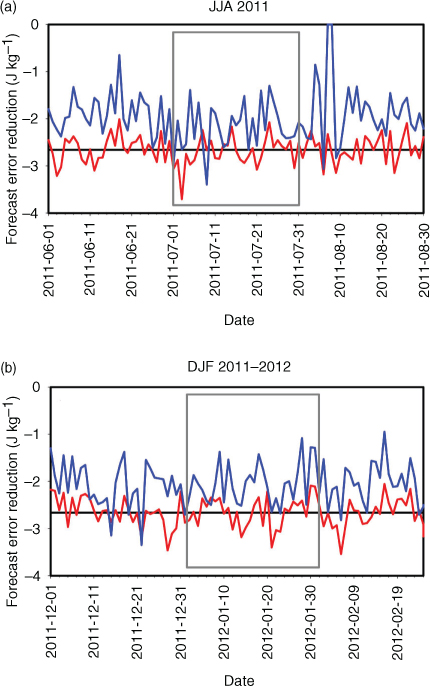
Fig. 1
Time series (red line) and average (black line) of the nonlinear forecast error reduction (FER) and time series (blue line) of the approximated FER at 00 UTC analysis time in the Northern Hemisphere (NH) for (a) June, July and August 2011 and for (b) December 2011 and January and February 2012. The period for calculating the sampling error is denoted by the grey box.
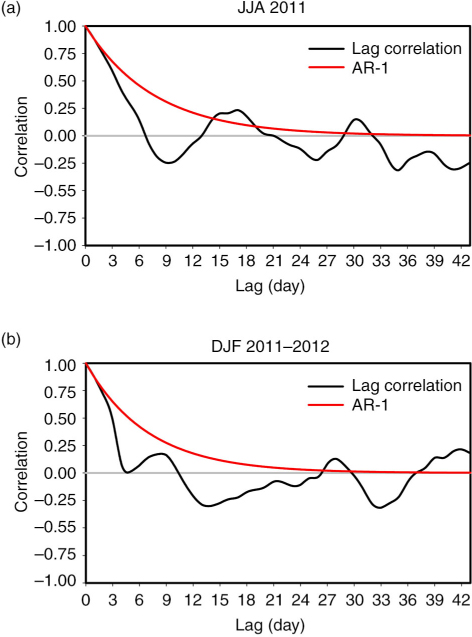
Fig. 2
The lag correlation (black line) calculated from the 5-day moving average of the observation impact in the NH for (a) June, July and August 2011 and for (b) December 2011 and January and February 2012. The lag correlation using the AR-1 model is represented by the red line.
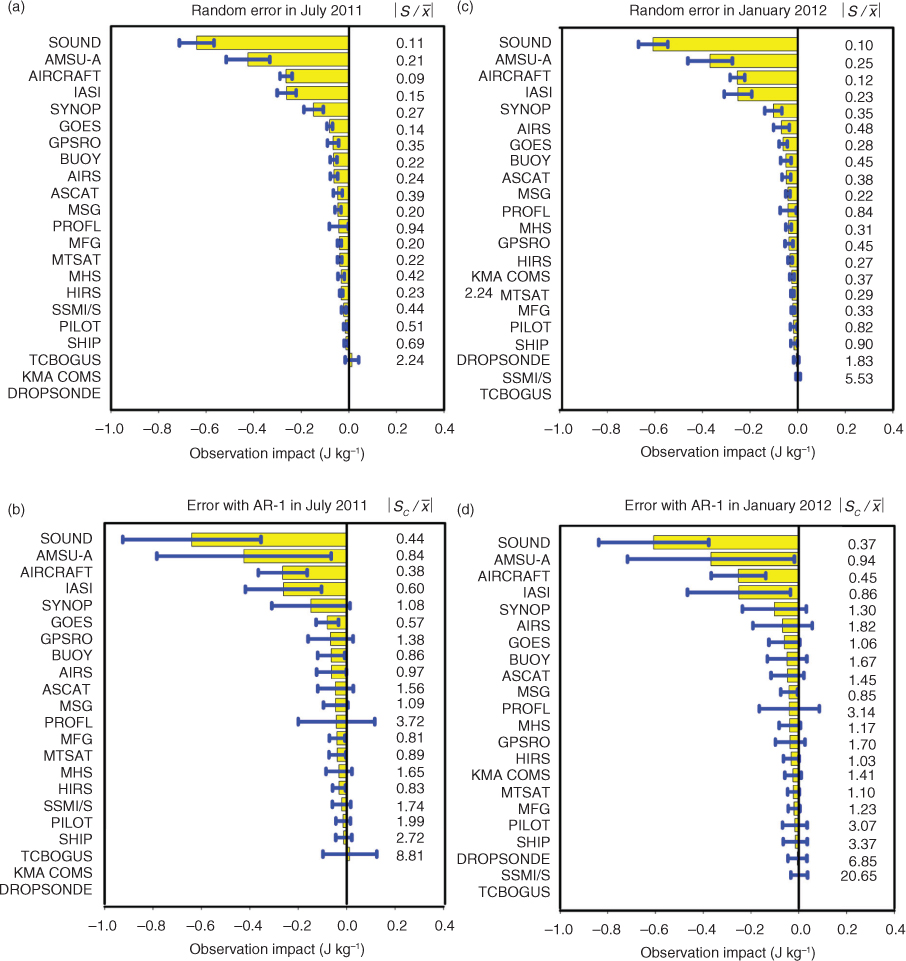
Fig. 3
The time-averaged observation impact (yellow bar, J kg−1) and sampling error (blue line, J kg−1) using (a, c) the random error and (b, d) the error using the AR-1 autocorrelation, stratified with the observation type for July 2011 and for January 2012, respectively.

Fig. 4
The sampling error (bar, J kg−1) stratified with the observation type for (a) July 2011 and (b) January 2012. The random error (red) and the error using the AR-1 autocorrelation (blue).