
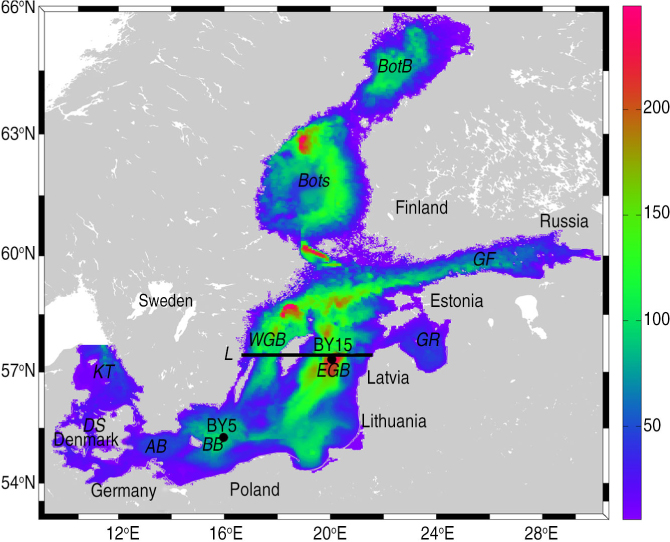
Fig. 1
The bathymetry of the RCO model (depths in m). The positions of selected monitoring stations, BY15 (57.33°N, 20.05°E) and BY5 (55.25°N, 15.98°E), are indicated by black dots and the position of the section L (along 57.44°N) is shown by the black line. Various subbasins in the Baltic Sea are Kattegat (KT), Danish straits (DS), Arkona Basin (AB), Bornholm Basin (BB), eastern Gotland Basin (EGB), western Gotland Basin (WGB), Gulf of Riga (GR), Gulf of Finland (GF), Bothnian Sea (BotS) and Bothnian Bay (BotB).
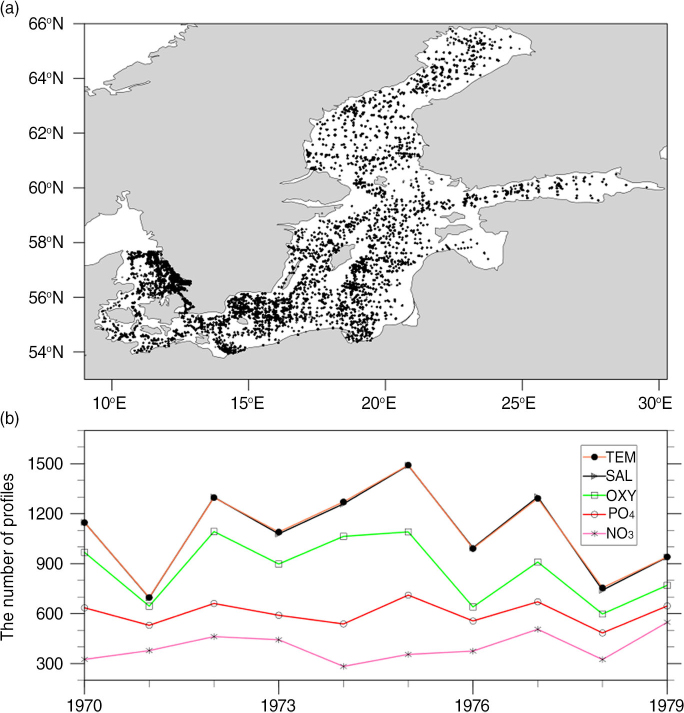
Fig. 2
Spatial distribution of temperature observations (a) and annual number of temperature, salinity, oxygen, phosphate, and nitrate observations during the 1970–1979 (b).
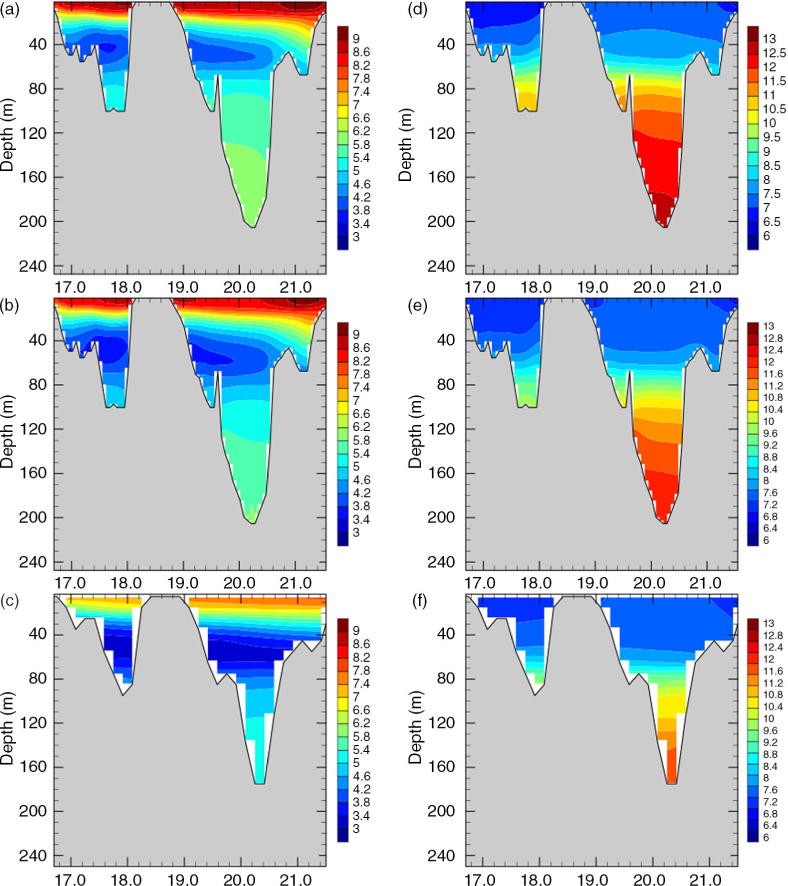
Fig. 3
Sections of annual mean temperature (in °C; a–c) and salinity (in psu; d–f) across the Gotland Basin. The simulation results of FREE (a and d) and REANA (b and e) are compared with climatological data by Janssen et al. (1999) (c and f). For the location of the section see Fig. 1.
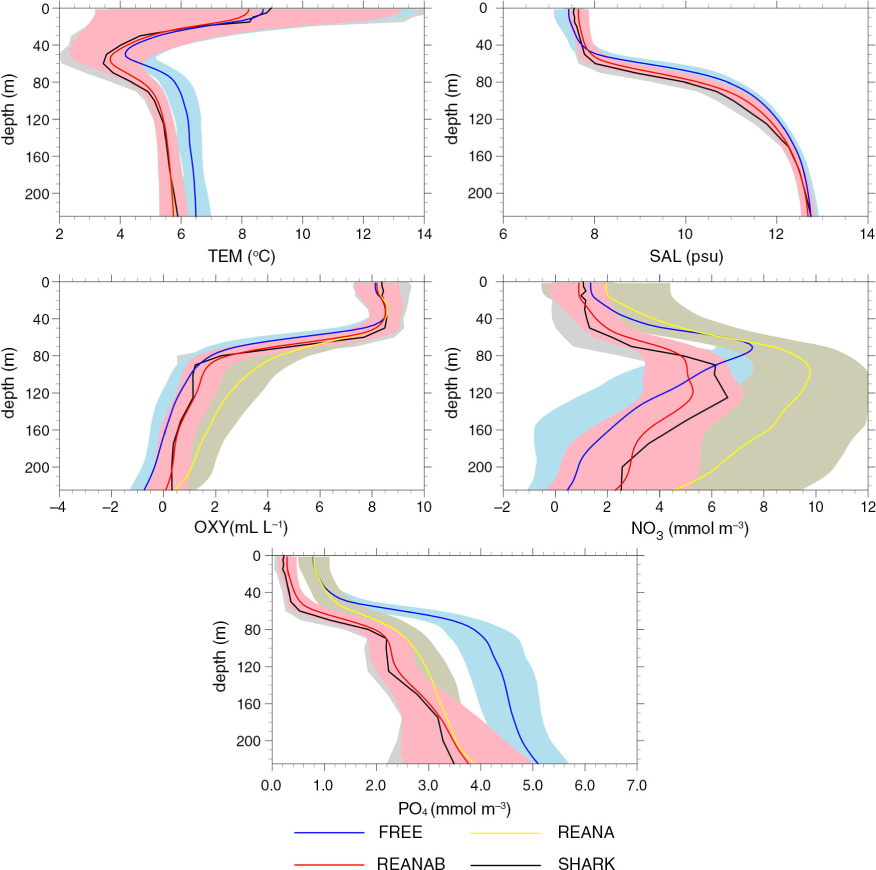
Fig. 4
Average (1970–1979) vertical profiles for temperature, salinity, oxygen, nitrate and phosphate at BY15 from SHARK (black), FREE (blue), REANA (yellow) and REANAB (red). Shaded areas indicate corresponding standard deviations.
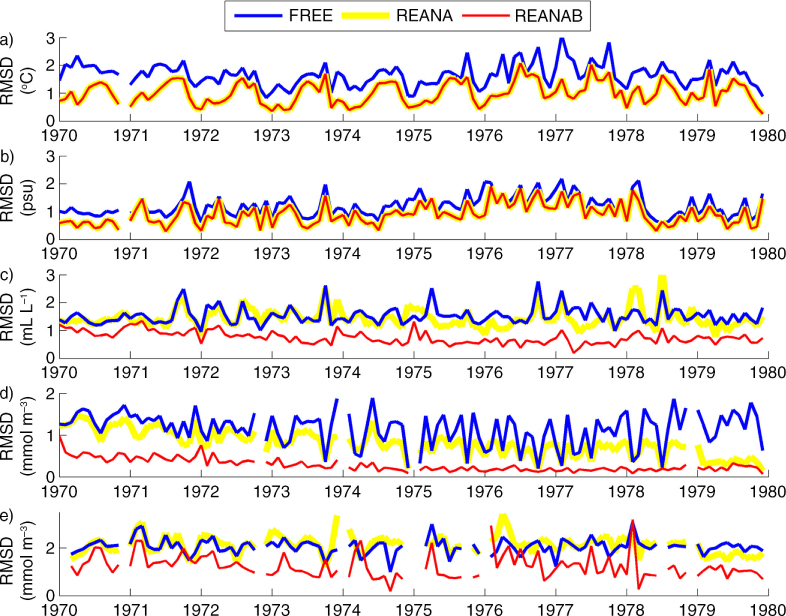
Fig. 5
Monthly mean root mean square deviation (RMSD) between model results and observations for temperature (a), salinity (b), oxygen (c), phosphate (d) and nitrate (e) in FREE (blue), REANA (yellow) and REANAB (red).
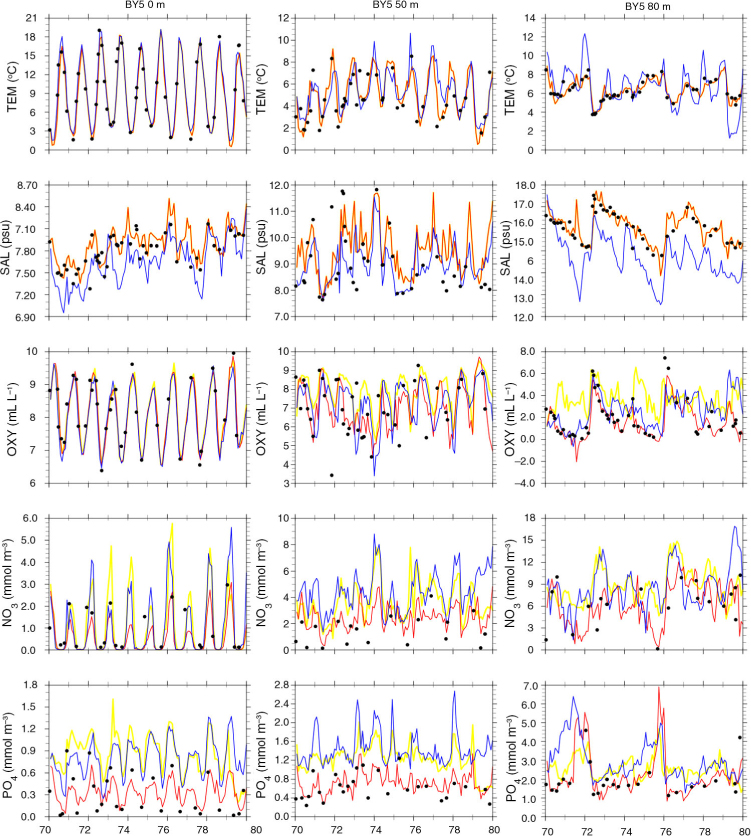
Fig. 6
Time series of monthly mean temperature (in °C), salinity (in psu), oxygen (in mL L−1), nitrate (in mmol m−3) and phosphate (in mmol m−3) in the simulations FREE (blue), REANA (yellow) and REANAB (red) at the depths of 0 m (left panel), 50 m (middle panel) and 80 m (right panel) at BY5 (Bornholm Deep) (55.25°N, 15.98°E) during 1970–1979. Observations are denoted by black dots. For the location see Fig. 1.
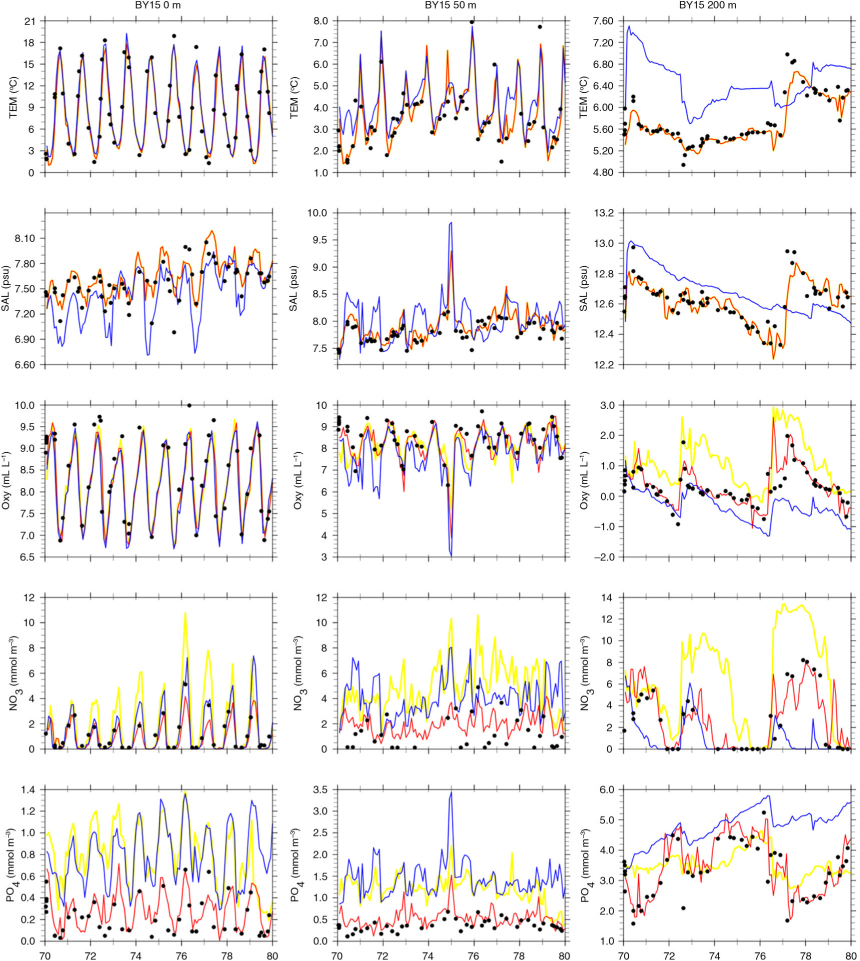
Fig. 7
The same as Fig. 6 but at the depths of 0 m (left panel), 50 m (middle panel) and 200 m (right panel) at BY15 (Gotland Deep) (57.33°N, 20.05°E) during 1970–1979.
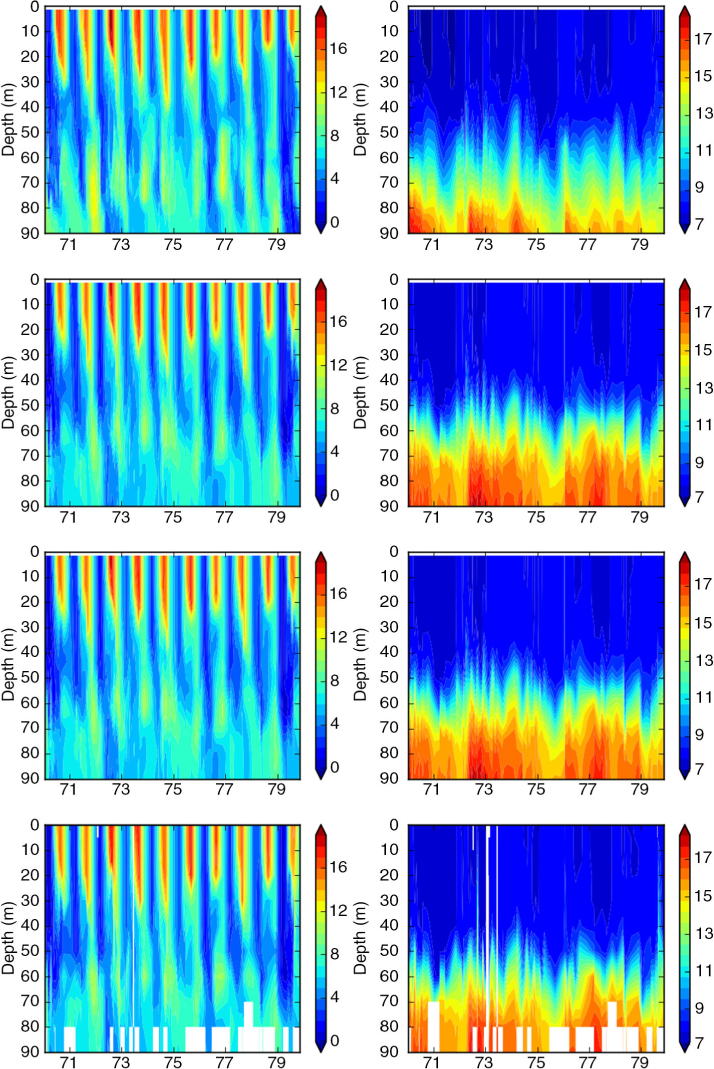
Fig. 8
Isoline depths as function of time for temperature (in °C; left column), salinity (in psu; right column), in the simulations FREE (first row), REANA (second row) and REANAB (third row) and in observations (fourth row) at BY5 (Bornholm Deep) (55.25°N, 15.98°E) during 1970–1979. For the location see Fig. 1.
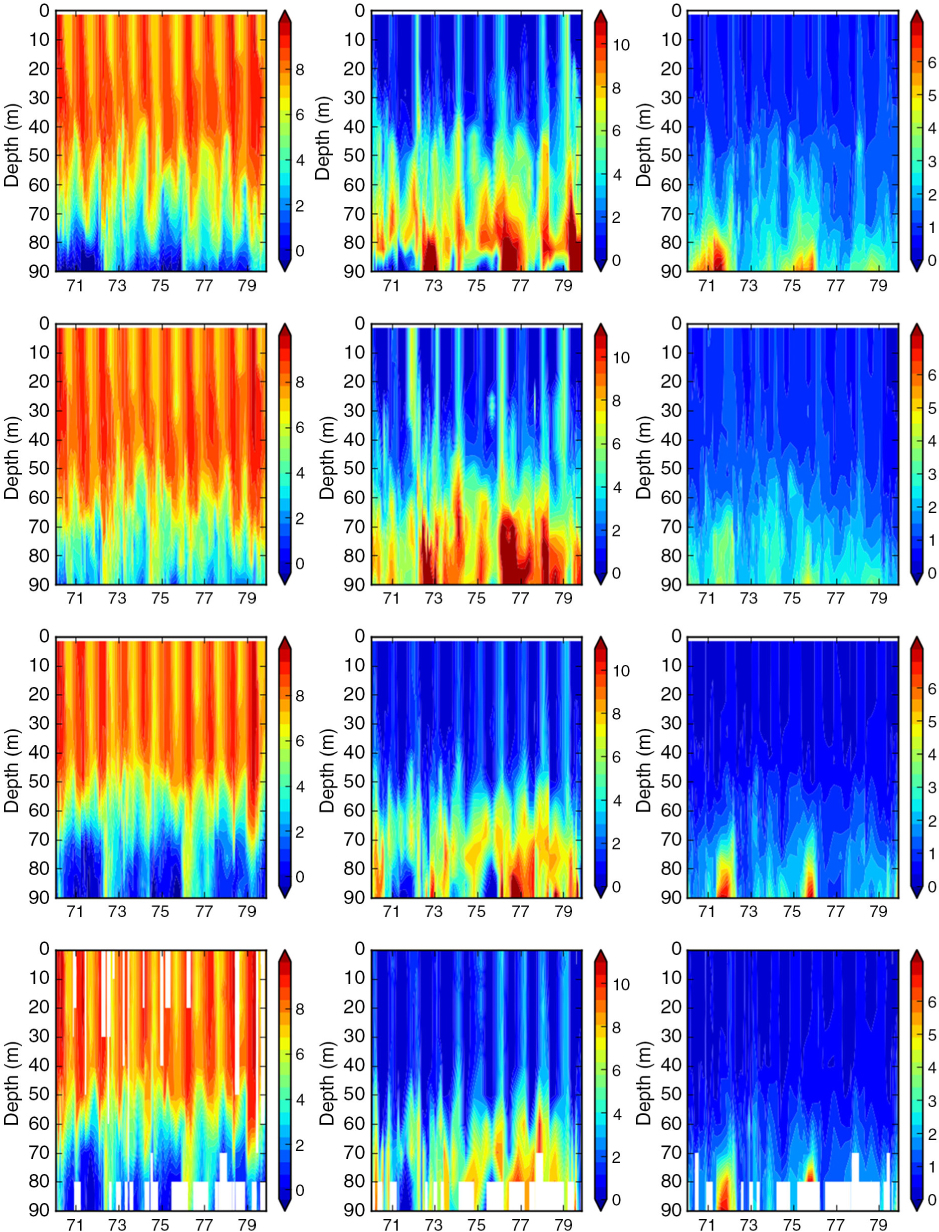
Fig. 9
Isoline depths as function of time for oxygen (in mL L−1; first column), nitrate (in mmol m−3; second column) and phosphate (in mmol m−3; third column) in the simulations FREE (first row), REANA (second row) and REANAB (third row) and in observations (fourth row) at BY5 (Bornholm Deep) (55.25°N, 15.98°E) during 1970–1979. For the location see Fig. 1.
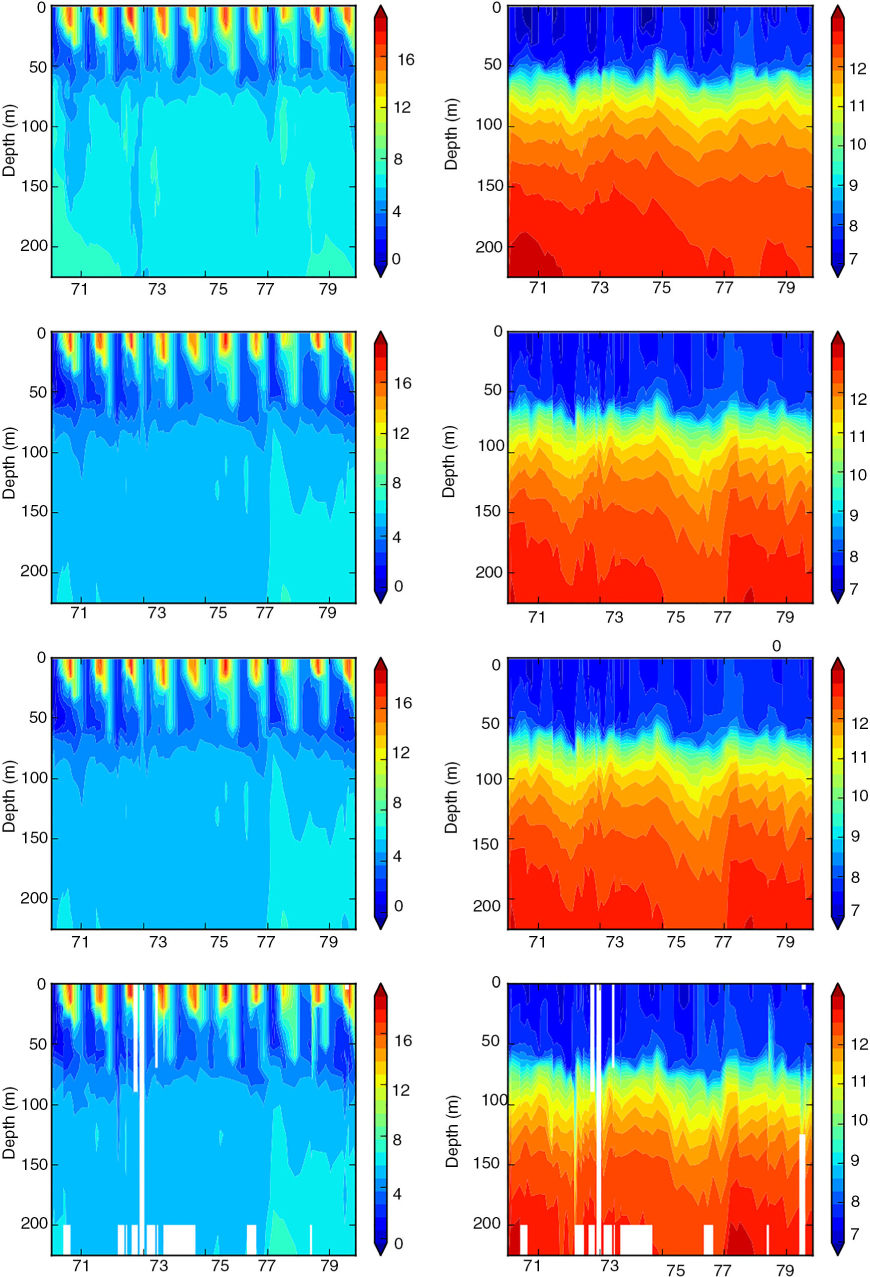
Fig. 10
The same as Fig. 8, but for BY15 (Gotland Deep) (57.33°N, 20.05°E).
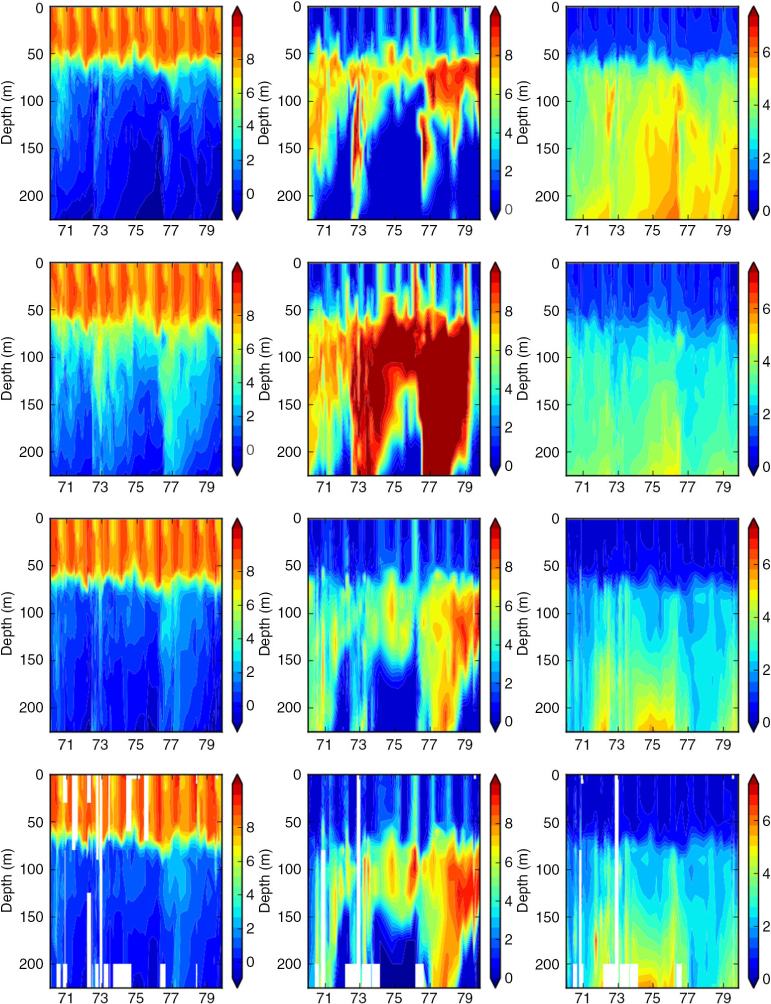
Fig. 11
The same as Fig. 9, but for BY15 (Gotland Deep) (57.33°N, 20.05°E).
Table 1. Root mean square deviation (RMSD) calculated for the three simulations FREE, REANA and REANAB using temperature, salinity, oxygen, nitrate and phosphate observations from the SHARK data base during the period 1970–1979.
FREE1.661.211.532.061.15REANA1.020.901.452.130.80REANAB1.020.900.751.240.32Reduction REANA38.6%25.6%5.2%−3.4%30.4%Reduction REANAB38.6%25.6%51.0%39.8%72.1%
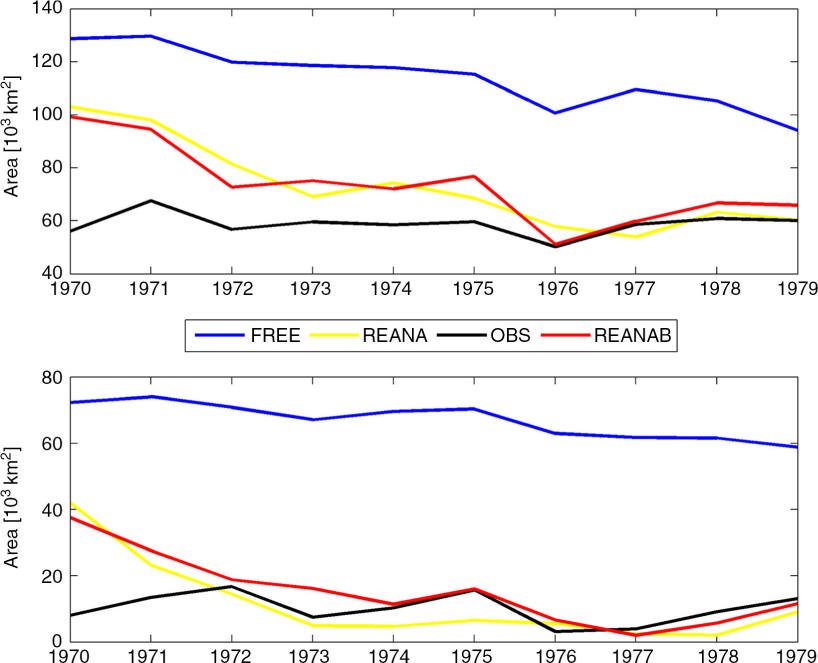
Fig. 12
Time series of the annual mean hypoxic (upper panel) and anoxic (lower panel) areas of the entire Baltic Sea calculated from FREE (blue), REANA (yellow), REANAB (red) and the observations (black).
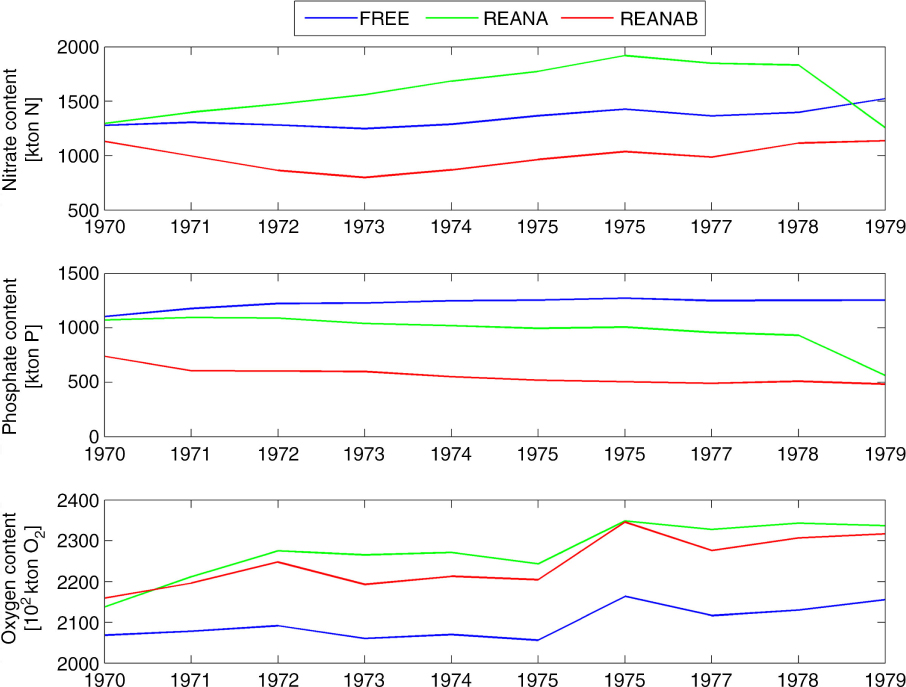
Fig. 13
Time series of the annual mean, volume integrated nitrate (upper panel), phosphate (middle panel) and oxygen (lower panel) contents of the entire Baltic Sea calculated from FREE (blue), REANA (yellow) and REANAB (red).