
Table 1. Brief description of the eight GCMs
BCC-CSM1-1 (BCC)1.875°×1.875°China/BCCCanESM2 (CAN)2.0°×2.0°Canada/CCCMACNRM-CM5 (CNRM)2.8°×2.8°France/CNRMGISS-E2-H (GISSH)4.0°×5.0°American/GISSGISS-E2-R (GISSR)5.0°×4.0°American/GISSINM-CM4 (INM)5.0°×4.0°Russia/INMIPSL-CM5A-LR (IPSL)3.75°×2.5°France/IPSLNorESM1-M (NOR)3.75°×3.75°Norway/NCC
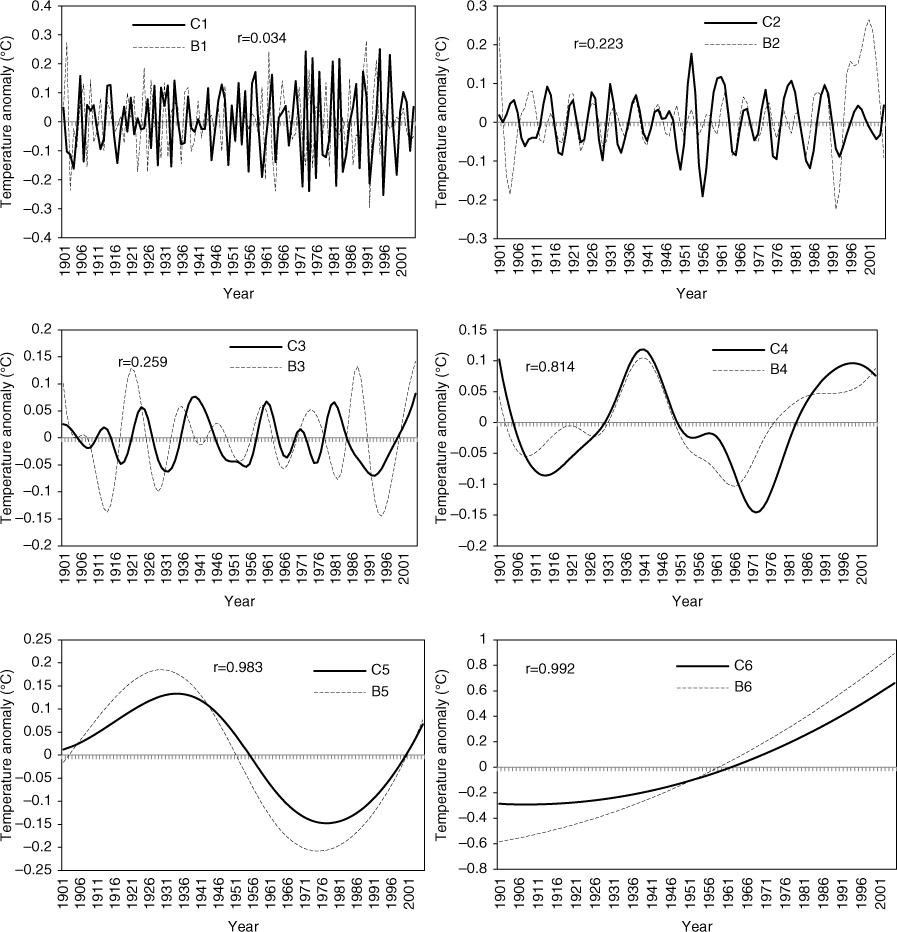
Fig. 1
The six IMFs (components) of the observation (CRU) decomposed by the EEMD method (C1 minus C6) and the six IMFs of model BCC decomposed by the EEMD method (B1 minus B6). The correlations (r) were calculated between the different IMFs of BCC and their corresponding IMFs of CRU.

Fig. 2
The global mean temperature, which was simulated by the BCC-CSM1-1 (BCC) model, its EEMD-improved simulations (BCC minus EEMD), its WTM-improved simulations (BCC minus WTM) and the observation (CRU) from 1901 to 2005.
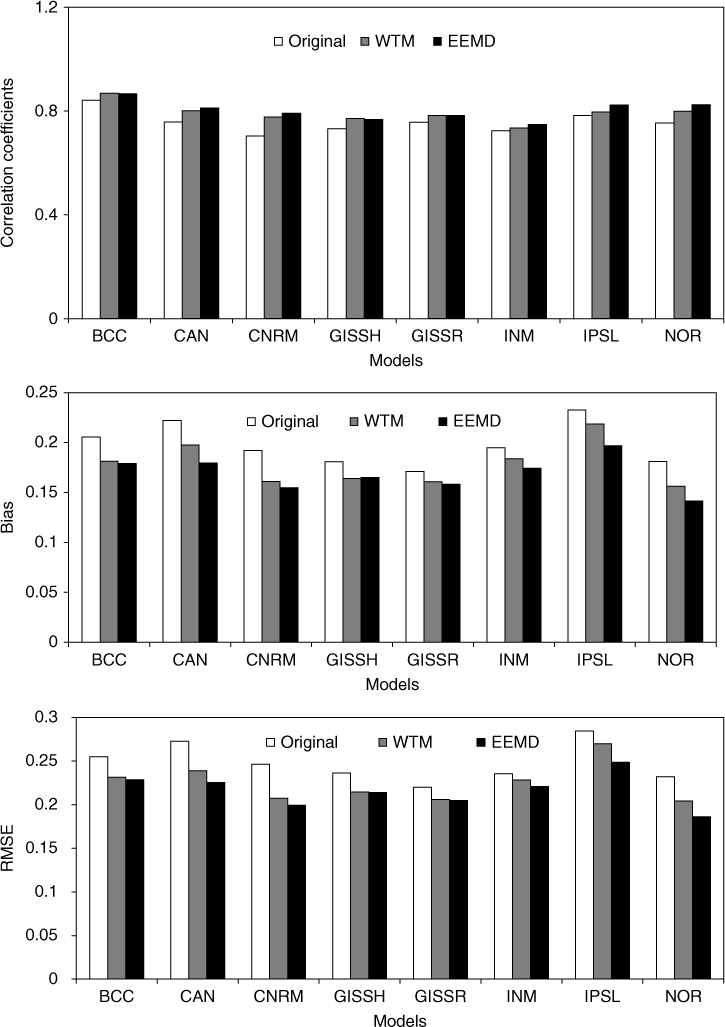
Fig. 3
Correlation, bias and RMSE of the original model simulations, EEMD-improved series and WTM-improved series for every model at the global scale.
Table 2. Statistics (correlation, bias, RMSE) between EEMD-improved model series and original model series (E minus O) and its percentage variation [calculated by (E−O)/O×100]
E minus O%E minus O%E minus O%
BCC0.0230.03130.0310CAN0.0670.04190.0517CNRM0.09120.04190.0519GISSH0.0450.0290.029GISSR0.0330.0170.027INM0.0230.02110.016IPSL0.0450.04160.0413NOR0.0790.04220.0520
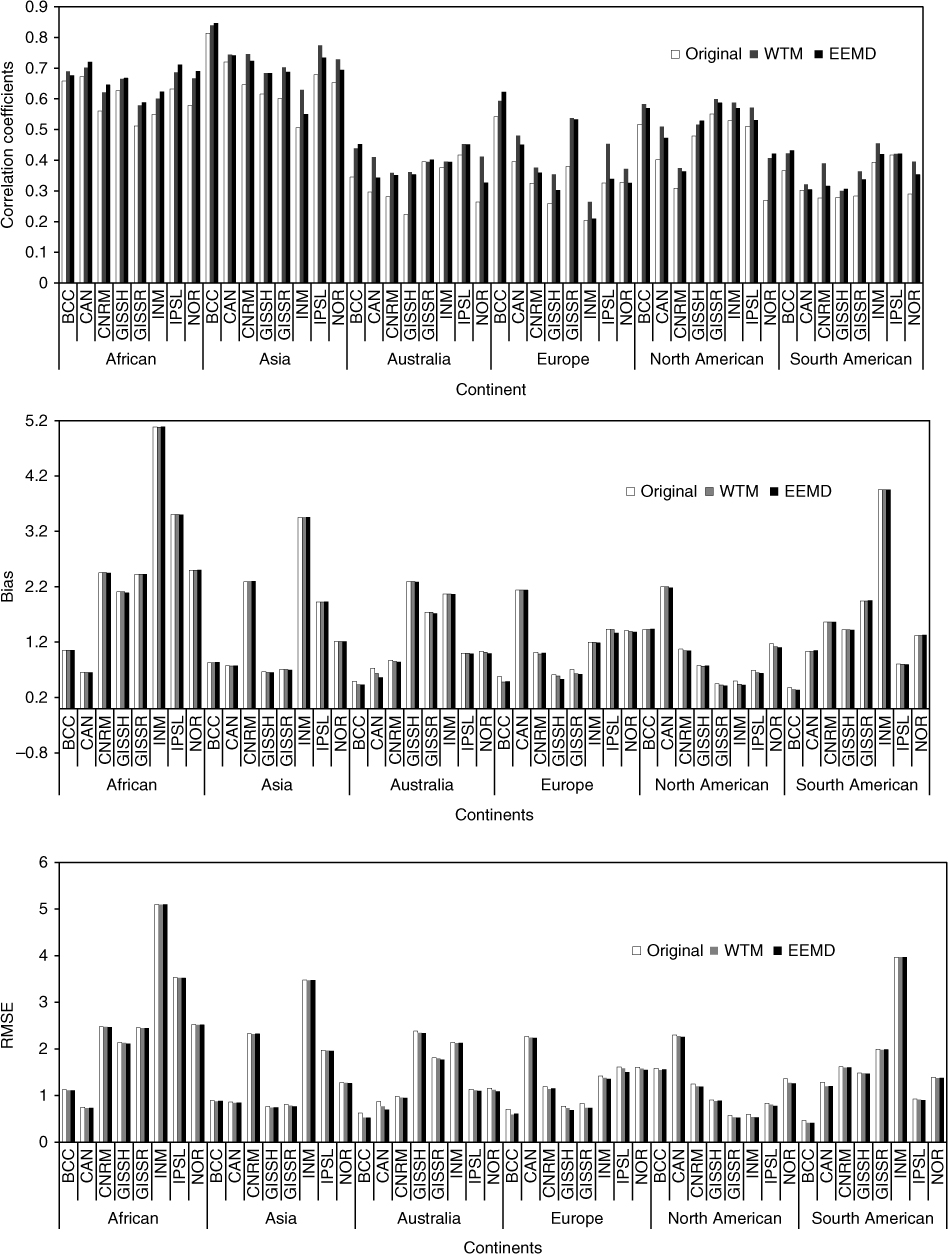
Fig. 4
Correlation, bias and RMSE of original model simulations, EEMD-improved series and WTM-improved series for every model in the six continents.

Fig. 5
The statistics (correlation, bias, and RMSE) of MME forecasts calculated by the four MME methods (Bayesian, Linear, SVD, and AEM) based on the original and EEMD-improved model simulations at the global scale.
Table 3. Differences between the statistics (correlation, bias, RMSE) between ensemble forecasts based on EEMD-improved model series and original model series (E minus O) and the percentage differences [calculated by (E−O)/O×100]
CorrelationBayesian0.0091.094Linear0.0172.000SVD0.0212.481AEM0.0091.094BiasBayesian−0.0064.316Linear−0.0106.844SVD−0.0096.769AEM−0.0064.644RMSEBayesian−0.0063.501Linear−0.0094.823SVD−0.0116.122AEM−0.0103.606
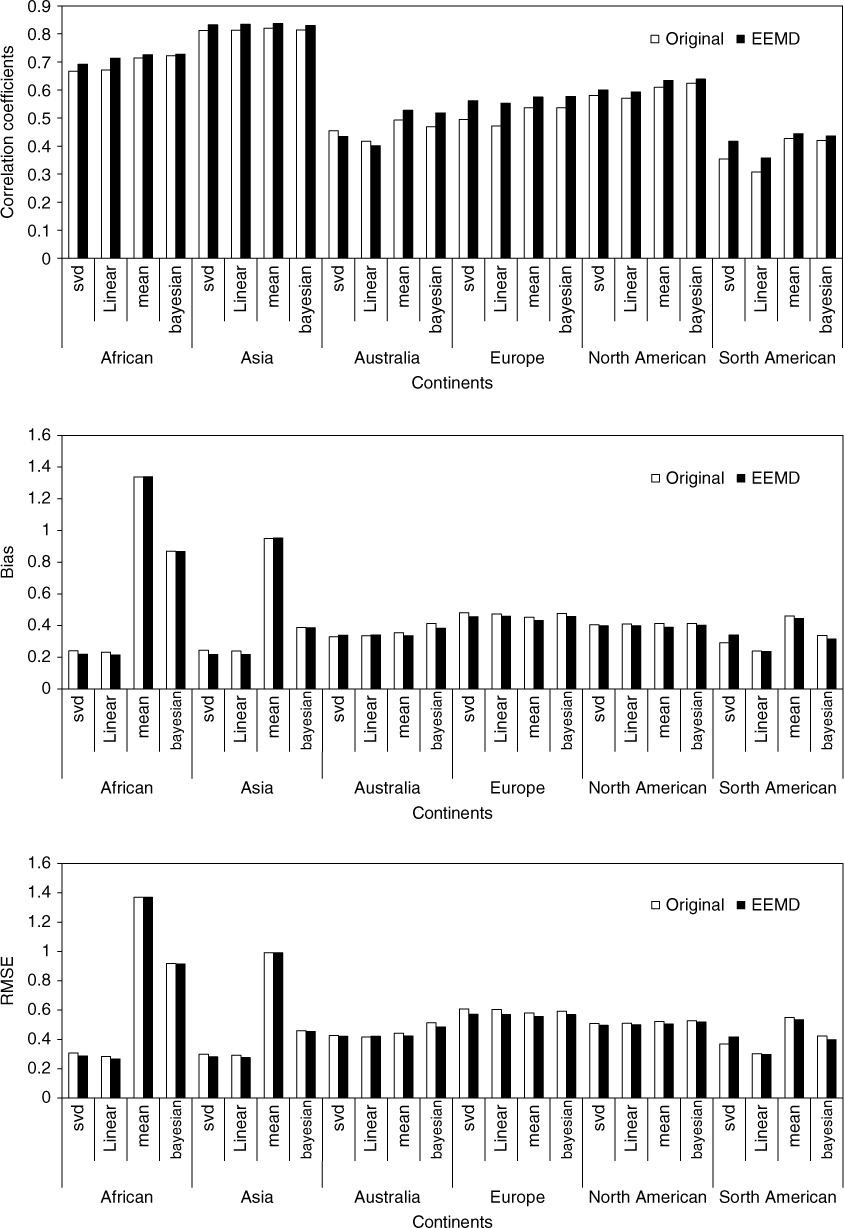
Fig. 6
The statistics (correlation, bias, RMSE) of MME simulations calculated by the four MME methods (Bayesian, Linear, SVD, AEM) based on the original and EEMD-improved model simulations in six continents.
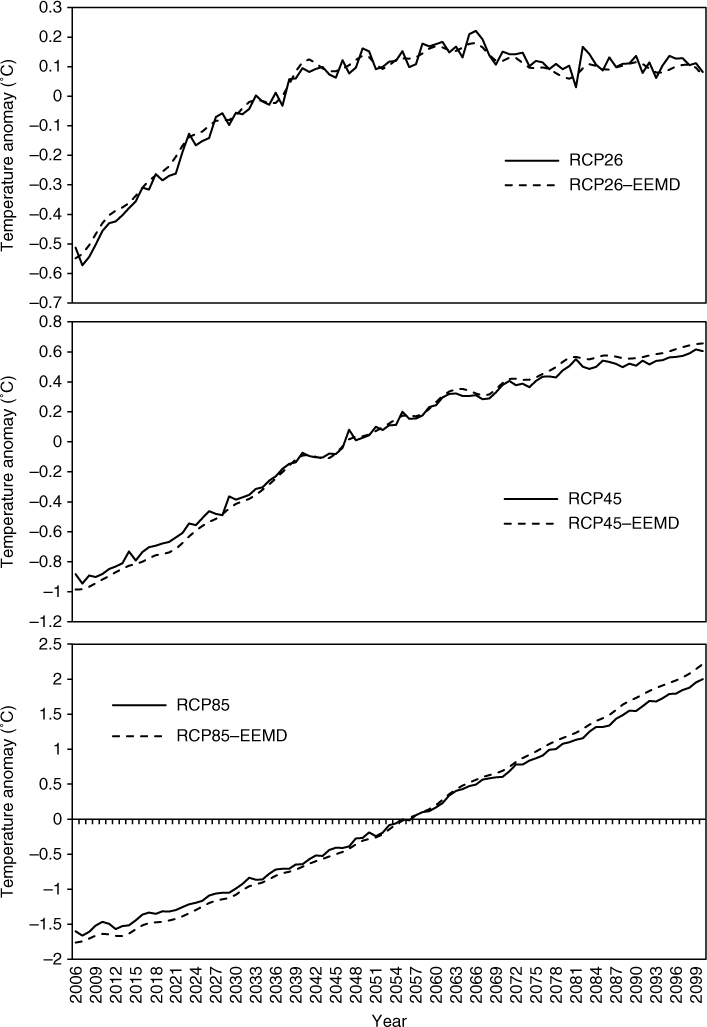
Fig. 7
Multi-model ensemble mean simulations of global annual mean temperatures for future scenarios (RCP2.6, RCP4.5 and RCP8.5) and their EEMD-improved series (RCP26 minus EEMD, RCP45 minus EEMD and RCP85 minus EEMD).