
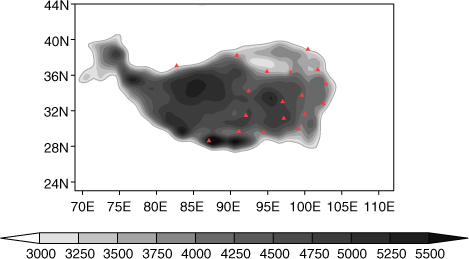
Fig. 1
Spatial distribution of the radiosonde stations (red triangles) over the Tibetan Plateau. The shadings indicate the elevation.
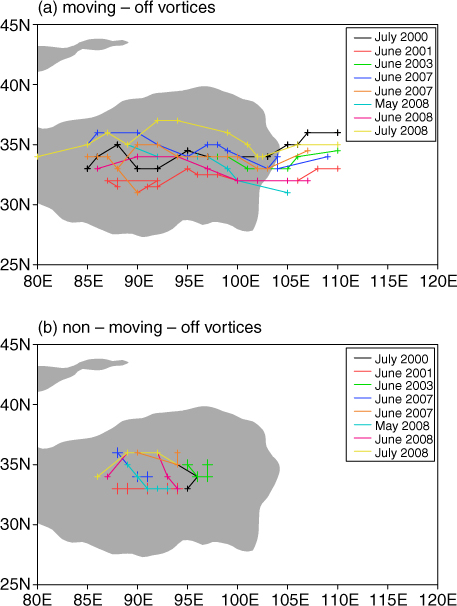
Fig. 2
Selected (a) eight moving-off vortices (Type A) and (b) eight non-moving-off vortices (Type B) as well as their tracks. The shading indicates the area with altitude over 3000 m. The cross (+) in each track denotes the centre position of the vortex at the time interval of 6 hours.
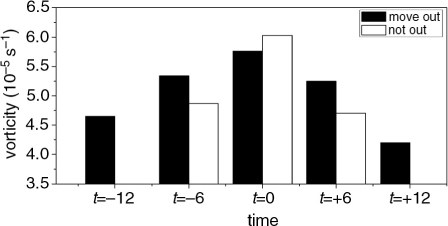
Fig. 3
Vertical vorticity at 500 hPa averaged in a square region (2°×2°) around the centre of the composite vortices (unit: 10−5 s−1). The black and white bars are for Type A and Type B vortices, respectively.
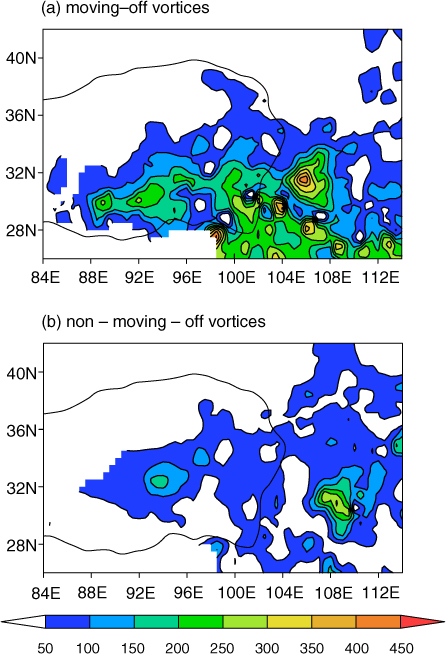
Fig. 4
The observed accumulated rainfall for all cases of (a) Type A and (b) Type B vortices (unit: mm).
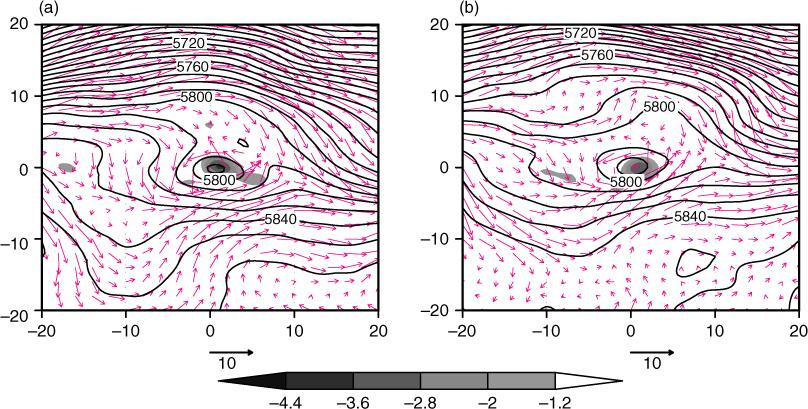
Fig. 5
Composites of 500 hPa winds (vectors; unit: m s−1), geopotential heights (contours; unit: gpm) and divergence (shadings; unit: 10−5 s−1) when the plateau vortices are over the Tibetan Plateau for (a) Type A and (b) Type B vortices. The composite period is from t=−12 to t=0 for Type A vortices and from t=−6 to t=+6 for Type B vortices. The coordinates in the x-axis and y-axis are the relative coordinates from the centres of vortices in zonal and meridional directions (unit: degree), respectively.
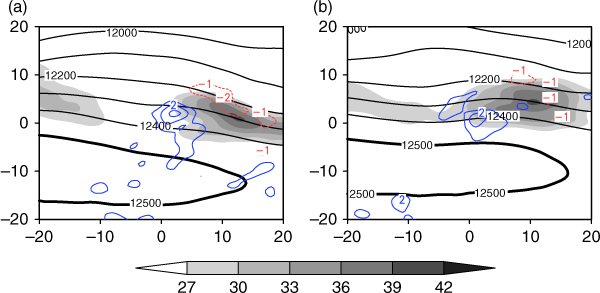
Fig. 6
Same as Fig. 5, but for the 200 hPa geopotential heights (black contours; unit: gpm), wind speeds (shadings; unit: m s−1) and divergence (colour contours; unit: 10−5 s−1). The 12 500 gpm contour is darkened to denote the South Asia High. The coordinates are the same as those in Fig. 5.
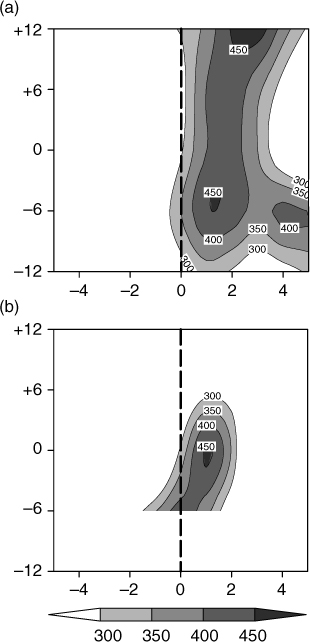
Fig. 7
Time-zonal cross-sections of the composites of the vertically integrated atmospheric apparent heat source (<Q 1>) (shadings; unit: W m−2) averaged from 2° north to 5° south for (a) Type A and (b) Type B vortices, respectively. The thick dotted lines denote the composite centre of the vortices at each time. The coordinates in the x-axis are the relative coordinates from the centres of vortices in zonal direction (unit: degree), and the y-axis indicates the time.
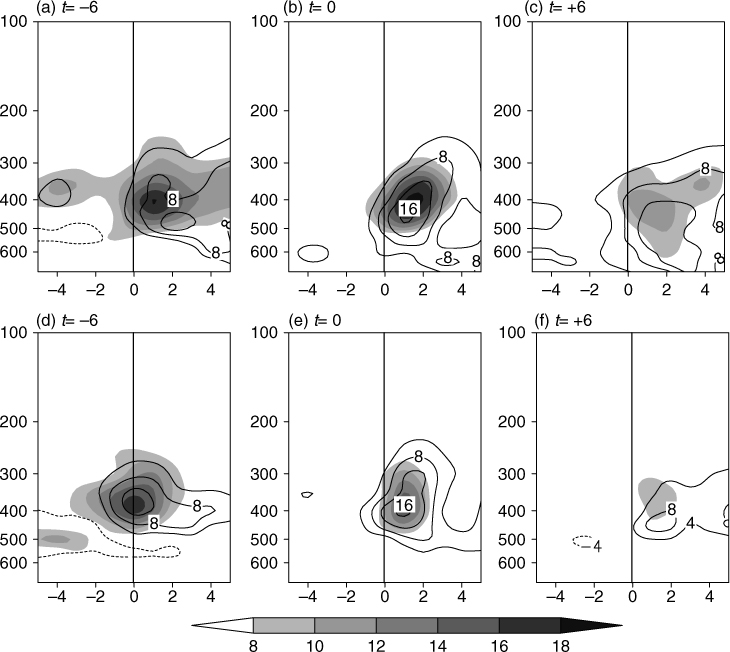
Fig. 8
Height-zonal cross-sections of the atmospheric apparent heat source (Q 1) (shadings) and apparent moist sink (Q 2) (contours) averaged from 2° north to 5° south (unit: K d−1). The upper panel (a–c) is for Type A vortices and the lower panel (d–e) for Type B vortices at times from t=−6 to +6, respectively. The coordinates in x-axis are the relative coordinates from the centres of vortices in zonal direction (unit: degree), and the y-axis indicates the height (unit: hPa).
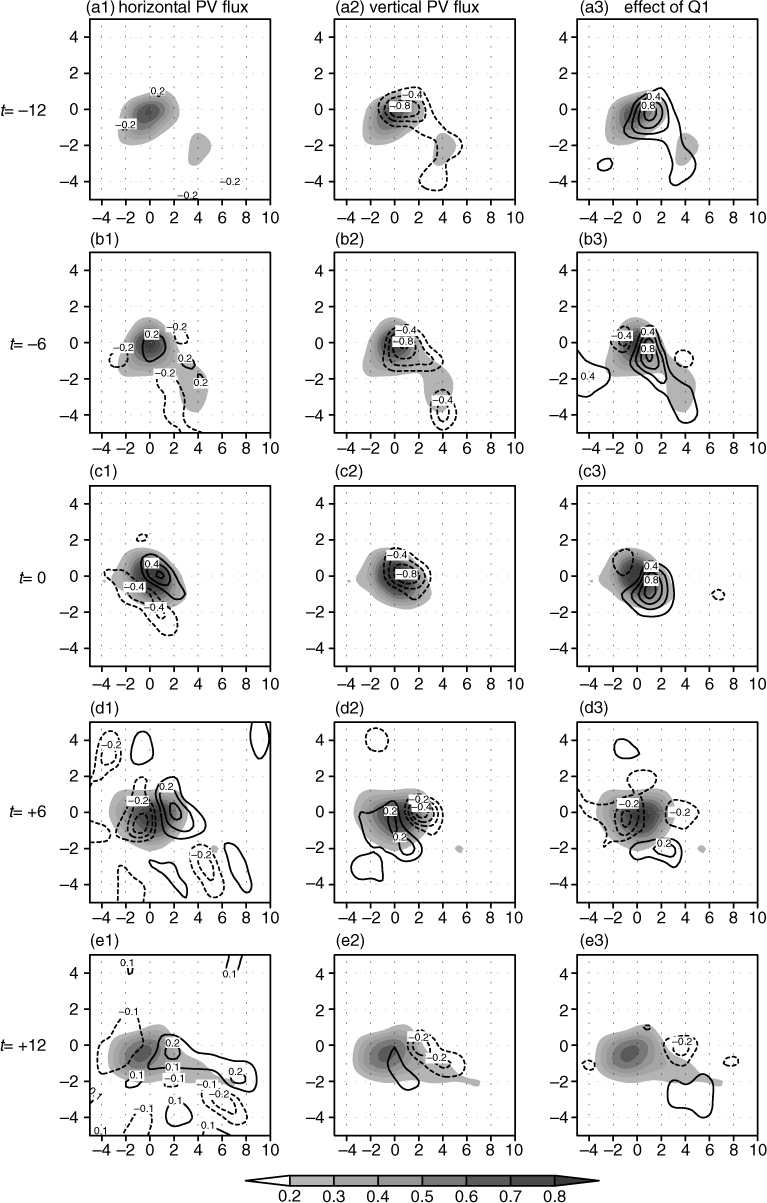
Fig. 9
PV budgets (contours; unit: PVU (6 h)−1, 1PVU=10−6 m2 s−1 K kg−1) and 500 hPa PV (shadings; unit: PVU) for Type A vortices at times from t=−12 to +12. The contours in left, middle and right columns are the horizontal PV flux divergence, the vertical PV flux divergence and the effect of the atmospheric heat source, respectively. The panels from the uppermost (a1–a3) to the lowest (e1–e3) correspond to the times from t= − 12 to +12, respectively. The coordinates are the same as those in Fig. 5.
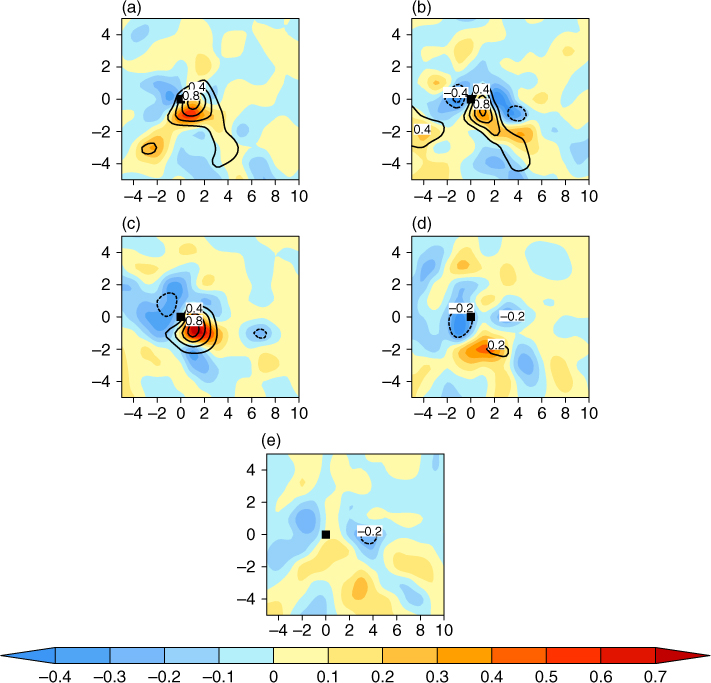
Fig. 10
Net PV budgets (shadings) from the horizontal PV flux divergence, vertical PV flux divergence and the effect of Q 1 (contours) for Type A vortices at (a) t= − 12, (b) t= − 6, (c) t=0, (d) t= + 6 and (e) t= + 12, respectively (unit: PVU (6 h)−1, 1PVU = 10−6 m2 s−1 K kg−1). The coordinates are the same as those in Fig. 5.
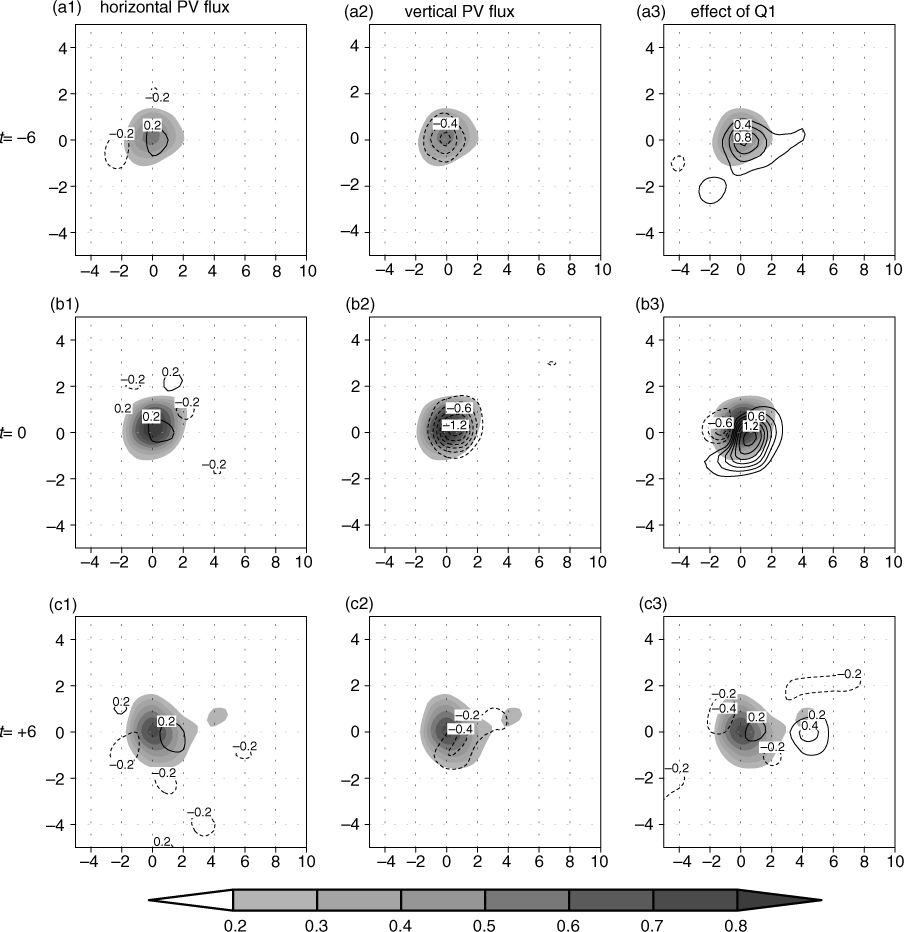
Fig. 11
Same as Fig. 9 but for Type B vortices from t= − 6 to +6. The panels from the uppermost (a1–a3) to the lowest (c1–c3) correspond to the times from t= − 6 to +6, respectively. The coordinates are the same as those in Fig. 5.
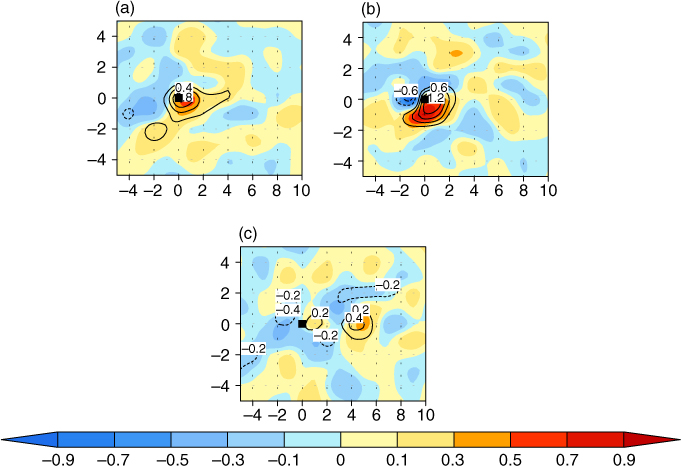
Fig. 12
Same as Fig. 10 but for Type B vortices at (a) t=−6, (b) t=0 and (c) t=+6, respectively. The coordinates are the same as those in Fig. 5.
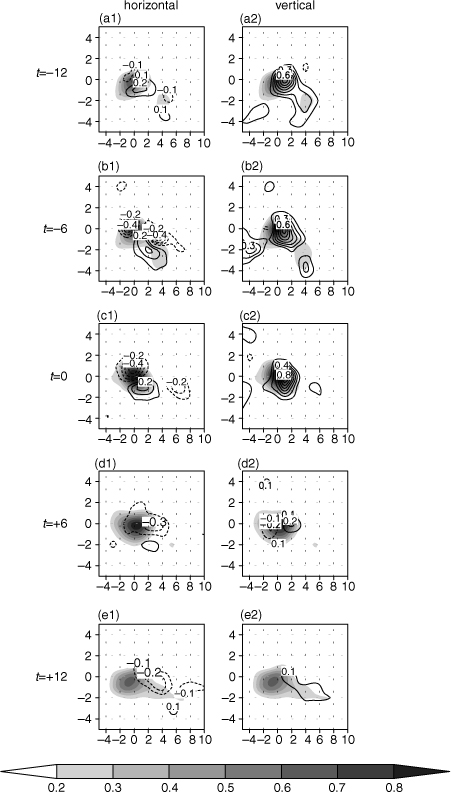
Fig. 13
500 hPa PV (shadings; unit: PVU, 1PVU=10−6 m2 s−1 K kg−1) as well as the PV tendency contributed from the horizontal (left column) and vertical (right column) distributions of the atmospheric heat source [contours; unit: PVU (6 h)−1] for Type A vortices. The panels from the uppermost (a1, a2) to the lowest (e1, e3) correspond to the times from t=−12 to +12, respectively. The coordinates are the same as those in Fig. 5.
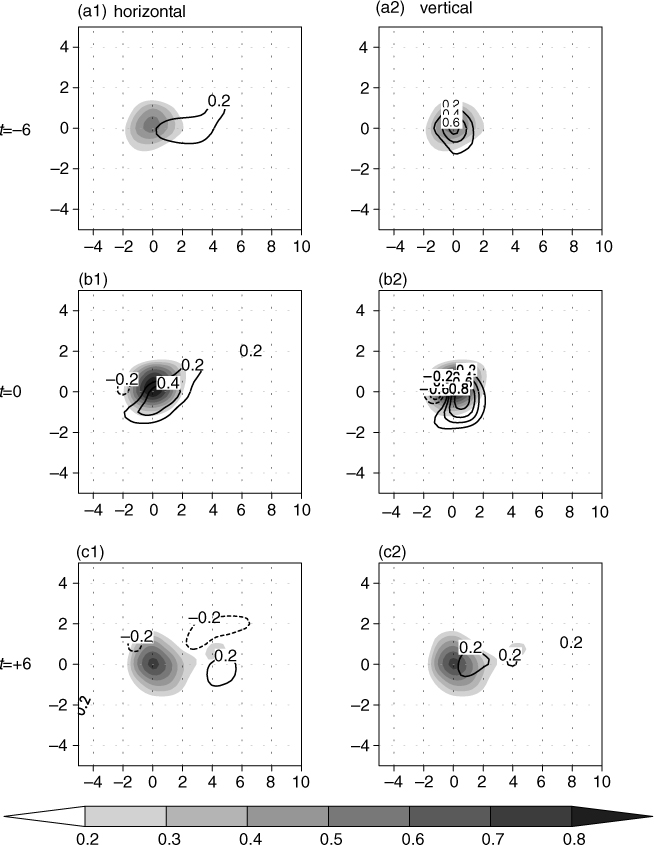
Fig. 14
Same as Fig. 13 but for Type B vortices. The panels from the uppermost (a1, a2) to the lowest (c1, c2) correspond to the times from t=−6 to +6, respectively. The coordinates are the same as those in Fig. 5.