

Fig. 1
Topography and rivers of the region including the western Mediterranean with geographical indications and definition of boxes used to calculate averaged SST differences in the IPSS calculation (see Section 4): GoL includes the plateau of the Gulf of Lion, Py the area offshore of the Pyrenees, Ba the area between the Balearic Islands and the Spanish coast, Li the Ligurian Sea extended down to the north of Sardinia, South Med the area between the Balearic Island and Sardinia and Ty the Tyrrhenian sea.

Fig. 2
(a) Time evolution of the SST (°C) averaged over the box GoL defined in Fig. 1. GOS-SST (red line), CTL: ERA-interim at 0.75° (red dashed line), CPL: from NEMO (black line), SMO (black dashed line); (b) wind intensity and (c) wind direction for CPL (black line) and CTL (red line) at (42.4°N–5°E).
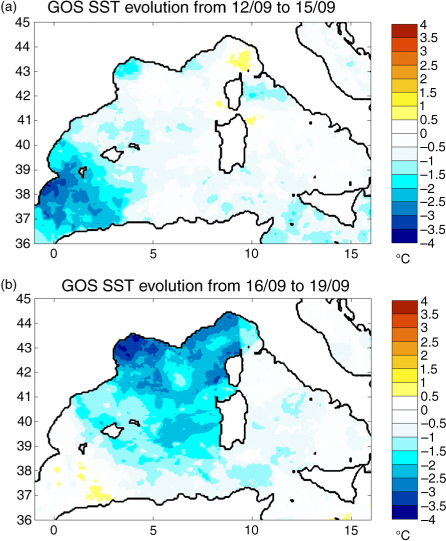
Fig. 3
Effect of the successive Tramontane and Mistral events in high-resolution reanalyses GOS-SST: (a) SST difference between 15 and 12 September 1994 during the Tramontane event (°C); (b) SST difference between the 19 and 16 September 1994 (°C) during the Mistral event.
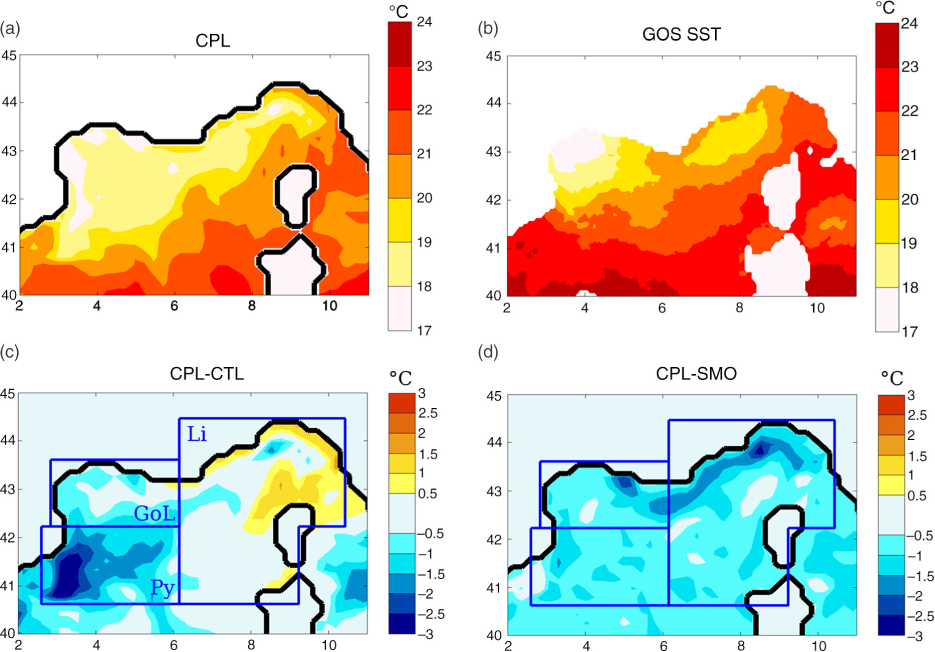
Fig. 4
Sea surface temperature on 23 September 1994 (°C): (a) SST from NEMO-MED12 in CPL simulation (daily mean); (b) SST in GOS fine scale reanalyses; (c) difference between CPL and CTL simulations (daily mean); (d) difference between CPL and SMO simulations (daily mean).
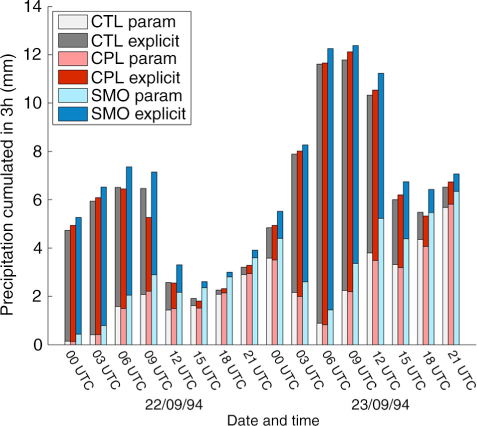
Fig. 5
Precipitation cumulated every 3 h (RR3) averaged over the Cvn box shown in Fig. 6a. Cv=convective rain (resulting from the parametrisation scheme), non Cv=rain resulting from resolved processes in CTL, CPL and SMO simulations; no graupel was recorded.
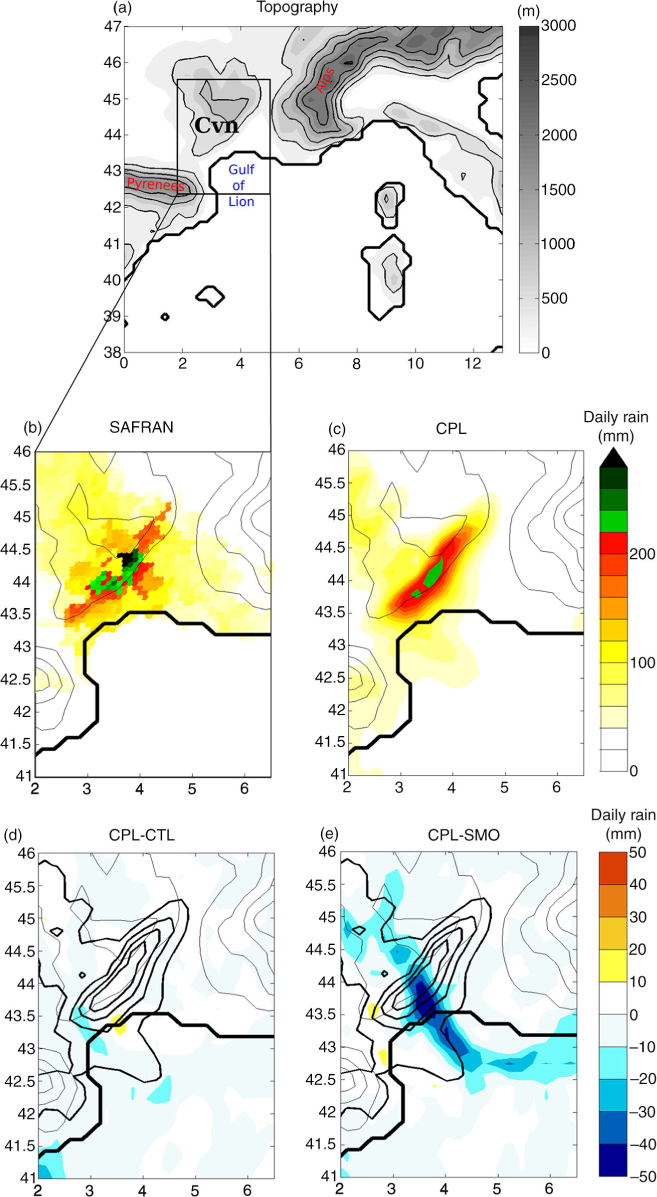
Fig. 6
(a) The north-western Mediterranean region as represented by WRF model at 20 km resolution (topography with contours every 500 m); (b,c) accumulated precipitation over the 22 and 23 September 1994 (mm). (b) In SAFRAN/F analysis at 8 km resolution using ground data observations. (c) In CPL; (d,e) CPL 2 d-accumulated precipitation (contour every 50 mm), colours: Rain difference cumulated over the 2 d between. (d) CPL and CTL simulations and (e) CPL and SMO simulations.
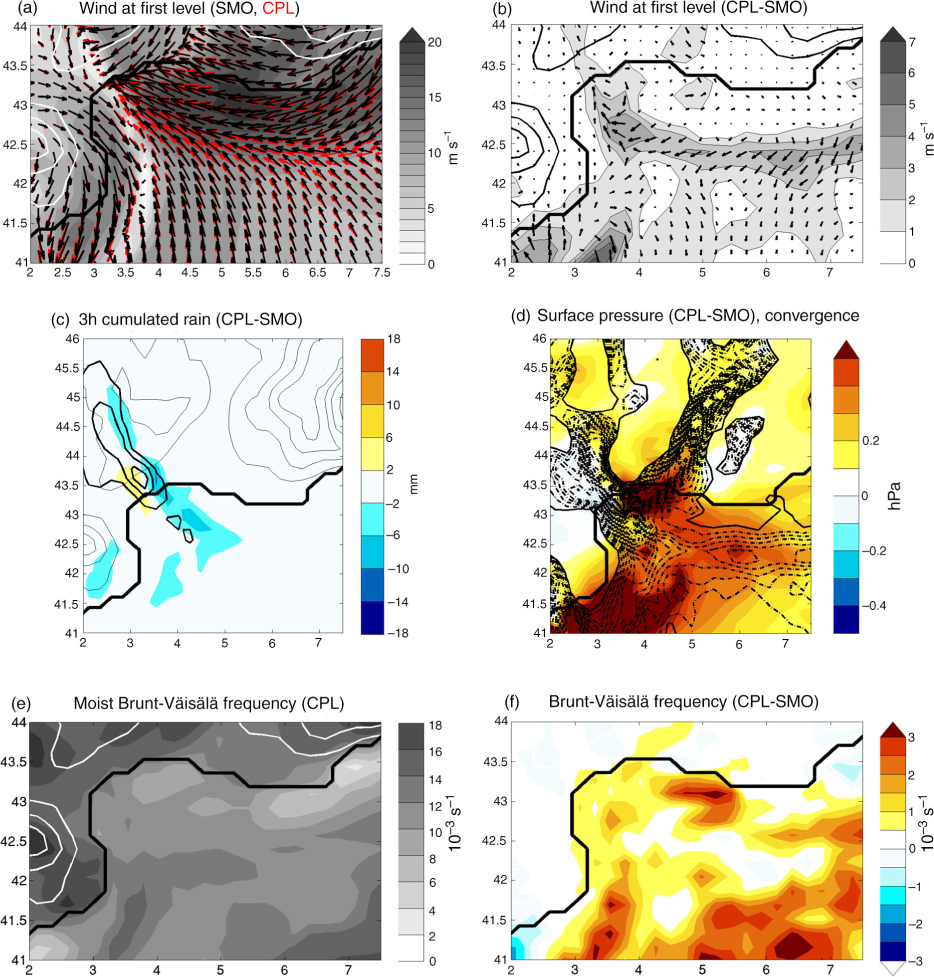
Fig. 7
Situation on 22 September 1994 at 03 UTC on the Gulf of Lions (a) wind at first level (shading: CPL intensity, black arrow: SMO wind vector, red arrow: CPL wind vector); (b) difference in first level wind between CPL and SMO (shading: wind intensity, black arrow: wind direction); (c) colour: Rain difference between CPL and SMO cumulated from 00 to 03 UTC (mm), contour: CPL rain (every 10 mm/3 h); (d) colours: difference in first level pressure between CPL and SMO (hPa), dashed-line: wind divergence lower than zero (every 2.5.10−5s−1); (e) Moist Brunt-Väisälä frequency averaged on the first five levels of atmosphere for CPL (10−3s−1), (f) Difference in moist Brunt-Väisälä frequency averaged on the first five levels of atmosphere between CPL and SMO (10−3s−1).
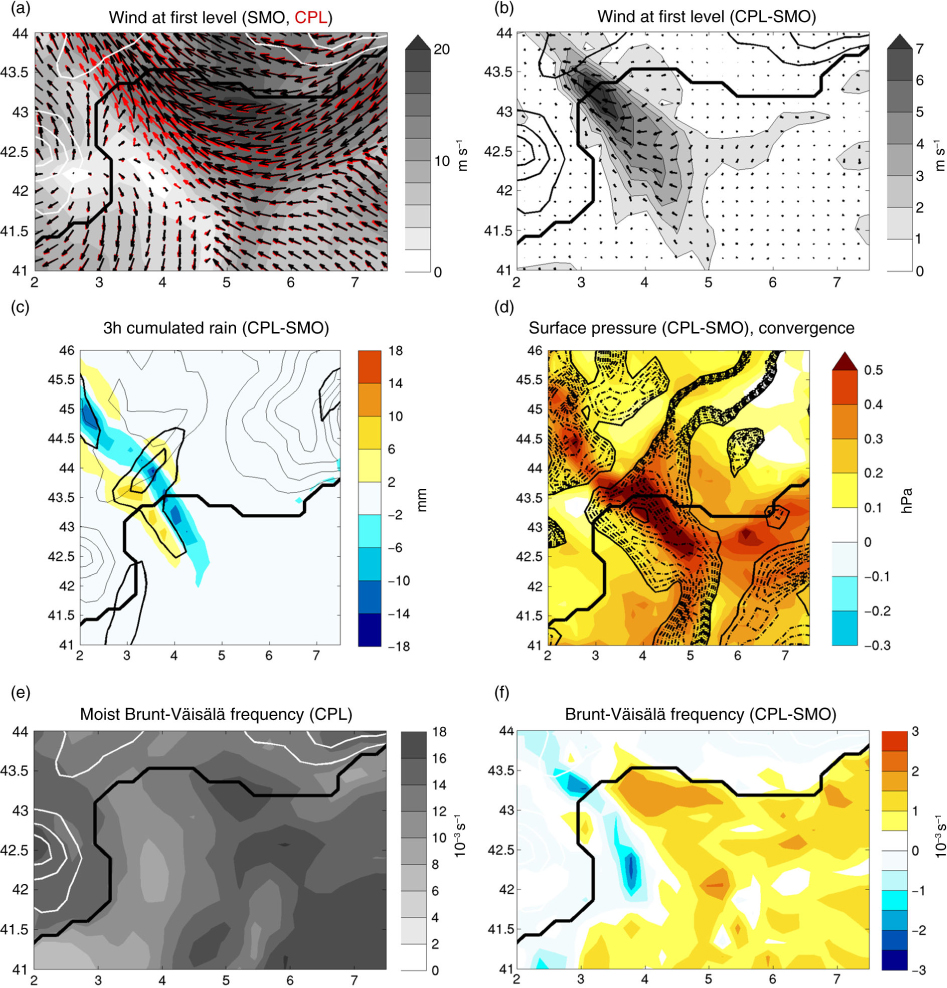
Fig. 8
Same figure as Fig. 7 on 23 September 1994 at 00 UTC.
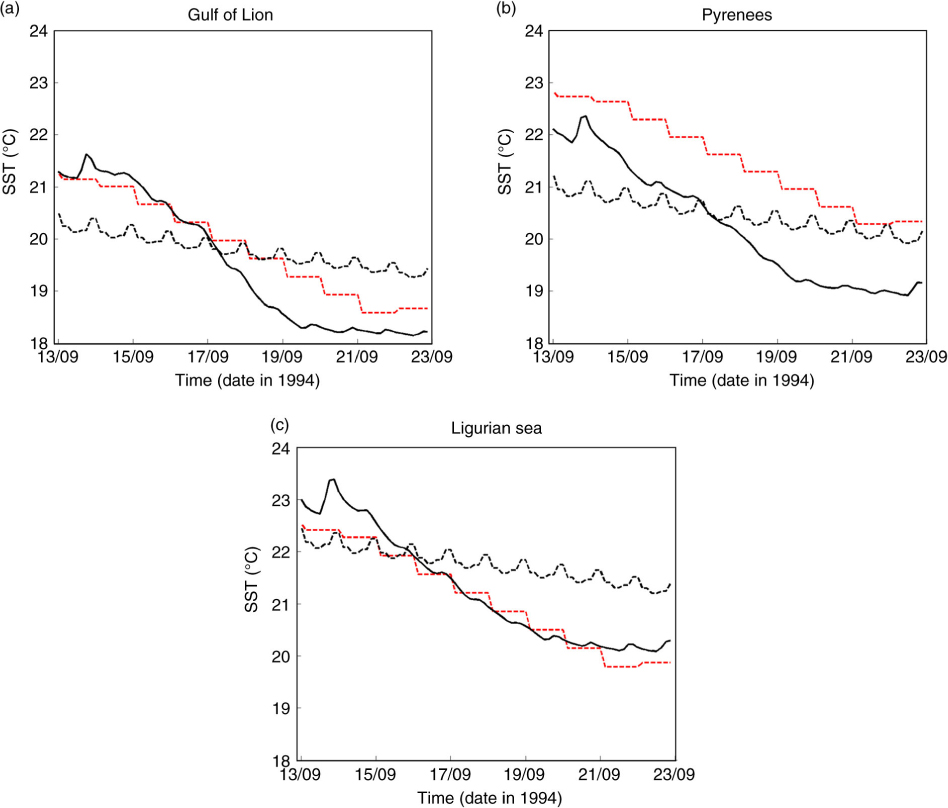
Fig. 9
SST (°C) averaged over the boxes presented in Fig. 4c: (a) box (GoL); (b) box (Py); (c) box (Li). CPL (black plain line), SMO (black dashed line), CTL (red dashed line).
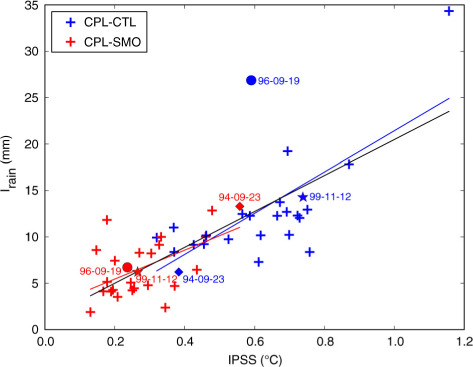
Fig. 10
Index of the precipitation difference (I rain) (mm) as a function of the coupling index IPSS (°C) for the 22 strongest events represented by the model in the Cévennes area. Each event is represented by one red and one blue cross: red crosses represent the calculation of I rain and IPSS for CPL-SMO and blue crosses for CPL-CTL. Moreover, three cases among the 22 are highlighted: squares show the case of 23 September 1994, discs show the case of 19 September 1996 and stars show the case of 12 November 1999.
Table 1. Coefficient of correlation calculated between I rain and IPSS (°C) with IPSS calculated on different regions indicated on the third line of the table and defined in Fig. 1
IPSSIPSSIPSSIPSSIPSSIPSSIPSSGoL+LiGoL+Co+PyGoLSouth MedTyBaGoL+Li, no conv
CPL-CTL0.660.640.600.51−0.090.330.63CPL-SMO0.560.520.540.410.520.480.62Both0.760.750.730.650.430.610.74