
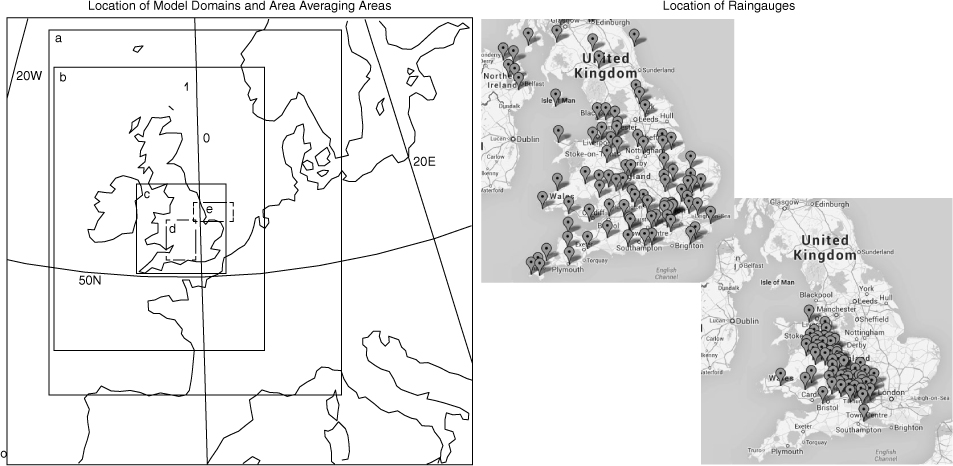
Fig. 1
Left: Location of the domains for all the runs (solid lines): a) the 12 km runs and 4 km runs forced directly from the global data, b) the 4 km runs nested within the 12 km runs, c) the 1.5 km runs. Also shown are the averaging areas used in the raingauge comparison, Section 2.4, (dashed lines): d) July, e) June. Right: Location of the raingauges used in the comparison to observations, Section 4.5, Met Office (top) and Environment Agency (bottom).

Fig. 2
The tracks of the July (left) and June (right) extra-tropical cyclone (blue) identified using the Hodges (1995) tracking method in the ECMWF Operational Analysis. For July, the green line shows a precursor storm that is considered to be associated with the main storm. The dates of the points indicated are at 0000.

Fig. 3
Lifecycles of the July (top) and June (bottom) 2007 events, including the precursor event. The black line represents Mean Sea Level Pressure (MSLP, hPa), the blue line precipitation (precip, mm/hr), the red line winds (m/s) and the green line 850 hPa relative vorticity (vor, ×10−5/s), taken from the ECMWF Operational Analysis. The grey area is when the storm was over the UK.
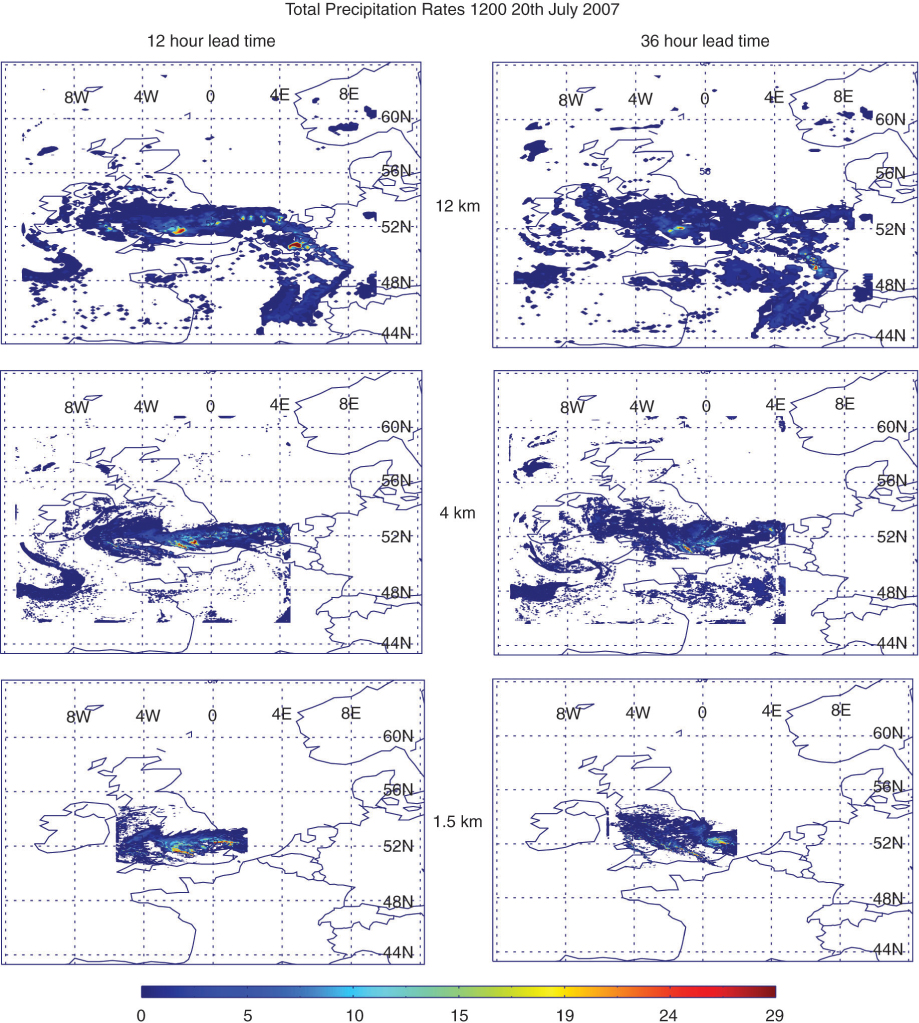
Fig. 4
Total precipitation rates from the model at 1200 on the 20th July 2007 for the 12-hour lead time (left) and the 36-hour lead time (right), for the 12 km run (top), 4 km run (middle) and 1.5 km run (bottom). Units are mm/hr.
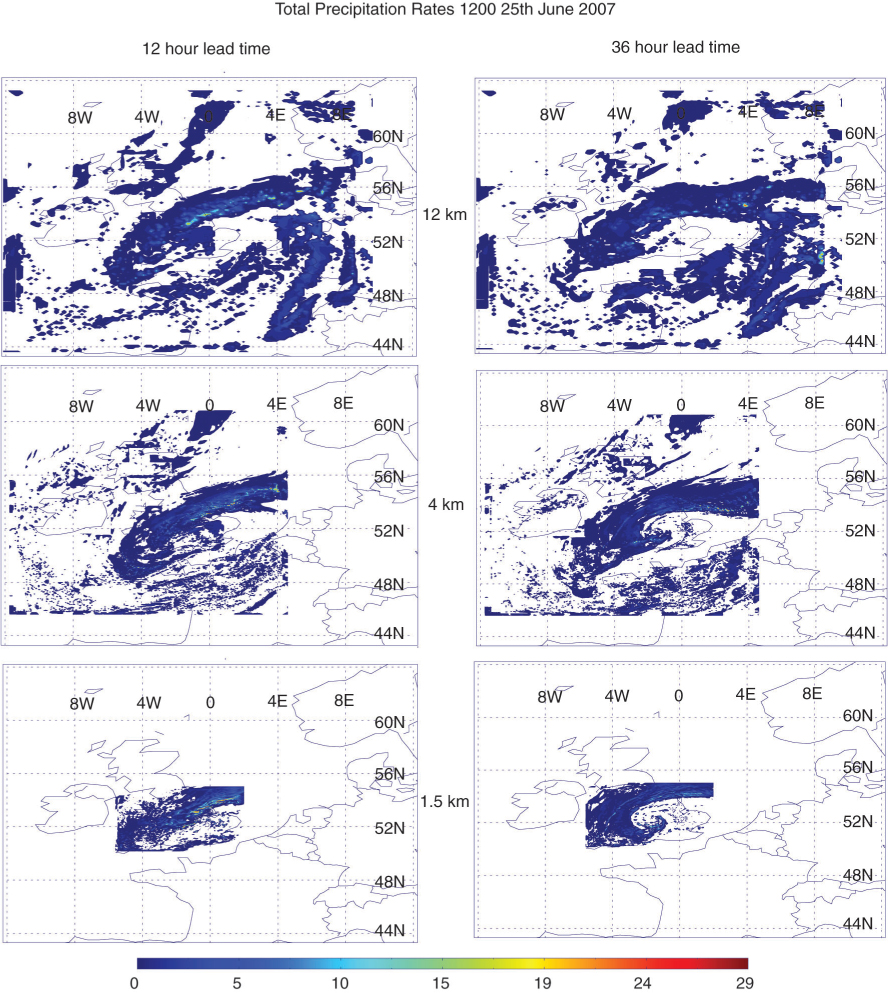
Fig. 5
Total precipitation rates from the model at 1200 on the 25th June 2007 for the 12-hour lead time (left) and the 36-hour lead time (right), for the 12 km run (top), 4 km run (middle) and 1.5 km run (bottom). Units are mm/hr.

Fig. 6
Cross-correlation between the precipitation fields from the 12-hour lead time and the 36-hour lead time for the 12 km (top), 4 km (middle) and 1.5 km (bottom) runs for July 2007 (left) and June 2007 (right). Red indicates a high correlation, blue shows a low correlation. The axes are the number of grid boxes shifted in each direction. The artificial periodicity is shown in the masked area.
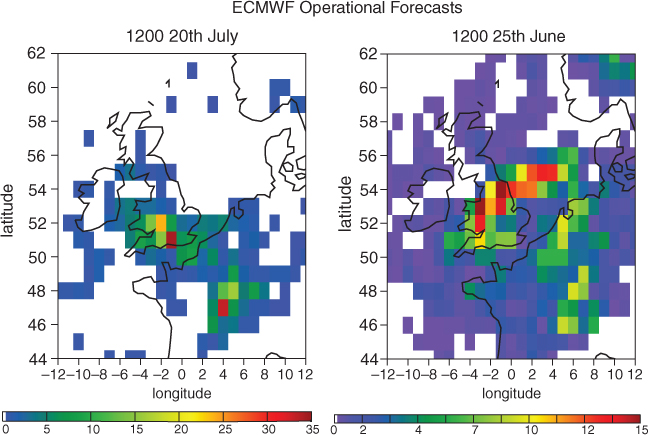
Fig. 7
Six-hour precipitation accumulation for 1200 on the 20th July 2007 (left) and for 1200 on the 25th June 2007 (right) from the ECMWF Operational Forecast, the Operational Analysis was used to drive the LAM. Units are mm, the minimum accumulation shown is 0.5 mm.
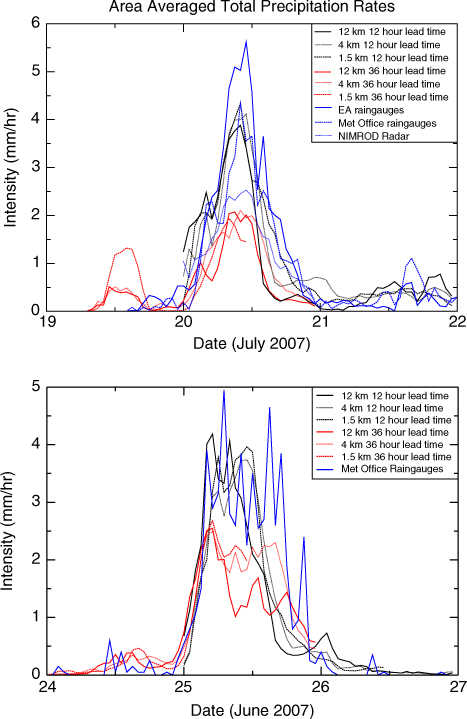
Fig. 8
Area averaged hourly precipitation rates for the model at a 12-hour lead time (black) and a 36-hour lead time (red) for resolutions at 12 km (solid), 4 km (dotted) and 1.5 km (dashed), and the average raingauge intensities (blue) for the MIDAS dataset (solid) and EA dataset (dashed, July only), for the July event (top) and the June event (bottom). The NIMROD data is shown as a dotted blue line (July only).