
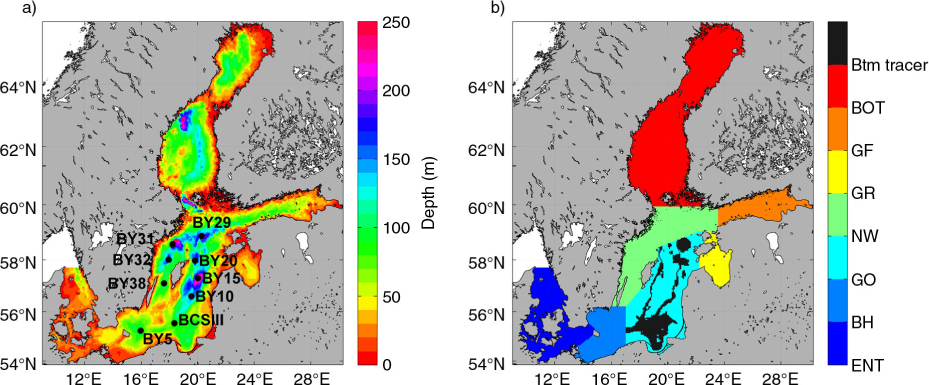
Fig. 1
Maps showing the RCO model bathymetry and nine standard monitoring stations (left, a) and the division of the model domain into Baltic Sea sub-basins (right, b). The bottom area at 60–99 m depth in the East Gotland Basin (black colour) used for the experiment with emulated sediment release of tracers (Btm tracer) is shown in the right panel. The model domain has an open boundary in the northern part of the Kattegat. Sub-basin abbreviations: Entrance area (ENT, including the Kattegat, the Danish sounds and the Arkona Basin), Bornholm Basin (BH), East Gotland Basin (GO), North-West Gotland Basin (NW), Gulf of Riga (GR), Gulf of Finland (GF) and the Gulf of Bothnia (BOT, including the Åland Sea, the Archipelago Sea, the Bothnian Sea and the Bothnian Bay). The volumes of the sub-basins are presented in Table 1. The Baltic Proper includes the NW, GO, BH and the Arkona Basin.
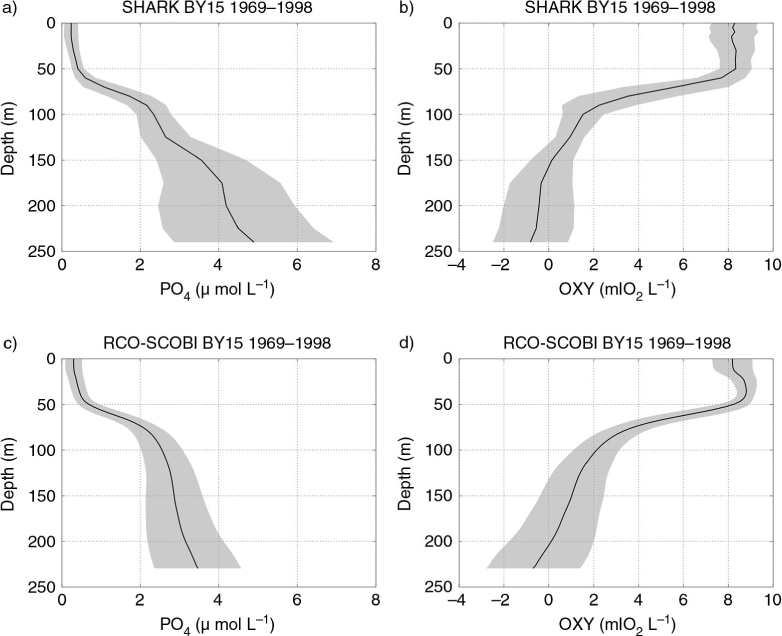
Fig. 2
Mean profiles and ±1 standard deviation (grey shaded area) from GO (station BY15) in the period 1968–1998 of phosphate (µmol PO4 L−1) and oxygen (ml O2 L−1) in left and right panels, respectively. Observations (from the Swedish Oceanographic Data Centre (SHARK) at the Swedish Meteorological and Hydrological Institute, http://www.smhi.se) are shown in the upper panels (a and b) and the corresponding RCO-SCOBI results are shown in the lower panels (c and d).
Table 1. The total volume and the surface layer volume (0–30 m) of the Baltic Sea sub-basins (in km3)
Total Baltic Sea1TB22 56210 297Kattegata2KA485397The Sounda3OR2323The Belt Seaa4BE420419Arkona Basina5AR406314Bornholm Basin6BH17491002East Gotland Basin7GO69532679North-West Gotland Basin8NW47911738Gulf of Riga9GR431366Gulf of Finland10GF1118703Archipelago Seab11AS4949Åland Seab12AL327104Bothnian Seab13BS43531715Bothnian Bayb14BB1455787
[i] The basin names and abbreviations used in the text are shown together with the corresponding basin numbers (Fig. 1).
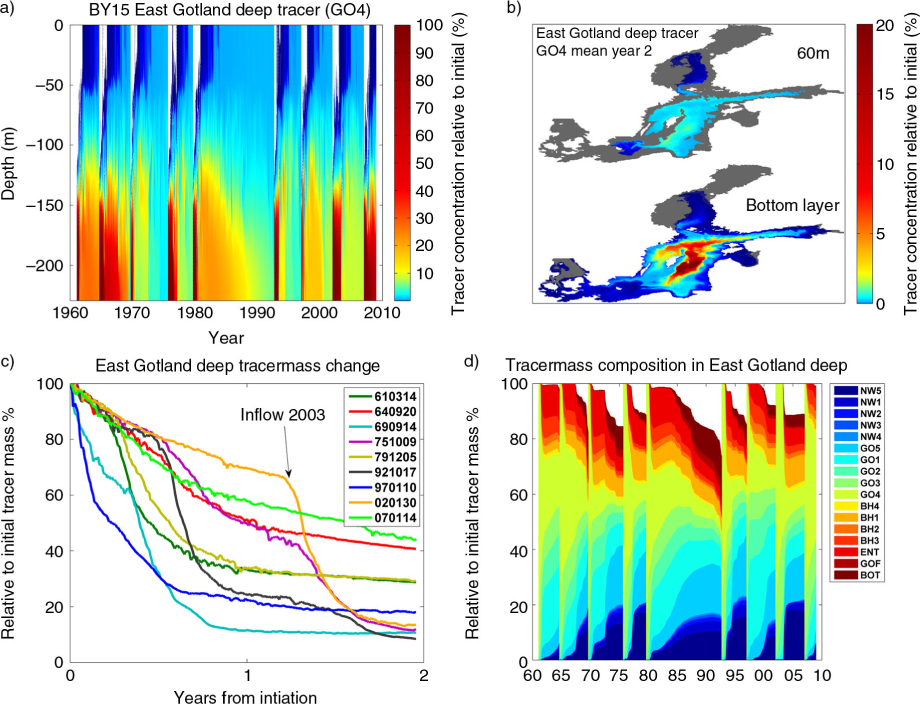
Fig. 3
Time series of vertical profiles of tracer GO4 at BY15 (upper left panel, a). Note the sharp gradient of colour scale used to separate the very low concentrations in panels a and b. The horizontal distribution (at 60 m depth and in the bottom layer) of the mean GO4 tracer concentration for all inflow cases 2 yr after the initiation dates is shown (in% of the initial concentration) (upper right panel, (b). The decline after inflows of the GO4 tracer mass below 150 m depth is summarised in the lower left panel (c). The initiation date (see legend in Fig. 3c) was in each new tracer case defined by the first day when a water mass originating from BH was observed in the Gotland Deep. The arrow indicates the start of the large deep water inflow in 2003 depicted more than 1 yr after the tracer initiation in 2002. The lower right panel (d) shows temporal changes of the relative contributions from different water masses to the tracer mass in the Gotland Deep below 150 m (see explanation of legend abbreviations in methods). The tracer mass is shown relative to the initial tracer mass (i.e. at each initiation occasion GO4 is equal to 100%). White colour indicates the influence from undefined waters without tracers.
Table 2. The volume (km3) of the sub layers with tracer initialisation
Sum all layers69 m–bottom35760.305GO169 m–99 m11820.101NW169 m–99 m8900.076GO299 m–123 m4240.036NW299 m–123 m3200.027GO3123 m–150 m2630.022NW3123 m–150 m1970.017GO4150 m–bottom1740.015NW4150 m–bottom1250.011
[i] The fraction of tracer water volume (RTV) relative to the total volume (11 744 km3) of GO and NW (Table 1) is also shown.
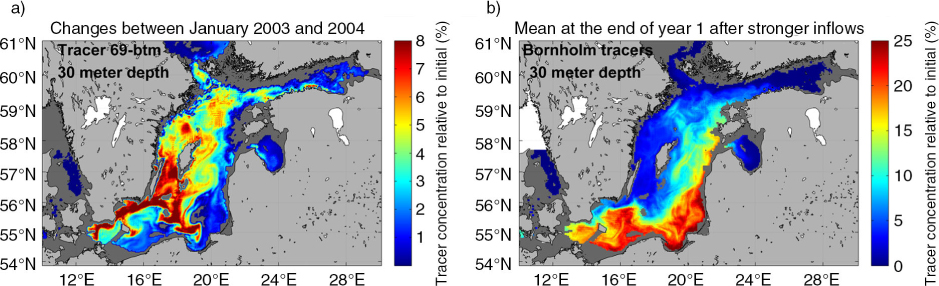
Fig. 4
The left panel shows the horizontal distribution of concentrations at 30 m depth of the tracers accumulated between the end of January 2003 and end of January 2004 (a). The sum of all GO and NW tracers initiated below 69 m are shown in% relative to the initial tracer concentration. The right panel shows the horizontal distribution at 30 m depth of the BH tracer concentration in the end of December (b). The mean for a sub set of years with stronger inflows is shown.
Table 3. Observed PO4 concentrations (µmol L−1) at 30 m depth in January 2003 and 2004
BY310.500.91182BY320.500.93186BY380.500.82164BY50.540.4583BSIII0.620.4776BY100.670.5481BY150.630.63100BY200.600.76127BY290.660.79120
[i] See positions of stations in Fig. 1. The last column shows the relative concentration in 2004 (in%) compared to the concentration in 2003.
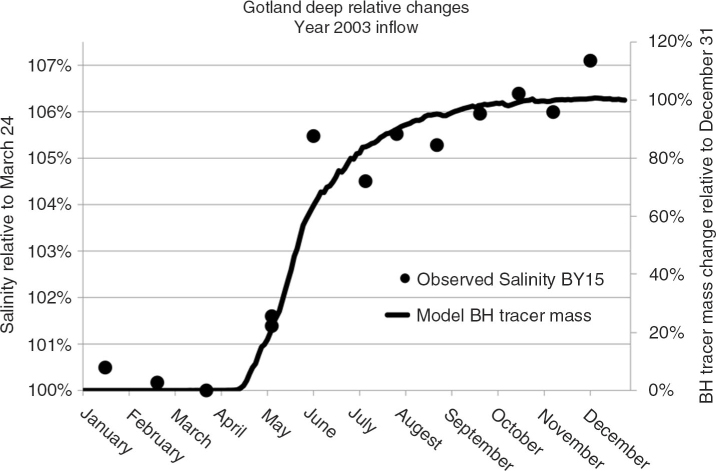
Fig. 5
The relative changes of salinity (observations from 200 m depth at station BY 15, SHARK data) and of the modelled inflow of BH tracer mass (51 m–btm) below 150 m depth in GO. The salinity change is shown relative to the situation just before the inflow while the tracer concentration (that is zero at start) is shown relative to the final concentration in order to make the results comparable.
Table 4. The relative contributions (RTV) from tracers found below 150 m in the East Gotland Deep at the end of 2003 and the mean PO4 concentration of the inflowing waters estimated from SHARK observations (column 2, rows 1–6)
1. GO118.72.272. GO28.03.133. GO35.43.664. BH 51–btm10.10.975. ENT18.90.406. Other24.20.567. GO414.86.298. GO4 (Jan 2004)2.109. Weighted mean–2.11
[i] The mean PO4 value (March–December) from 30 to 40 m depth in the Arkona Basin is used for the waters coming from the entrance area (ENT). The mean PO4 value (March–December) from BY15 0–70 m is used as a proxy for other water masses (row 6). The mean PO4 concentrations of the East Gotland Deep water in January 2003 and in January 2004 are shown in rows 7 and 8, respectively. The last row (9) shows the weighted mean calculated at the end of 2003 based on the relative contributions from different tracers.
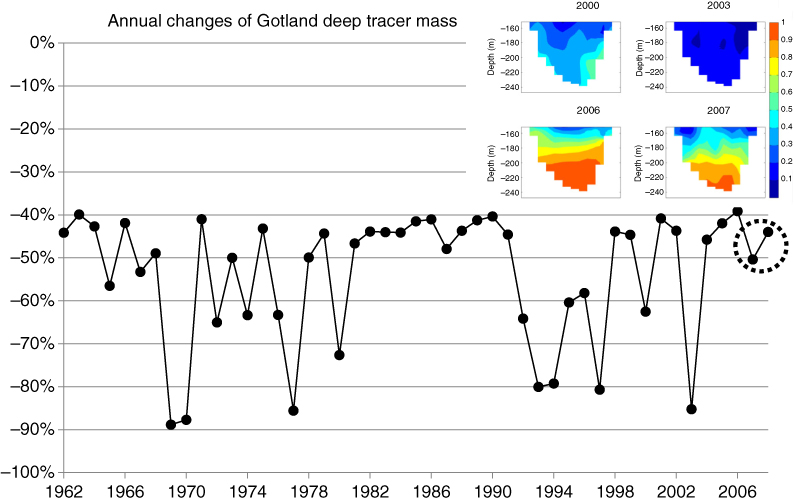
Fig. 6
Annual changes (relative to the initial value reset on January 1 every year) of tracer mass (GO4) in Gotland Deep (large solid dots). The dotted circle indicates the Baltic Sea tracer experiment period in 2007–2009 by Holtermann et al. (2012). The colour inlets show W–E transects (~E19.6°–E20.4°) in the central GO (~N57.3°) of the tracer concentration profiles (150 m–btm) at the end of December in the years 2000, 2003, 2006 and 2007.
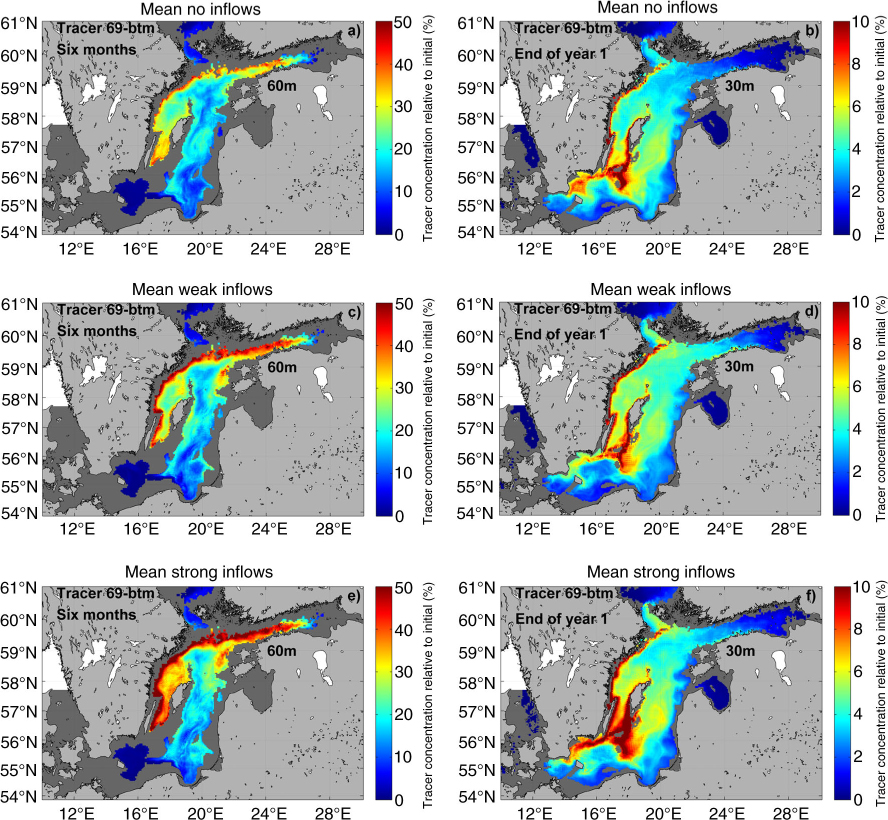
Fig. 7
The horizontal distribution of the mean tracer concentration at 60 m depth in end of June (left column) and at 30 m depth in the end of December (right column) from periods with no deep water inflows (upper panels, a and b), weaker inflows (middle panels, c and d) and with stronger inflows (lower panels, e and f). Note different scales of colour bars. The sum of all GO and NW tracers initiated below 69 m are shown.
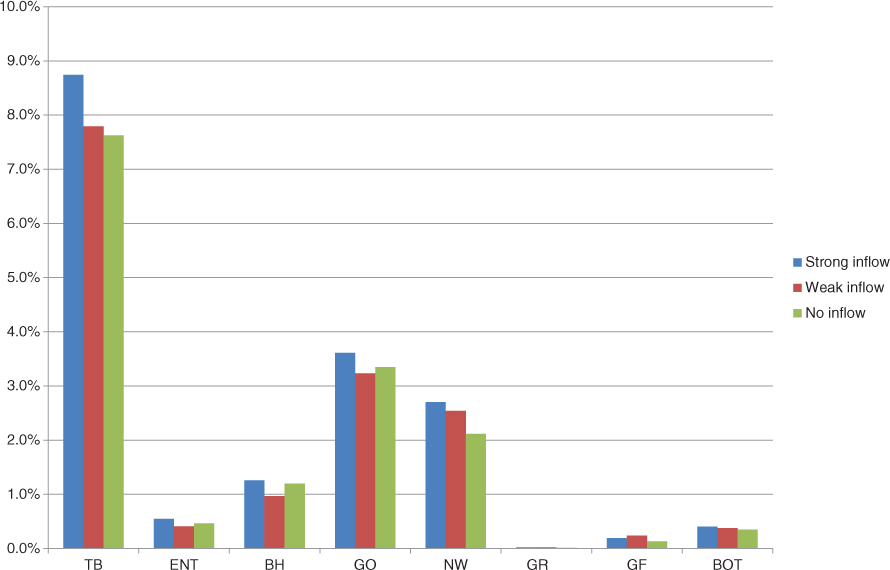
Fig. 8
The mean integrated amount of tracer from all GO and NW tracers initiated below 69 m (in% of the total initial mass) accumulated in the upper 30 m of the entire Baltic Sea (TB) and the sub-basins 1 yr after the initiation dates (end of December) in years with strong, weak or no inflow cases.
Table 5. The mean integrated amount of tracer (in% of the total initial mass) accumulated in the upper 30 m of the total Baltic Sea (TB) and the sub-basins 1 yr after the initiation dates (end of December) in years with strong, weak or no inflow cases (cf. Fig. 6)
Strong inflow8.70.51.33.62.70.00.20.4Weak inflow7.80.41.03.22.50.00.20.4No inflow7.60.51.23.32.10.00.10.4GO tracer strong6.00.20.53.91.30.00.10.0GO tracer weak5.60.10.43.51.40.00.10.1GO tracer no inflow5.50.20.53.51.20.00.00.0NW tracer strong12.41.02.33.34.60.00.40.9NW tracer weak10.70.81.72.94.00.00.50.8NW tracer no inflow10.40.92.13.13.30.00.30.8Bottom tracer no inflow100.01.54.771.019.81.21.10.7Bottom tracer weak inflow98.11.44.667.920.61.21.70.8Bottom tracer strong inflow87.71.74.660.917.81.11.10.5
[i] The ‘Strong’, ‘Weak’ and ‘No inflow’ rows show the relative contribution from all GO and NW tracers initiated below 69 m. The rows ‘GO tracer’ and ‘NW tracer’ show the individual relative fraction of uplifted GO and NW tracers (in% of the initial mass in each sub basin). The rows ‘Bottom tracer’ shows the relative contribution of bottom tracers accumulated in the upper 30 m (in% of the mean tracer mass 0–30 m in the TB in the no inflow case).
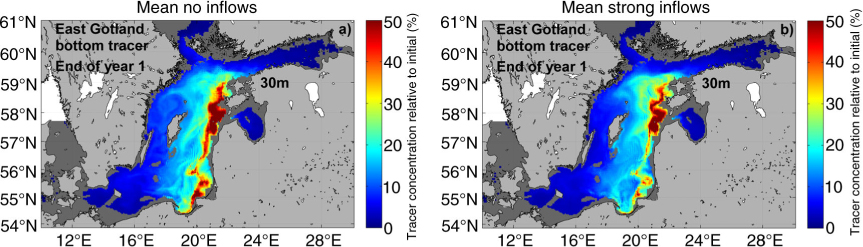
Fig. 9
The horizontal distribution at 30 m depth of the mean bottom tracer concentration (emulating phosphorus released from sediments at 60–99 m depth in GO see Fig. 1) in the end of December from periods with no deep water inflows (left, a) and with stronger inflows (right, b). The tracer concentration is shown relative to the constant bottom concentration set at the sediment interface. No larger differences were seen between the cases with no or only weak inflows (not shown).
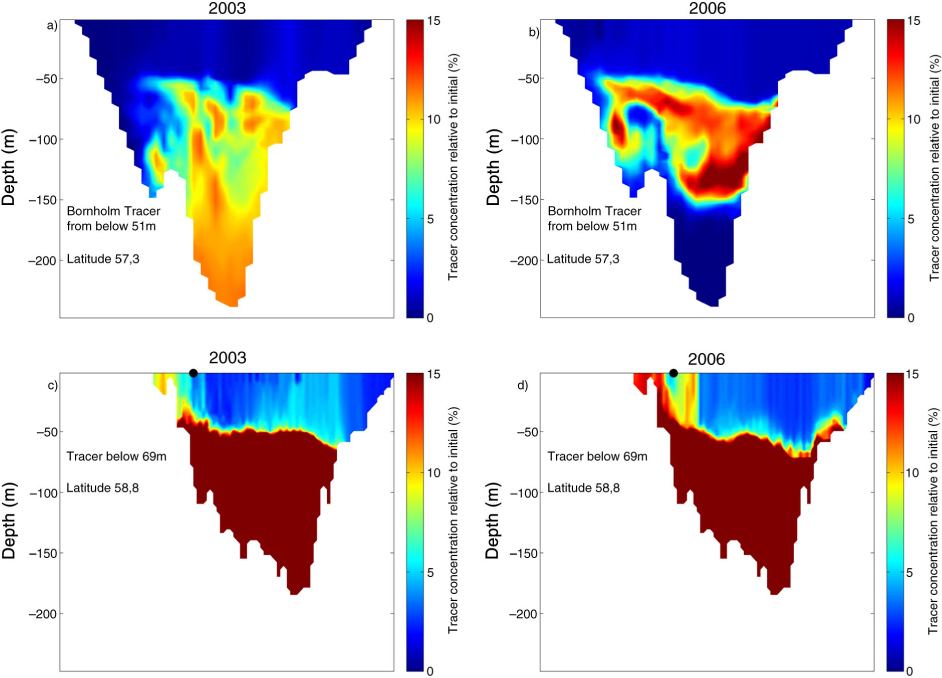
Fig. 10
West-to-east transects at the end of December in the years 2003 (left) and 2006 (right). The upper panels (a and b) show the Bornholm tracer (from below 51 m) concentrations between Gotland and Latvia at about N57.3° (in% of the initial concentration). The lower panels (c and d) show the tracer (from below 69 m) concentrations between Sweden and Estonia at about N58.8° (in% of the initial concentration). The black dots shown at surface level depict the position studied in Table 6.
Table 6. Changes of the upper level (H) of the 15% concentration of the bottom tracer below 69 m.
11 Jan 2003–165.913 Jan 2003121011.915 Jan 2003181218.517 Jan 20032465.97 Jan 2006–2364.19 Jan 20066586.811 Jan 200615187.713 Jan 200621287.0
[i] Model data were extracted from a position at about N58.8° E18.3° (cf. Fig. 10c and d). The first occasions with an observed rapid increase in level H in early January 2003 and 2006 are shown. The uplift is discretised due to the vertical grid resolution (3 m) and the 2-d output of the model run.