
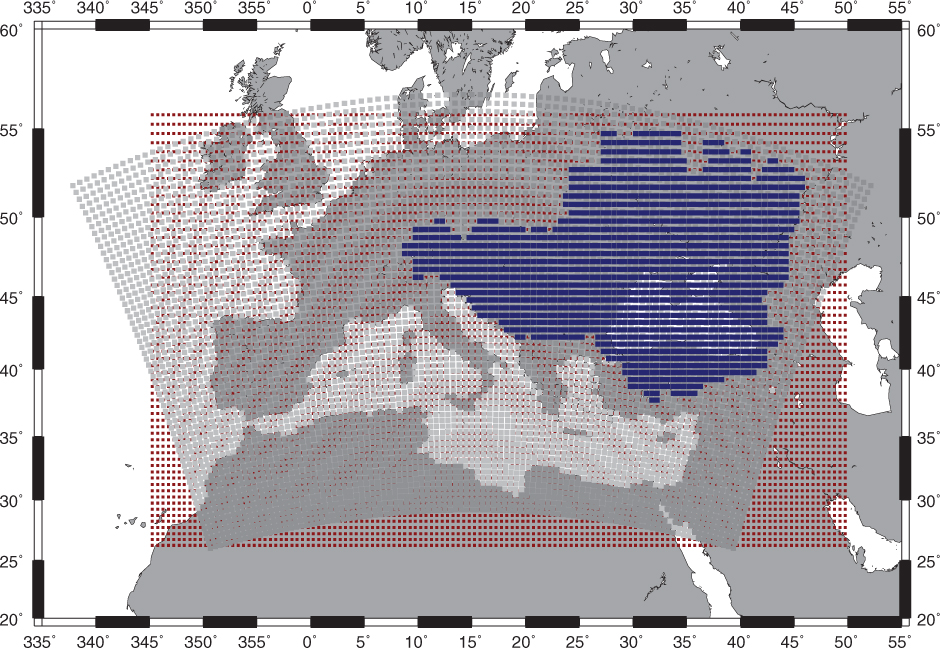
Fig. 1
ALADIN-Climate grid in grey, TRIP 0.5° in red, Black Sea drainage area in blue.
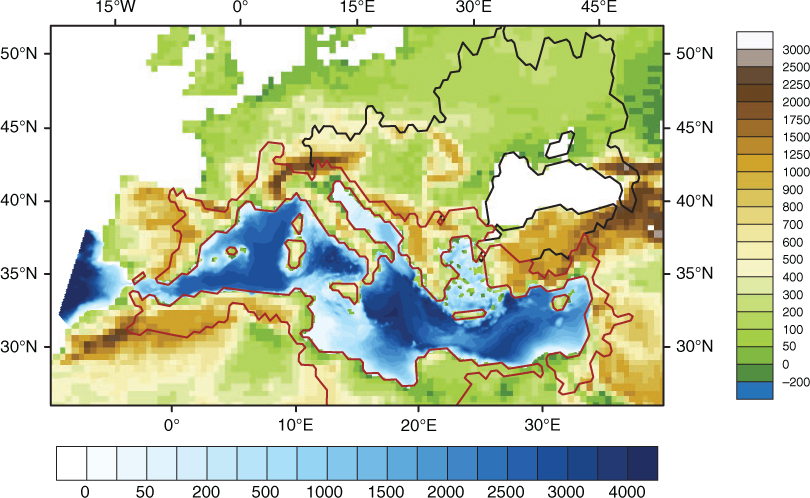
Fig. 2
ALADIN-Climate land–sea mask and orography (in m) for the Med-CORDEX domain, and NEMOMED8 bathymetry (in m). The drainage areas of the Black Sea (in black) and of the Mediterranean Sea (in red, cut North of 26°N, without the Nile basin) are contoured.
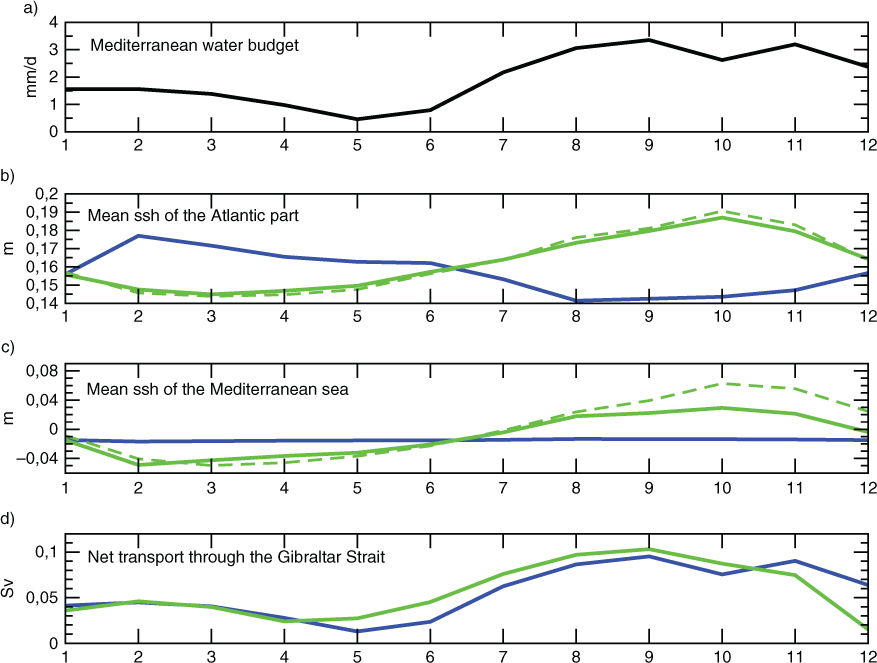
Fig. 3
Seasonal cycle of (a) the Mediterranean water budget, (b) the SSH of the Atlantic part, (c) the SSH of the Mediterranean and (d) the net water transport through the Gibraltar Strait, for two NEMOMED8 2003–2008 simulations, without SSH relaxation (blue), and with SSH relaxation (solid green). The reference NEMOVAR-COMBINE is in dashed green.
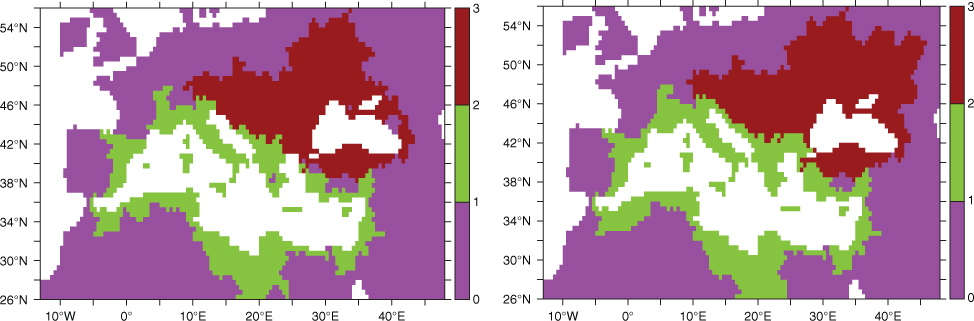
Fig. 4
Mediterranean (green) and Black Sea (dark red) drainage areas on the TRIP 0.5° grid, before (left) and after (right) the modifications.
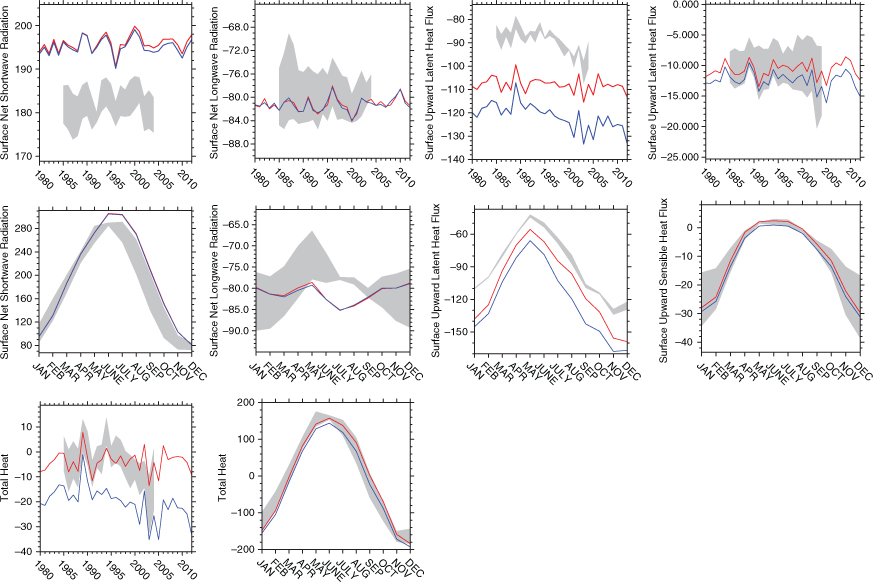
Fig. 5
Time series of yearly averaged heat fluxes in W/m2 (shortwave, longwave, latent, sensible, top), their seasonal cycle (middle); total heat flux and seasonal cycle (bottom); RCSM4 in red, ARCM in blue, observations in grey; the seasonal cycles are computed over the 1985–2004 period.
Table 1. Mean values for the shortwave, longwave, latent, sensible and total heat fluxes over the Mediterranean Sea for the 1985–2004 period in W/m2
RCSM4196−81−108−11−4ARCM196−82−120−12−19
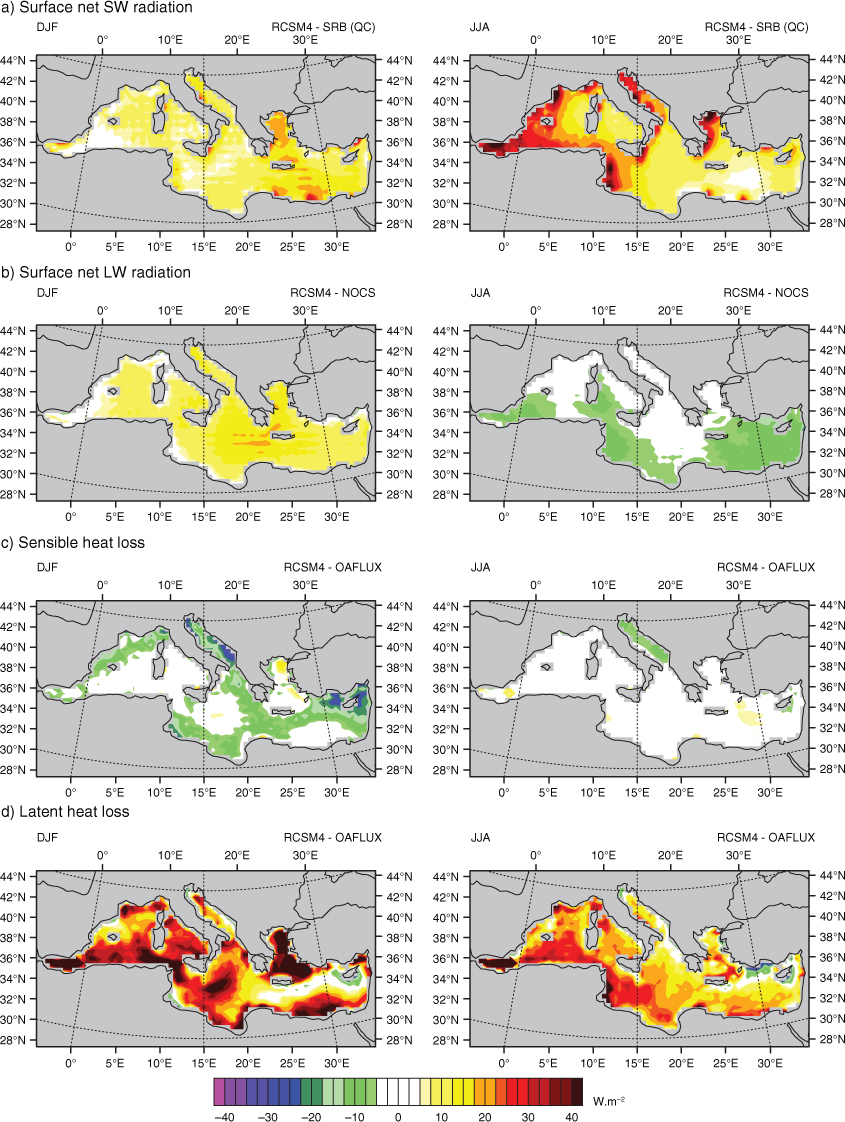
Fig. 6
Winter (DJF, left) and summer (JJA, right) difference (in W/m2) between RCSM4 and different observations for the 1984–2007 period.
Table 2. Water, heat and salt budgets of the Mediterranean given by the coupled simulation and the observations
Water inflow at Gibraltar0.85 Sv0.81 (Soto-Navarro et al. 2014)Water outflow at Gibraltar−0.80 Sv−0.78 Sv (ibid)Net water flux at Gibraltar0.05 Sv0.04–0.10 Sv (see text)Water flux through the surface−0.67 m/yr or 0.05 Sv−0.43 to – 0.66 m/yr (Sanchez-Gomez et al., 2011)Heat flux through the surface−5.1 W/m2−3 to–10 W/m2 (see text)Heat flux at Gibraltar6.8 W/m2Heat content change0.007°K/yr or 1.4 W/m2Salt transport at Gibraltar1.1016 g/yr or 0.003 psu/yrMediterranean salt content change1.1016 g/yr or 0.003 psu/yrEvaporation RCSM41.39 m/yr1.09 to 1.13 m/yr (Sanchez-Gomez et al., 2011)Evaporation ARCM1.53 m/yrPrecipitation RCSM40.51 m/yr0.26 to 0.59 m/yr (ibid)Precipitation ARCM0.58 m/yrE – P RCSM40.89 m/yr0.50 to 0.88 m/yr (ibid)E – P ARCM0.95 m/yrRunoff0.13 m/yrRunoff (1980–2000)0.13 m/yr0.13 m/yr (Ludwig et al., 2009)Black Sea0.09 m/yrBlack Sea (1980–1997)0.10 m/yr0.11 m/yr (Stanev and Peneva, 2002)
Table 3. Correlation and bias of the daily atmospheric and oceanic parameters available from the AZUR and LION buoys with the outputs of RCSM4
AZUR0.740.210.960.610.810.170.523.30.630.14LION0.84−0.110.970.300.90−0.170.612.10.75−0.52
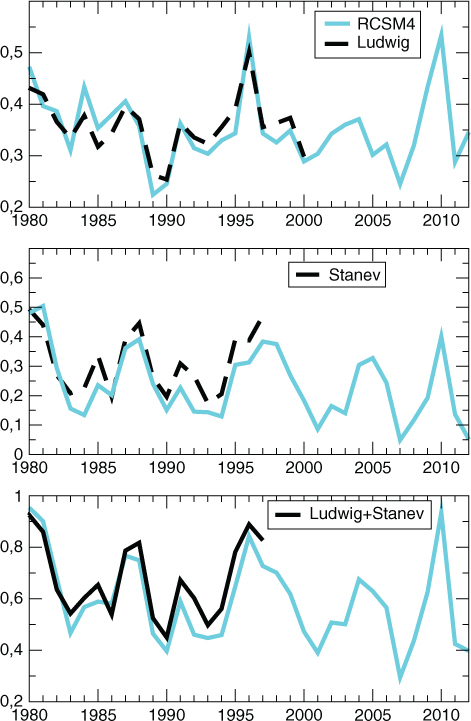
Fig. 7
Annual mean of the river runoff in the Mediterranean Sea without the Black Sea (top, mm/day) compared to the Ludwig database, of the E–P–R budget of the Black Sea (middle, mm/day) compared to the Stanev and Peneva data, and of the total inflow of freshwater (bottom, mm/day) compared to the addition of Ludwig and Stanev data.
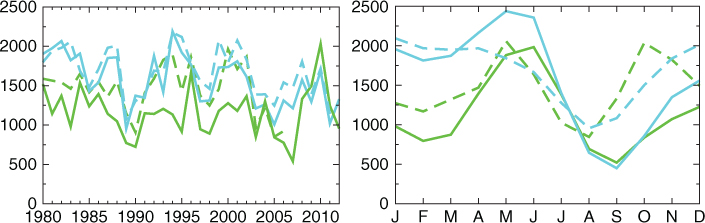
Fig. 8
Time series of the yearly river discharge (left) and mean seasonal cycle (right) in m3/s of the Rhône (blue, 1980–2011) and the Po (green, 1980–2006), observations in dashed lines.
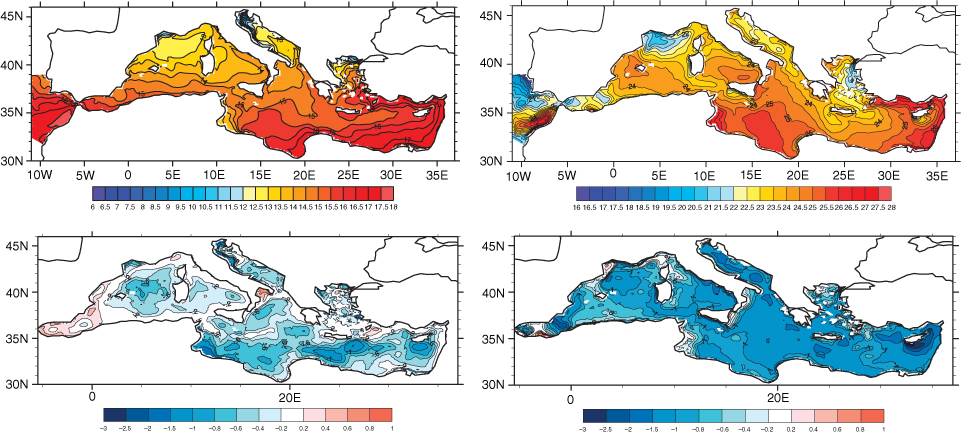
Fig. 9
RCSM4 SST in winter (JFM, top left), and summer (JAS, top right), averaged over the 1980–2012 period; difference between the RCSM4 SST mean and the Marullo mean climatology in winter (JFM, bottom left), and summer (JAS, bottom right), for the 1985–2007 period; SST in °C.
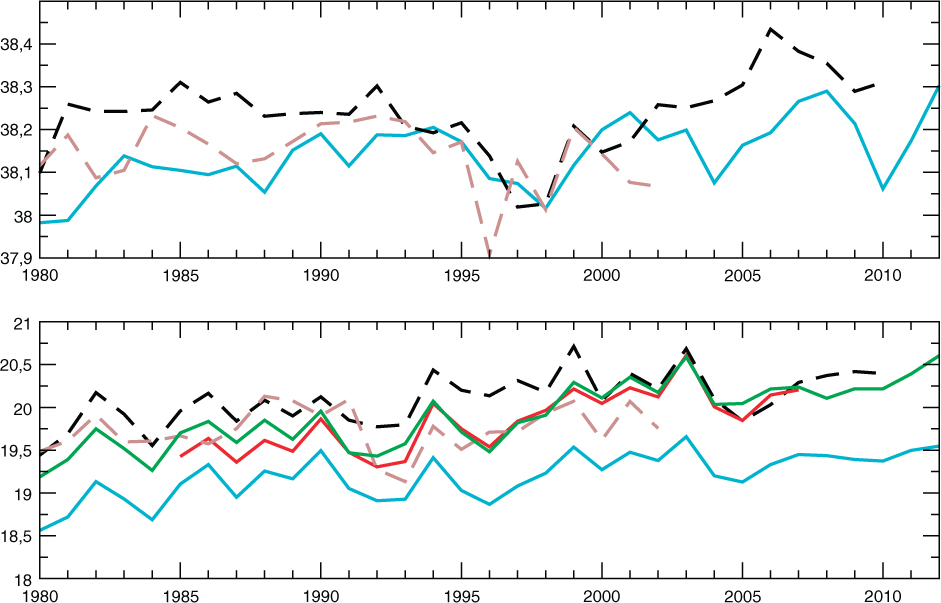
Fig. 10
Time series of the yearly mean SSS (psu, top) and SST (°C, bottom) averaged over the Mediterranean basin of RCSM4 (blue) compared to the EN3 (black dashed), Rixen (brown dashed), Marullo (red) and ERA-Interim (green) climatologies.
Table 4. Mean and standard deviation of the Mediterranean Sea averaged SST and SSS on the indicated periods
SST °C (std. dev.)19.18 (0.27)20.10 (0.30)19.11 (0.27)19.74 (0.26)19.23 (0.22)19.83 (0.35)19.20 (0.27)19.90 (0.38)Correlation0.860.560.850.93SSS (psu) (std. dev.)38.14 (0.08)38.24 (0.09)38.12 (0.07)38.14 (0.08)Correlation0.450.23
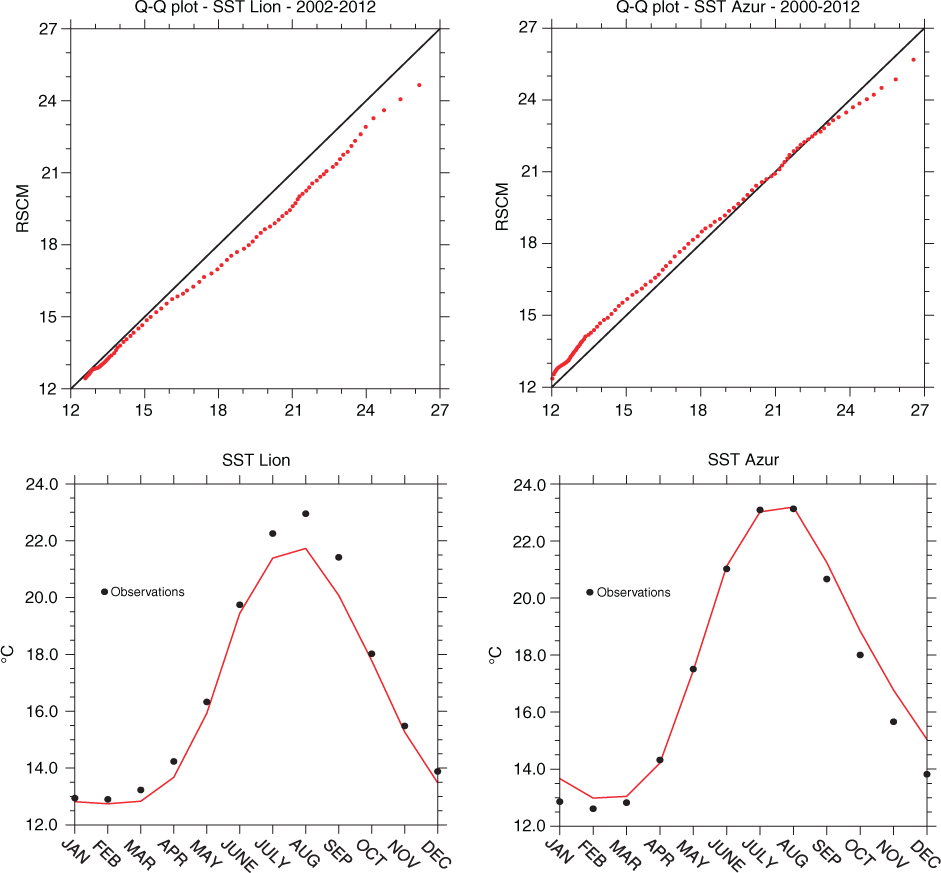
Fig. 11
Q–Q plot of the daily SST (°C) at the locations of the LION buoy (top left) and AZUR buoy (top right); seasonal cycle of the SST (bottom); observed values (dots) stand for the buoys.
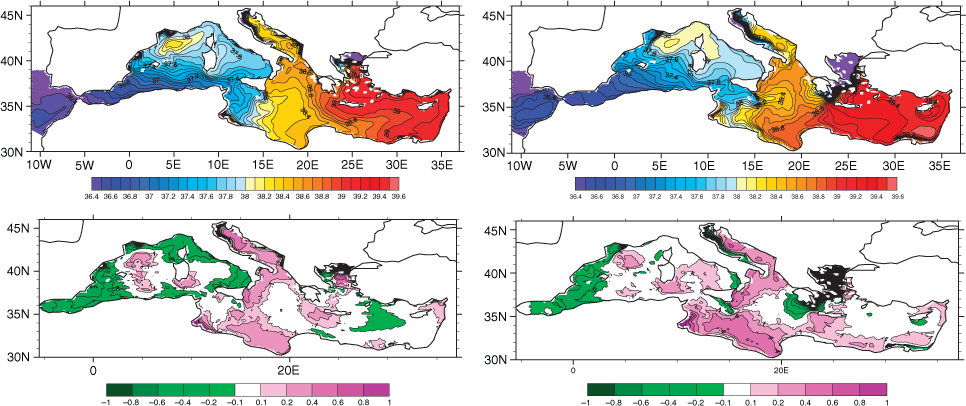
Fig. 12
RCSM4 SSS (psu) in winter (JFM, top left), and summer (JAS, top right), averaged over the 1980–2012 period; difference between the RCSM4 SSS mean and the EN3 mean climatology in winter (JFM, bottom left), and summer (JAS, bottom right), for the 1980–2010 period.
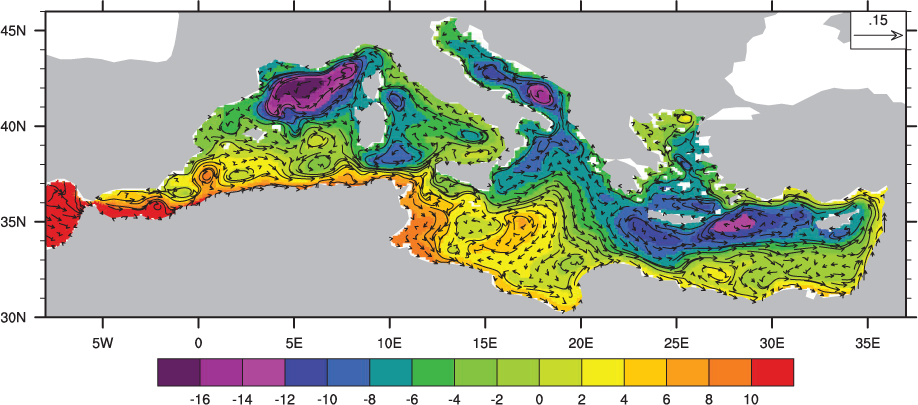
Fig. 13
1980–2012 dynamic SSH (in cm) and currents at 25 m (in m/s).
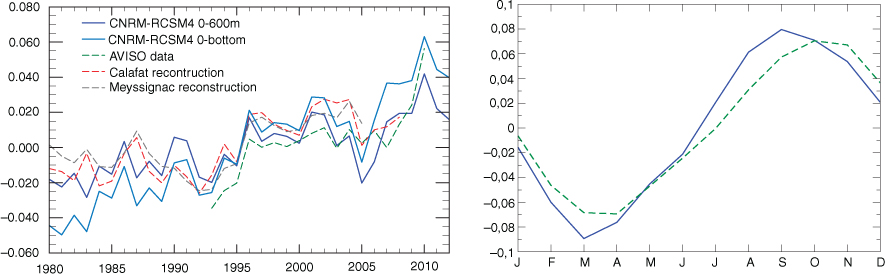
Fig. 14
Time series of mean sea-level anomalies centred on the mean of the reference period for each dataset (left, in m). For the model data, the dynamic SSH is added to the thermosteric term, which is computed over the full water column (CNRM-RCSM4 0–bottom) or the 0–600 m layer (CNRM-RCSM4 0–600 m). Model data are compared to observations (AVISO) and reconstructions (Calafat and Jordà 2011; Meyssignac et al. 2011). The model seasonal cycle is compared to AVISO data (right).
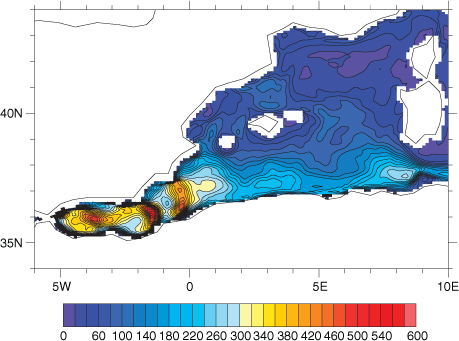
Fig. 15
Geostrophic Eddy Kinetic Energy (cm2/s2) computed from the daily SSH for the 1980–2012 period.
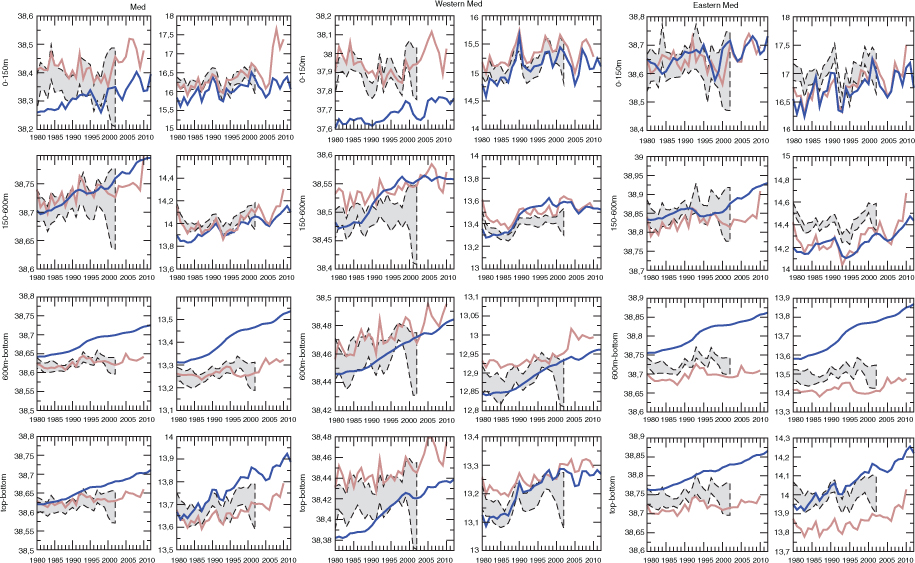
Fig. 16
Time series of Mediterranean (left), Western (middle) and Eastern Mediterranean (right) of yearly mean of salinity (in psu) and potential temperature (in °C). RCSM4, in dark blue, is compared to the Rixen climatology (uncertainty shaded in grey), and the EN3 climatology in brown. They are computed for 3 layers (0–150 m, 150–600 m, 600 m–bottom) and the whole column (top–bottom).
Table 5. Mean values of temperature and salinity of different layers of the Mediterranean basin for EN3, the simulation, and correlation
EN313.6716.3314.0213.2738.6338.4238.7438.63RCSM413.7716.0413.9613.4138.6638.3138.7438.68Correlation0.860.920.780.680.730.450.670.69
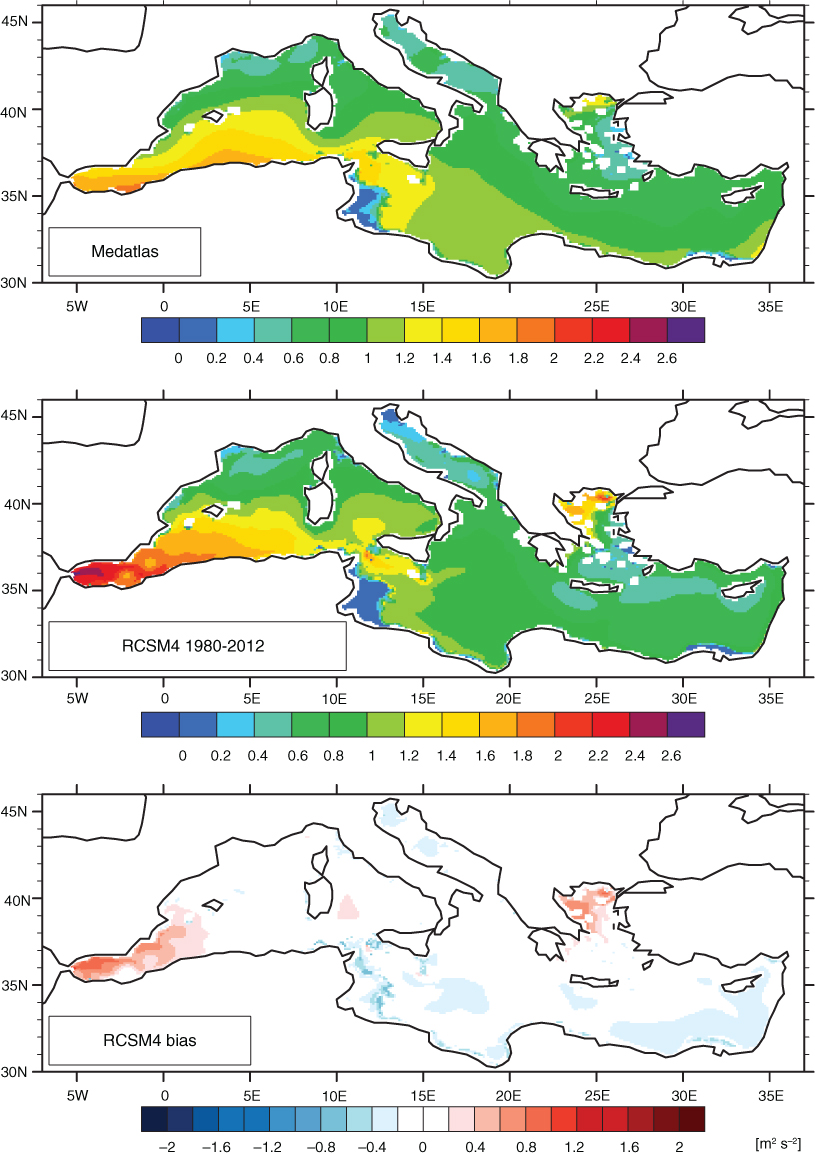
Fig. 17
Stratification Index computed for the 0–150 m layer, MEDATLAS (top), RCSM4 (middle) and bias (bottom).
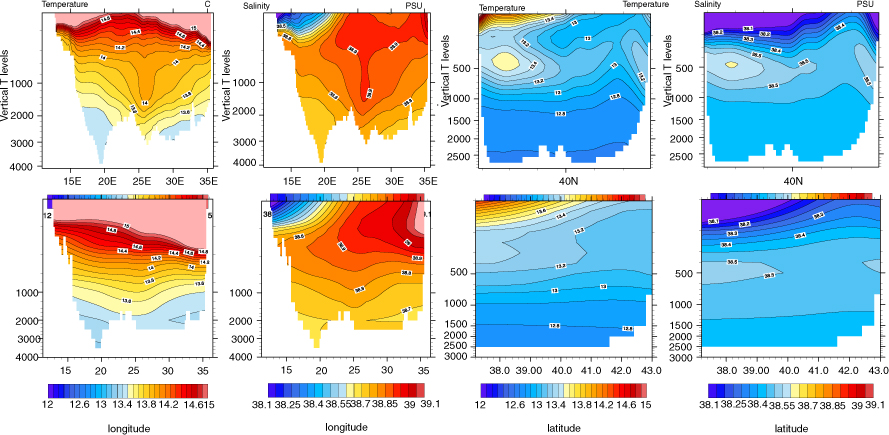
Fig. 18
Temperature (in °C) and salinity (in psu) transects at 34°N in the Eastern basin (2 left columns) and 5°E in the Western basin (2 right columns) of RCSM4 (up) and Rixen (bottom) for the 1980–2002 period.
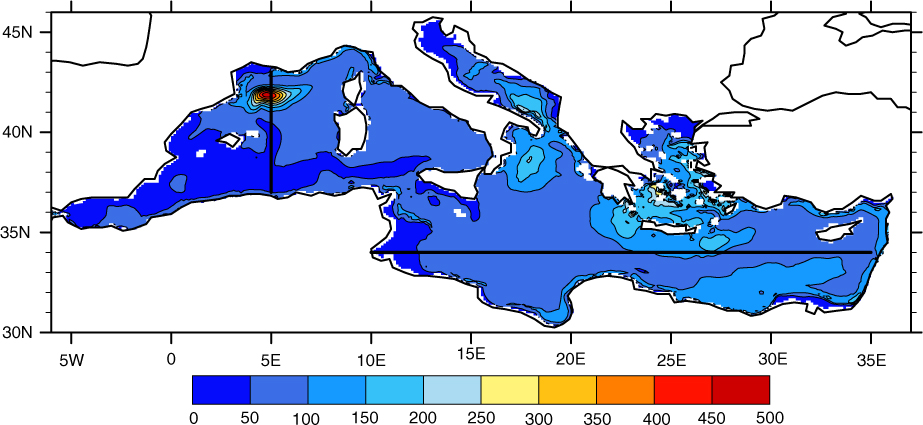
Fig. 19
1980–2012 winter (JFM) mixed layer depth (in m). 5°E and 34°N sections (lines).
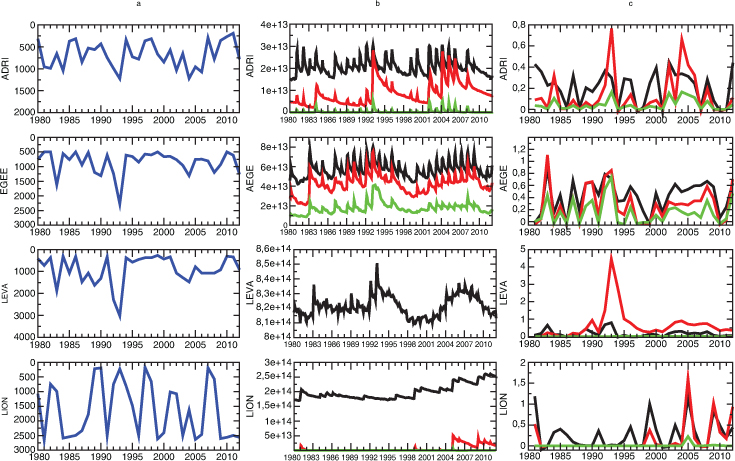
Fig. 20
a: Daily maximum each year of the mixed layer depth (in m) in the four sub-basins Adriatic Sea (ADRI), Aegean Sea (AEGE), Levantine basin (LEVA), and Gulf of Lions (LION); b: Monthly volume of water in m3 with density larger than 29.1 (black), 29.2 (red), and 29.3 (green) for ADRI, AEGE and LEVA. For LION the thresholds are 29.10 (black), 29.11 (red) and 29.12 (green); c: Formation rate in Sv for water with density greater than the same thresholds as b.
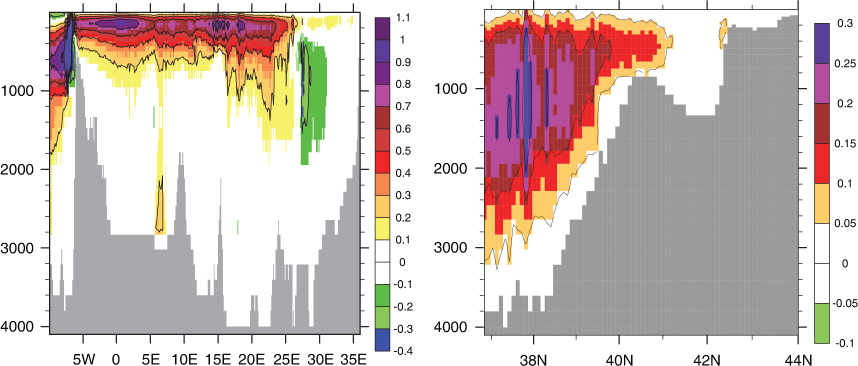
Fig. 21
1980–2012 zonal overturning stream function of the MED (left), meridional overturning stream function on the Adri-Ionian basin (right), in Sv.
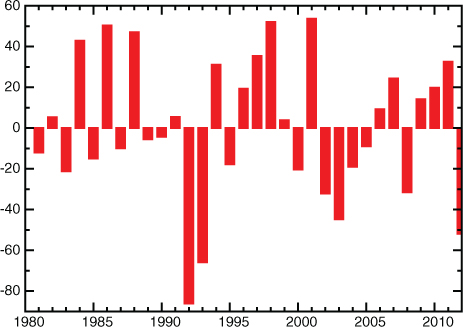
Fig. 22
Anomalies of winter (NDJF) surface heat flux averaged over the Aegean Sea (in W/m2).
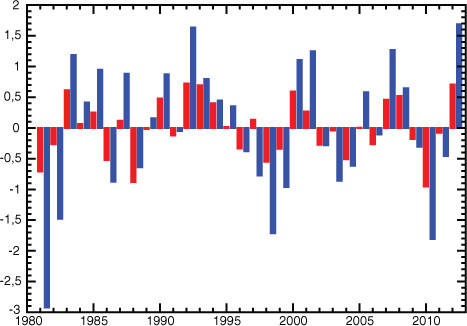
Fig. 23
Anomalies of winter (NDJF) E–P (red), and E–P–R–B (blue) averaged over the Aegean Sea (in m/yr).
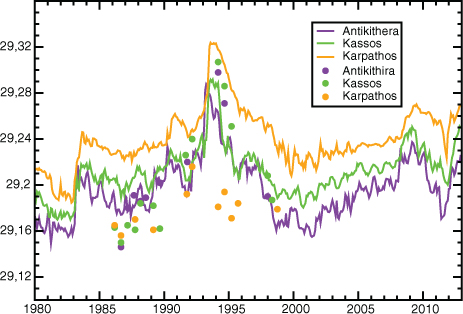
Fig. 24
Monthly potential density (in kg/m3) simulated on the bottom of the Cretan Arc sills (lines) and observed south of the sill channels (circles).
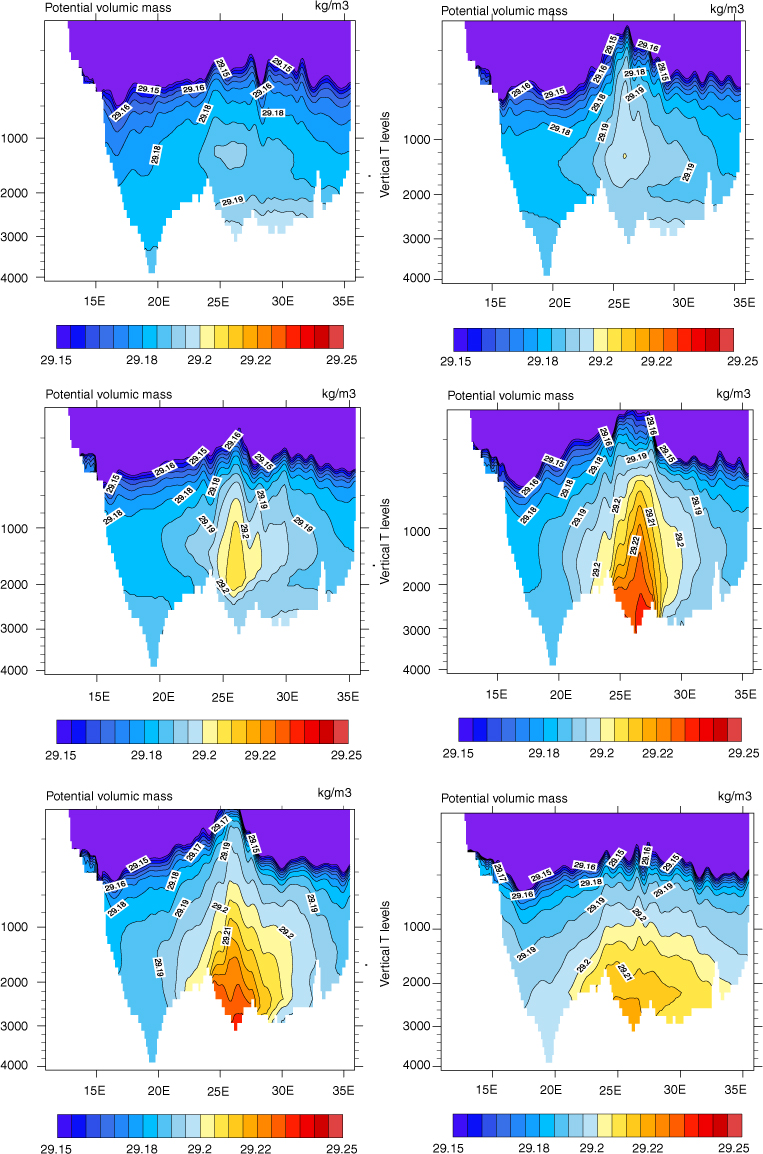
Fig. 25
Density transects for May at 34°N, for years 1980 (top left), 1989 (top right), 1991 (middle left), 1994 (middle right), 1995 (bottom left) and 2000 (bottom right).