
Fig. 1
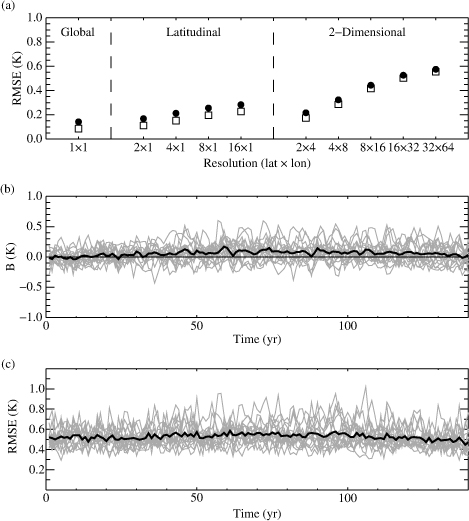
Multimodel mean and temporal mean (over the 70–140 yr period) of RMSE(t) (solid circles) and RMS ctl (t) (squares) for different spatial resolutions (a) and temporal evolution for individual AOGCM values (grey lines) and multimodel mean (thick line) of the bias B(t) (b) and the root-mean-square error RMSE(t) (c) for the 16×32 grid.
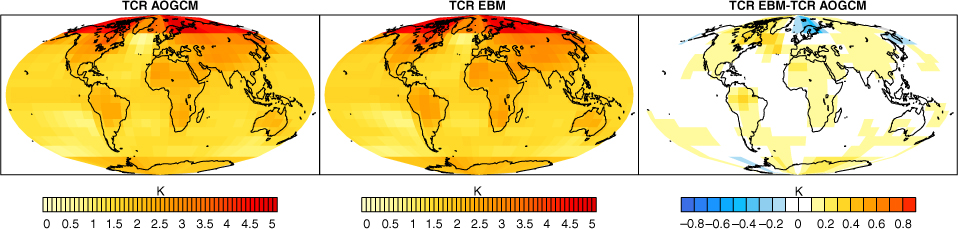
Fig. 2
(Left) Multimodel mean of the AOGCM regional transient temperature response TCR (mean over the period 55–85 yr of the 1% yr−1 CO2 experiment). (Middle) Mean of the corresponding regional temperature responses as predicted by the EBM calibrated with the AOGCM abrupt experiment, and the difference between the two (right).
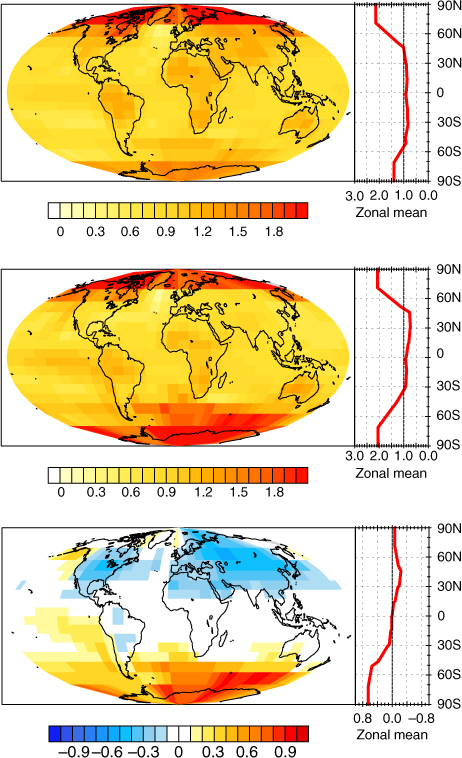
Fig. 3
Multimodel mean of the pattern functions (top), (middle) and their difference (bottom). The corresponding zonal mean is also shown for each pattern (red line, right panels).