
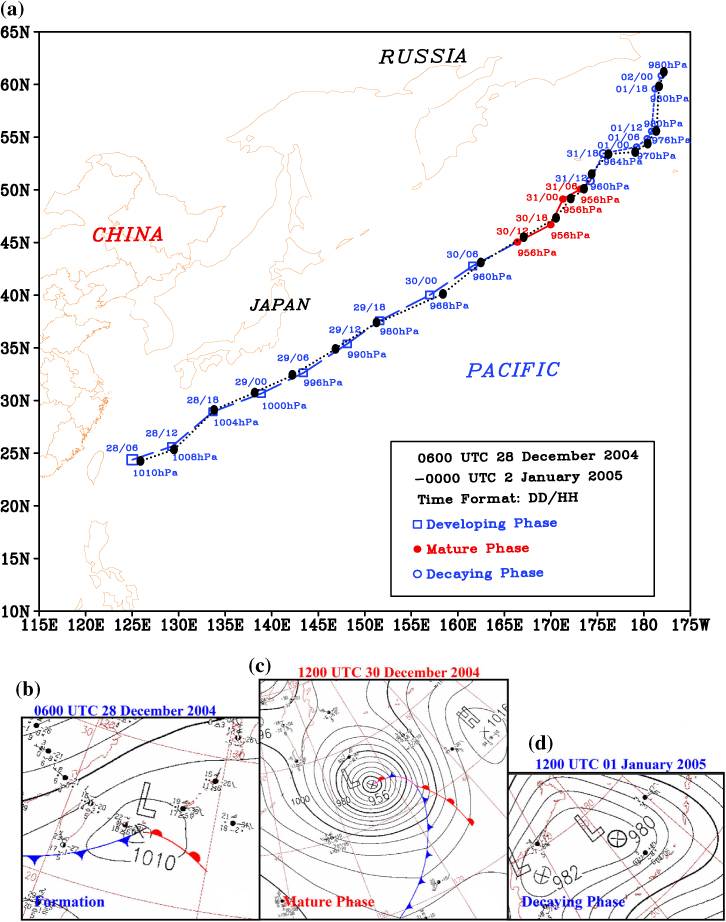
Fig. 1
(a) Track and central SLP (hPa) of the explosive cyclone, where the black dotted line represents the track and centres of the simulated cyclone, and the blue and red dashed lines stand for the track and centres of the observed cyclone. (b) The representative phase of the cyclone (observation), where the solid line is SLP (units: hPa) for 0600 UTC 28 December 2004; (c) and (d) are the same as (b), but for 1200 UTC 30 December 2004 and 1200 UTC 01 January 2005, respectively.
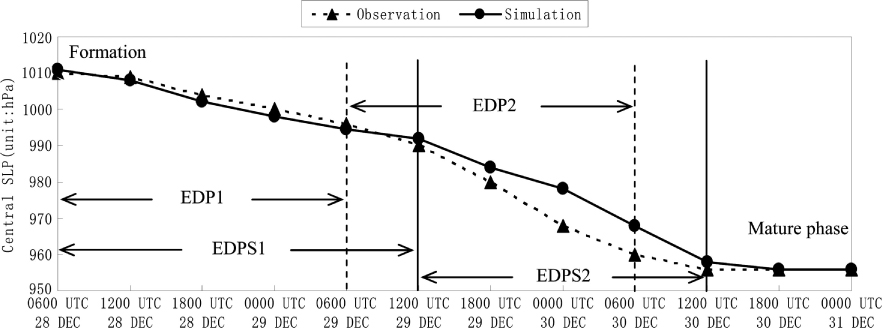
Fig. 2
The central SLP (units: hPa) of both observed and simulated explosive cyclones, where the triangles/broken line stand for observations and the circles/solid line represent simulations. EDP1 and EDP2 are the initial and latter explosive developing stages of the observed cyclone respectively.
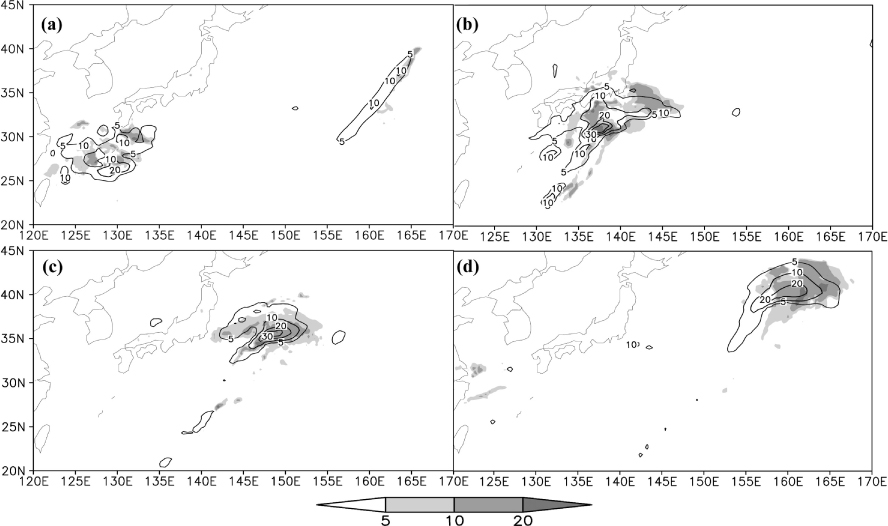
Fig. 3
Three-hour precipitation of the explosive cyclone (units: mm), where shaded areas represent the 3 hours precipitation from ‘3B42’ and the solid line is simulated 3 hours rainfall (units: mm): (a) 1200 UTC 28 December 2004; (b) 0000 UTC 29 December 2004; (c) 1200 UTC 29 December 2004; and (d) 0000 UTC 30 December 2004.
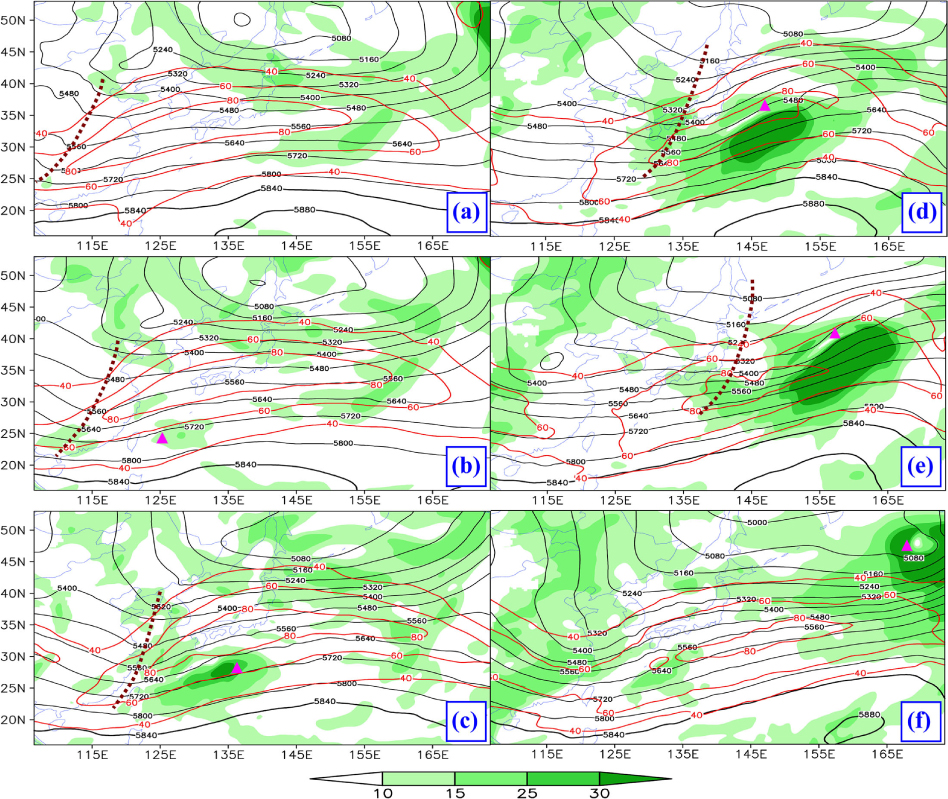
Fig. 4
Geopotential height at 500 hPa (solid, units: gpm), ULJ at 200 hPa (dashed lines, with contour intervals of 20 m s−1) and LLJ at 850 hPa (shaded, units: m s−1), where purple triangles stand for locations of the cyclone centre: (a) 0000 UTC 28 December 2004; (b) 0600 UTC 28 December 2004; (c) 1800 UTC 28 December 2004; (d) 1200 UTC 29 December 2004; (e) 0000 UTC 30 December 2004; and (f) 1800 UTC 30 December 2004.
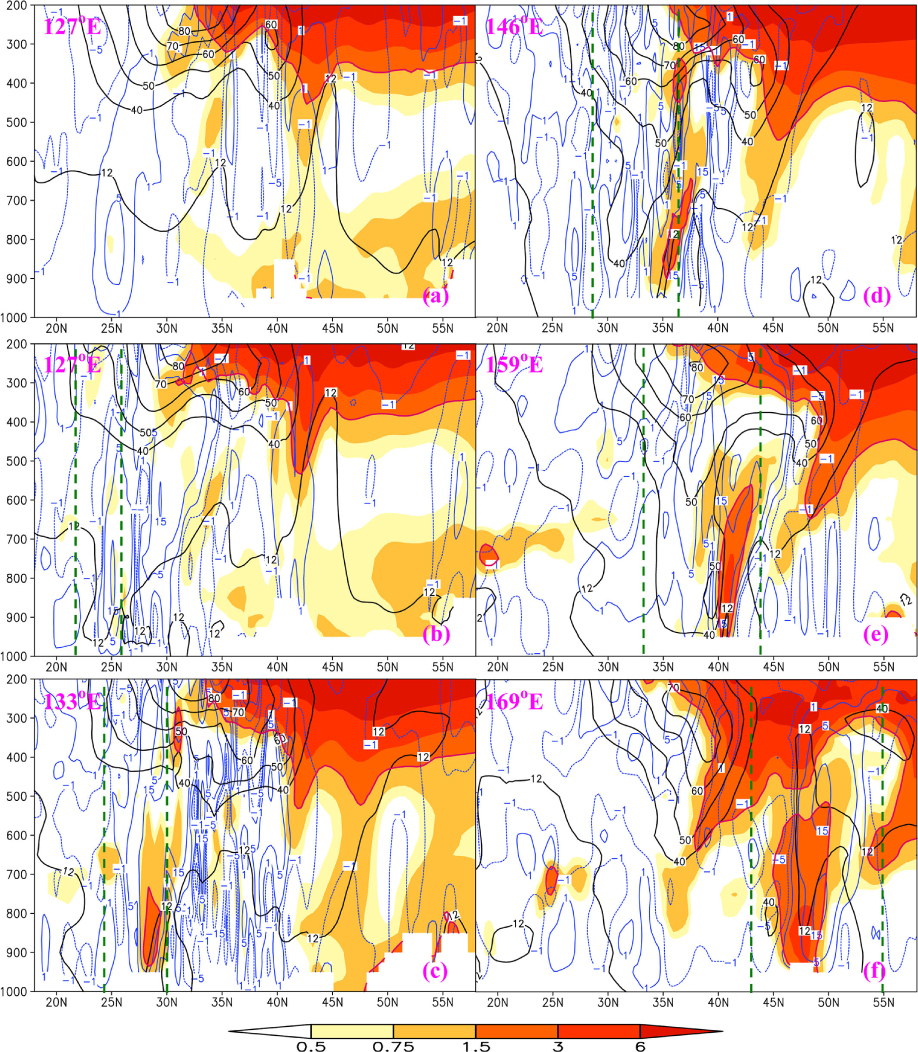
Fig. 5
Cross-sections of PV (shaded, units: PVU; the purple bold line is the 1.5-PVU contour), horizontal velocity (black solid lines, units: m s−1) and vertical velocity (blue dashed and solid lines, units: cm s−1) along central longitudes of the explosive cyclone. Green dashed lines stand for KAs of the cyclone. (a) 0000 UTC 28 December 2004; (b) 0600 UTC 28 December 2004; (c) 1800 UTC 28 December 2004; (d) 1200 UTC 29 December 2004; (e) 0000 UTC 30 December 2004; and (f) 1800 UTC 30 December 2004.
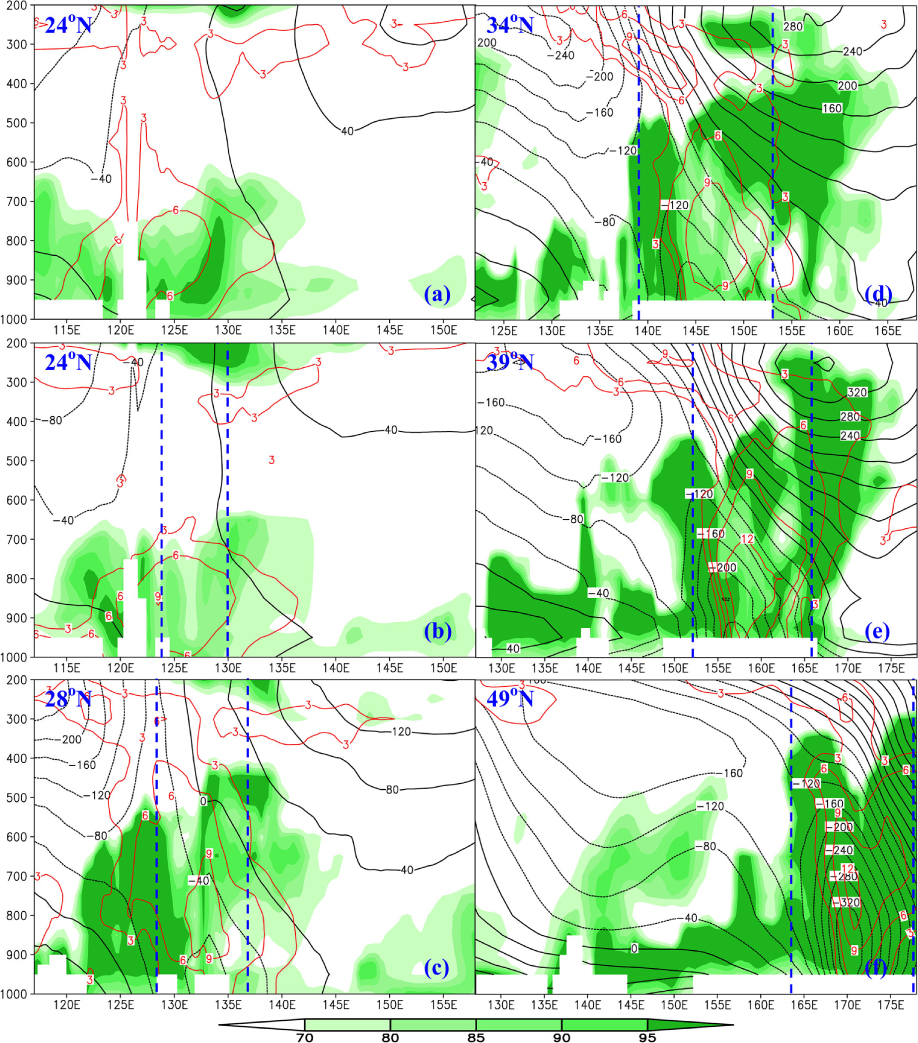
Fig. 6
Cross-sections of RH (shaded, units: %), θ anomalies (red solid lines, units: K) and geopotential height deviation (black solid and dashed lines, units: m) along central latitudes of the explosive cyclone. Blue dashed lines stand for KAs of the cyclone. (a) 0000 UTC 28 December 2004; (b) 0600 UTC 28 December 2004; (c) 1800 UTC 28 December 2004; (d) 1200 UTC 29 December 2004; (e) 0000 UTC 30 December 2004; and (f) 1800 UTC 30 December 2004.
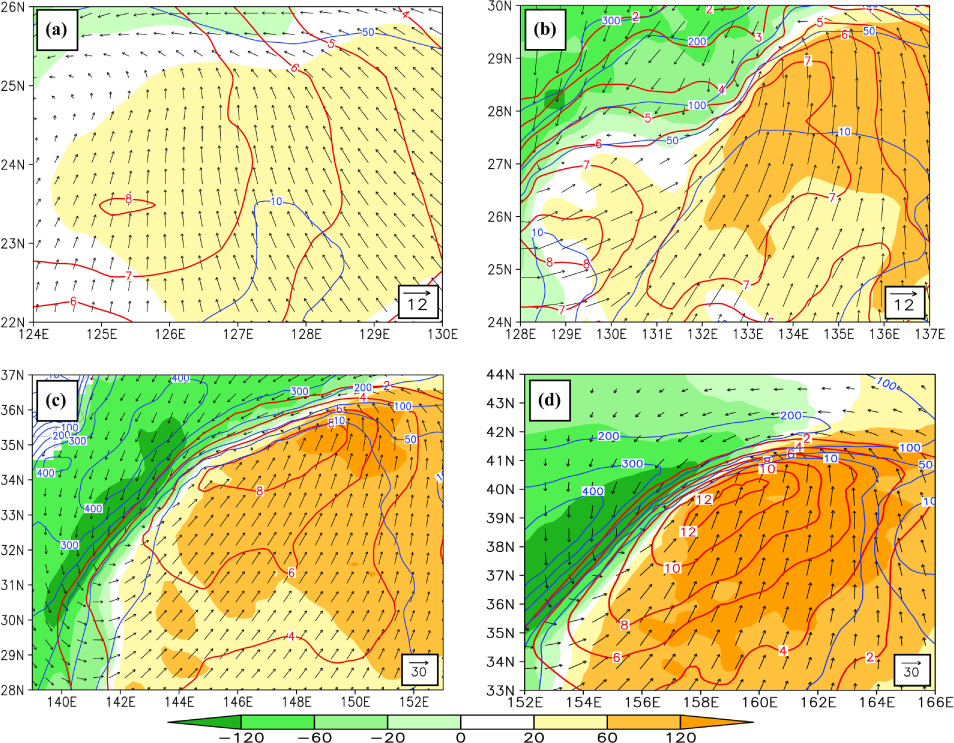
Fig. 7
Perturbation θ (red solid lines, units: K), horizontal wind field (vector, units: m s−1), θ advection (shaded, units: 10−5 K s−1) at 950 hPa and sensible heat flux (blue solid lines, units: W m−2), within KAs of the cyclone: (a) 0600 UTC 28 December 2004; (b) 1800 UTC 28 December 2004; (c) 1200 UTC 29 December 2004; and (d) 0000 UTC 30 December 2004.
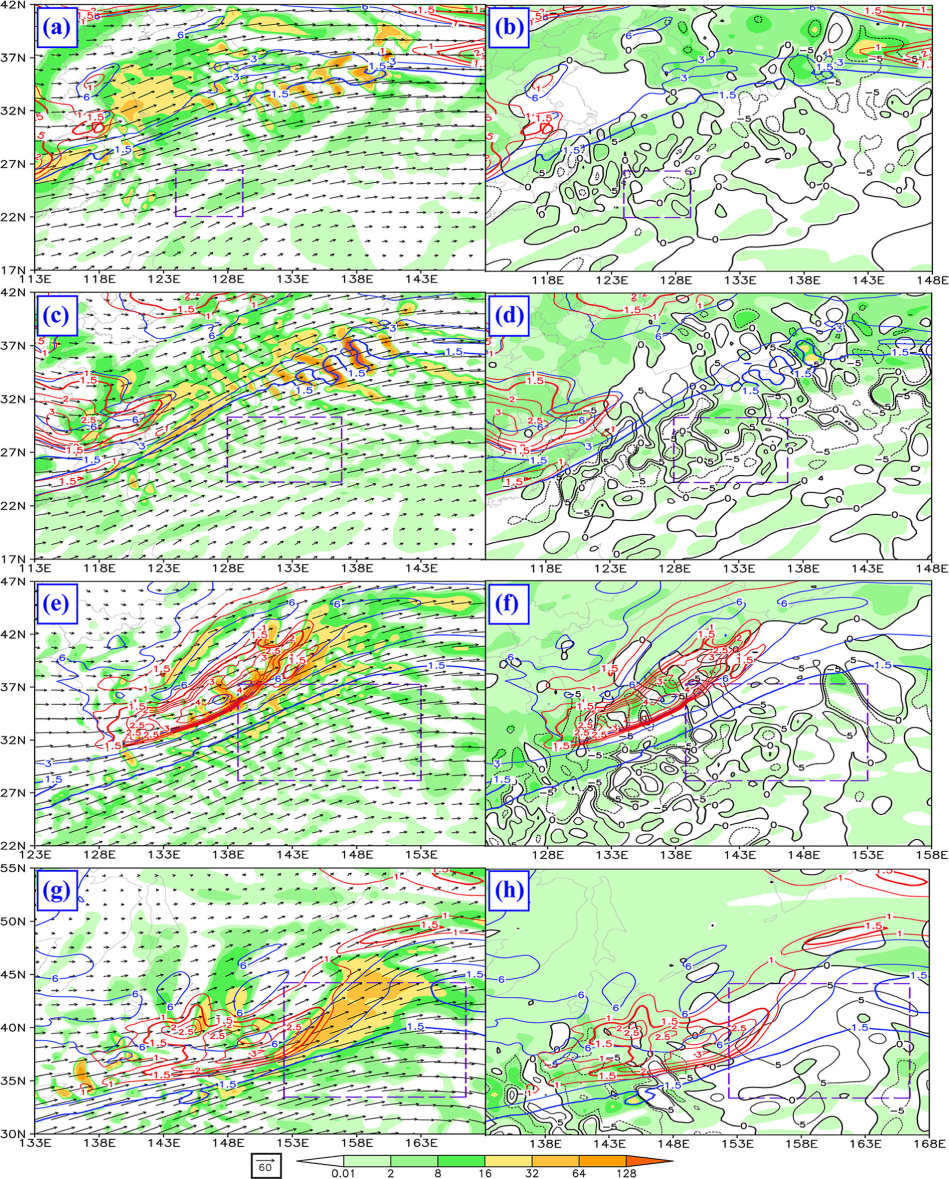
Fig. 8
Left column: horizontal PV advection (shaded, units: 10−5 PVU s−1), PV (blue solid lines, units: PVU), PV anomalies (red solid lines, units: PVU) and horizontal wind at 250 hPa (vector, units: m s−1). Right column: vertical PV advection (shaded, units: 10−5 PVU s−1), PV (blue solid lines, units: PVU), PV anomalies (red solid lines, units: PVU) and vertical velocity at 250 hPa (black solid and dashed lines, units: cm s−1). Panels (a) and (b) are for 0600 UTC 28 December 2004; (c) and (d) for 1800 UTC 28 December 2004; (e) and (f) for 1200 UTC 29 December 2004; and (g) and (h) for 0000 UTC 30 December 2004.
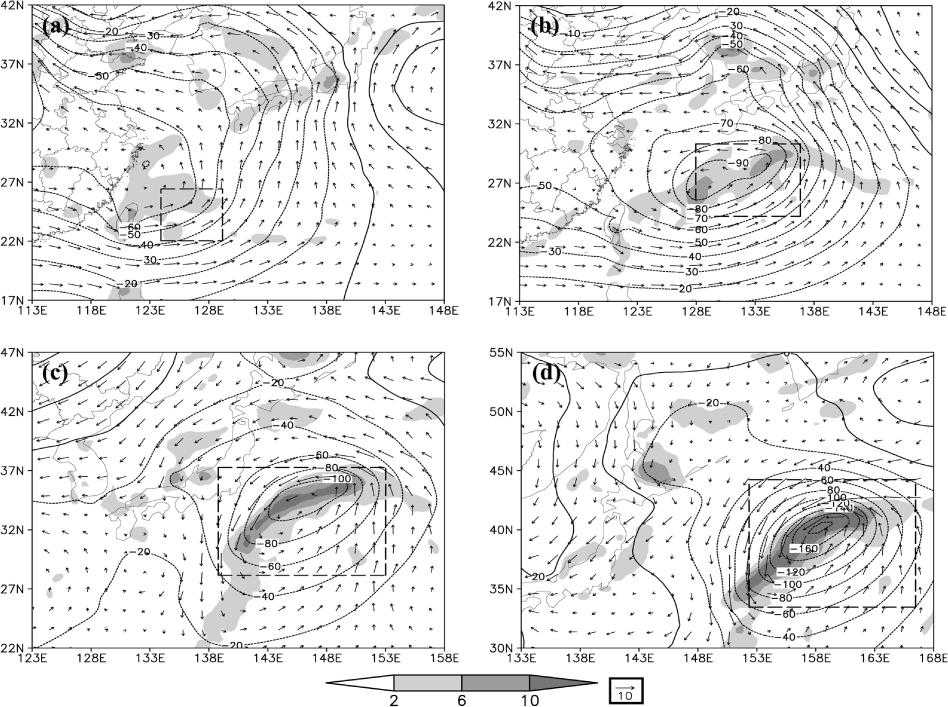
Fig. 9
Geopotential height perturbations (solid and dotted lines, units: m), horizontal wind perturbations (vector, units: m s−1) and vorticity of horizontal perturbation wind (shaded, units: 10−5 s−1) at 900 hPa associated with the ESL [part (iii)], where thick broken rectangles represent KAs of the cyclone: (a) 0600 UTC 28 December 2004; (b) 1800 UTC 28 December 2004; (c) 1200 UTC 29 December 2004; and (d) 0000 UTC 30 December 2004.
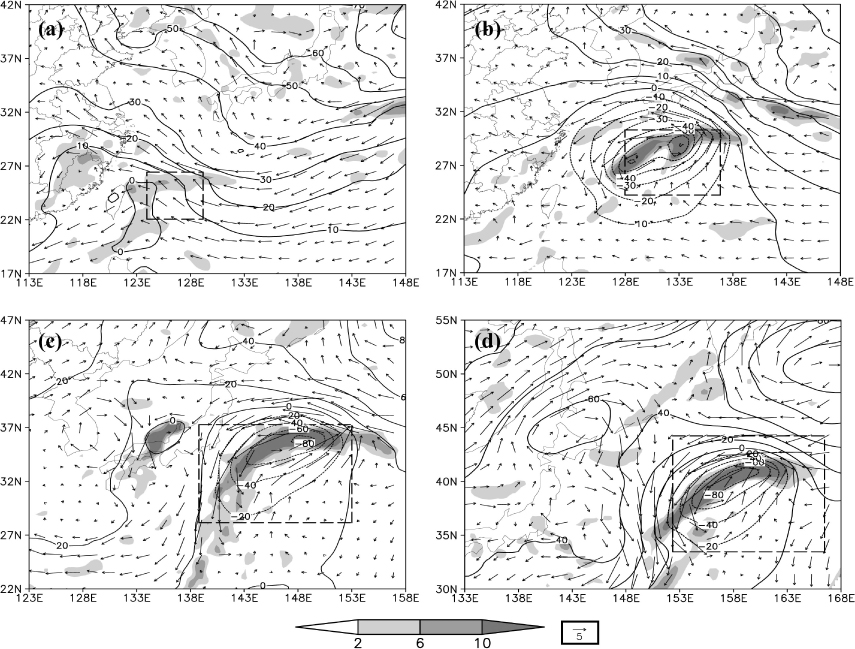
Fig. 10
Geopotential height perturbations (solid and dotted lines, units: m), horizontal wind perturbations (vector, units: m s−1) and vorticity of horizontal perturbation wind (shaded, units: 10−5 s−1) at 900 hPa associated with the IL [part (ii)], where thick broken rectangles represent KAs of the cyclone: (a) 0600 UTC 28 December 2004; (b) 1800 UTC 28 December 2004; (c) 1200 UTC 29 December 2004; and (d) 0000 UTC 30 December 2004.
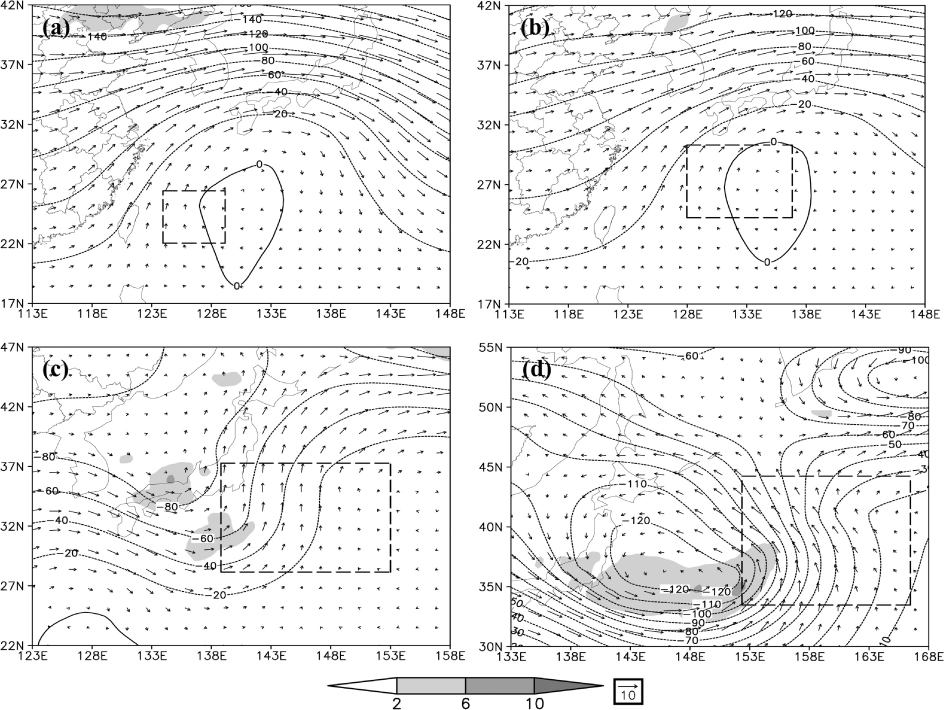
Fig. 11
Geopotential height perturbations (solid and dotted lines, units: m), horizontal wind perturbations (vector, units: m s−1) and vorticity of horizontal perturbation wind (shaded, units: 10−5 s−1) at 900 hPa associated with the UL [part (i)], where thick broken rectangles represent KAs of the cyclone: (a) 0600 UTC 28 December 2004; (b) 1800 UTC 28 December 2004; (c) 1200 UTC 29 December 2004; and (d) 0000 UTC 30 December 2004.
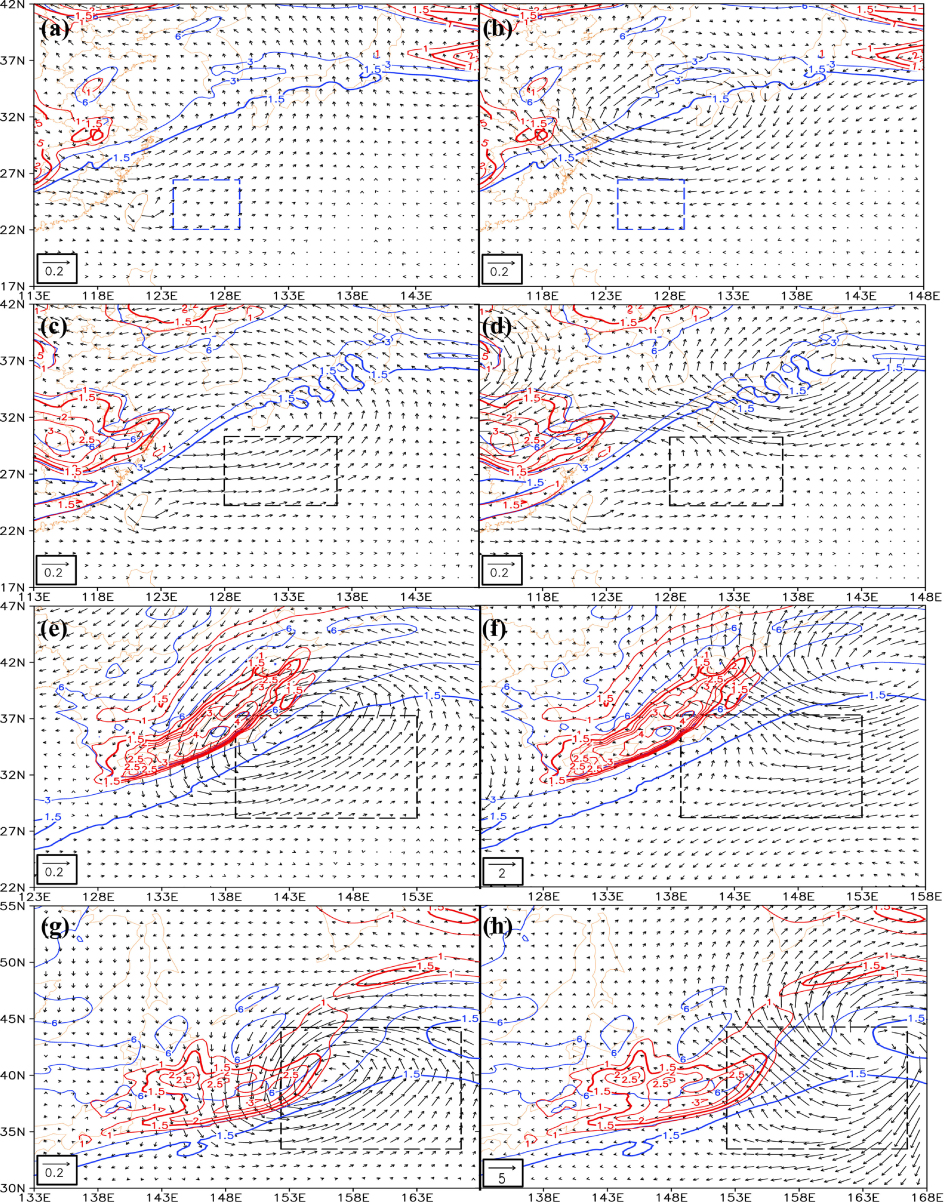
Fig. 12
Horizontal perturbation wind field at 250 hPa (vector, units: m s−1) associated with the ESL (left column) and the IL (right column), where the red solid line represents PV anomalies (units: PVU), the blue solid line is PV (units: PVU) and the rectangles represent KAs of the cyclone. Panels (a) and (b) are for 0600 UTC 28 December 2004; (c) and (d) for 1800 UTC 28 December 2004; (e) and (f) for 1200 UTC 29 December 2004; and (g) and (h) for 0000 UTC 30 December 2004.
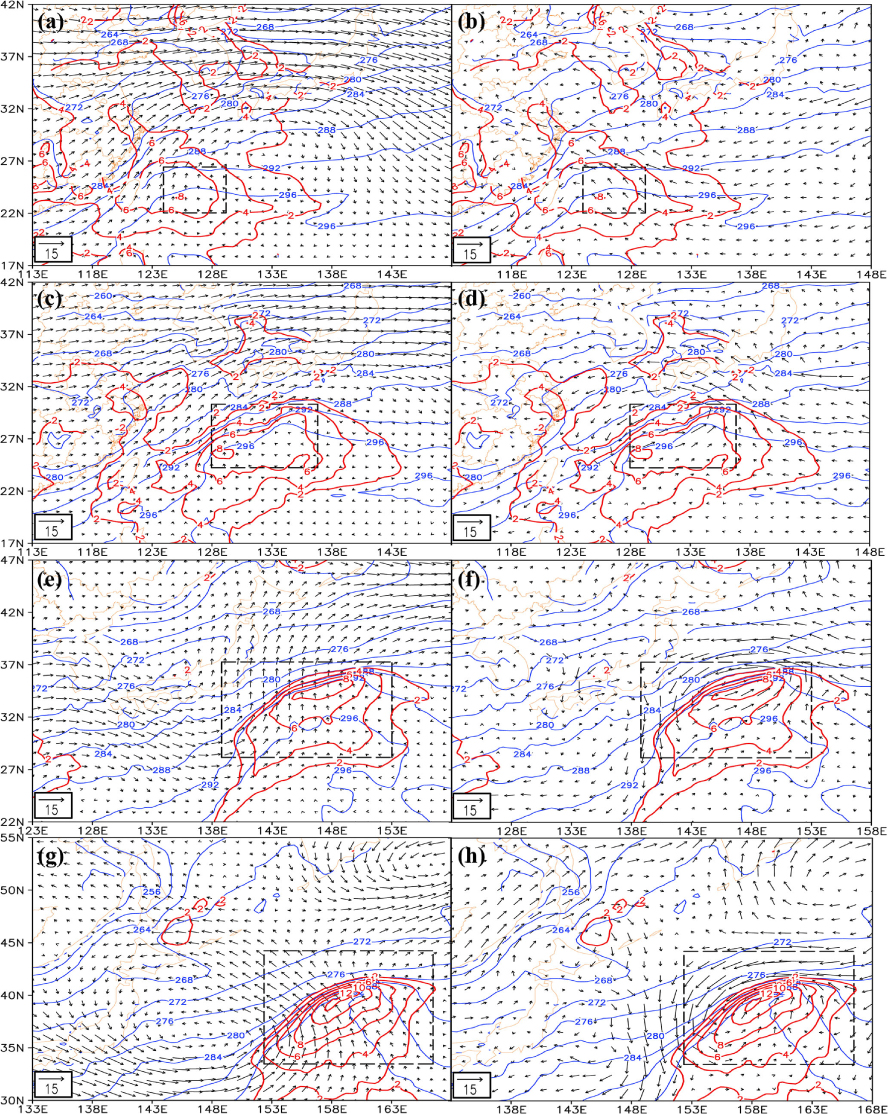
Fig. 13
Horizontal perturbation wind field at 950 hPa (vector, units: m s−1) associated with the UL (left column) and the IL (right column), where the red solid line represents θ anomalies (units: K), the blue solid line is θ (units: K) and the rectangles represent KAs of the cyclone. Panels (a) and (b) are for 0600 UTC 28 December 2004; (c) and (d) for 1800 UTC 28 December 2004; (e) and (f) for 1200 UTC 29 December 2004; and (g) and (h) for 0000 UTC 30 December 2004.
Table 1. KA-averaged zonal wind perturbations (up, units: m s−1), meridional wind perturbations (vp, units: m s−1), geopotential height perturbations (hp, units: m) and vorticity perturbations (vorp, units: 10−5 s−1) during interactions among the upper, interior and lower layers
Initial stageLatter stageInitial stageLatter stage
UL to ESLup−0.40.10.4−1.7vp2.21.53.44.8IL to ESLup−3.21.10.6−3.1vp3.62.4−0.2−1.2ESL to ILhp−27−52−55−68vorp0.31.51.41.2UL to ILhp21−29−51vorp−1.1−1.2−0.3−0.2
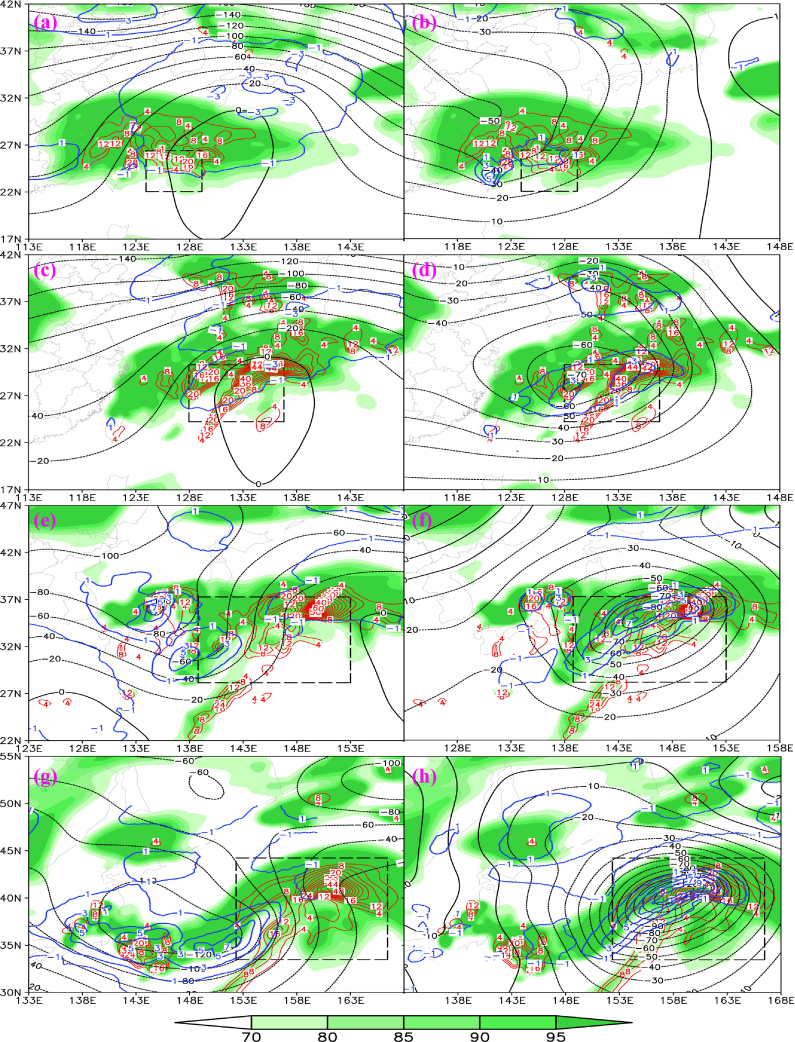
Fig. 14
Geopotential height perturbations (black solid and dashed lines, units: m) and vorticity of horizontal perturbation wind (blue solid and dashed lines, units: 10−5 s−1) at 750 hPa associated with the UL (left column) and the ESL (right column), where the shaded areas represent RH (units: %), the red solid line is vertical velocity (units: cm s−1) and the rectangles represent KAs of the cyclone. Panels (a) and (b) are for 0600 UTC 28 December 2004; (c) and (d) for 1800 UTC 28 December 2004; (e) and (f) for 1200 UTC 29 December 2004; and (g) and (h) for 0000 UTC 30 December 2004.
Table 2. Percentage of the decrease of 900-hPa geopotential height associated with the UL [part (i)], IL [part (ii)] and ESL [part (iii)], where the values with and without parentheses are calculated by KA-averaged and minimum geopotential height perturbations within the KA respectively, and the descriptions following the values are derived from the calculation results according to the above two methods
Layers0600 UTC 28 December 20041800 UTC 28 December 20041200 UTC 29 December 20040000 UTC 30 December 2004
UL11.4% (4.4%)
Second8.3% (0.9%)
Minimum25.0% (21.6%)
Minimum28.8% (32.1%)
SecondIL2.9% (−13.5%)
Minimum36.1% (30.6%)
Second32.7% (22.9%)
Second23.7% (10.4%)
MinimumESL85.7% (109.1%)
Dominant55.6% (68.5%)
Dominant42.3% (55.5%)
Dominant47.5% (57.5%)
Dominant