
Table 1. Model configurations
std w ocean48yesyesminimal w ocean48noyesstd w/o ocean48yesnominimal w/o ocean48nonoslow w/o ocean10nonoslow w ocean20noyes
Table 2. Control vectors
P1010 process parameters10––I2scalar pert. for p s , T2–0I4scalar pert. for p s , T2scalar pert. for S, T2I3Dspatially explicit: ζ, D, p s , T63 488spatially explicit: S, T61 942
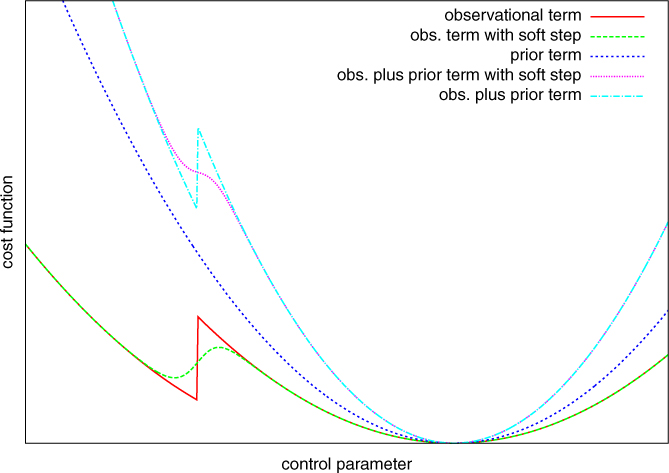
Fig. 1
Schematic illustration of a cost function that includes a step function, including the effects of smoothing and prior (background) term.
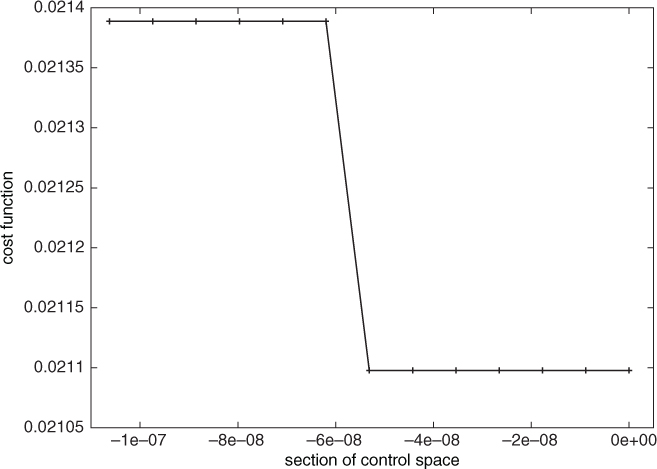
Fig. 2
Cost function over a section of control space at the stopping point of one of the unsuccessful members of Exp. 1. Except for the x-value of the jump, the curve has a very small positive derivative (about 0.041 left, and 0.033 right of the jump), that is, an ascending slope. The units of the x-axis are relative to the stopping point.

Fig. 3
Convergence of the minimisation for control vector P10, configuration ‘slow w/o ocean’, assimilation of pseudo observations, and a 56-d assimilation window (Exp. 4): Cost function (solid red, ‘+’), norm of its gradient (green dashed, ‘×’), and absolute difference of components of control vector to true value over iteration number (par 1–10, see legend).
Table 3. Experiments. Column 1 indicates the experiment number, column 2 the configuration from the list in Table 1, column 3 the control vector from the list in Table 2, column 4 the level of smoothing applied to the atmospheric component (see Section 2.1), column 5 the observational data set (see Section 2.3), column 6 the length of the assimilation window, column 7 the number of successful members out of our four member ensemble
1std w oceanP10softID-twin112std w/o oceanP10softID-twin103min w oceanP10softID-twin124slow w/o oceanP10softID-twin5645slow w/o oceanP10softERA-40146std w oceanI4softID-twin147std w oceanI4hardID-twin138std w oceanI4softID-twin309std w/o oceanI2softID-twin3010min w oceanI4softID-twin26311min w oceanI4hardID-twin26312slow w oceanI4softID-twin26013std w oceanI3DhardID-twin1314min w oceanI3DhardID-twin1415min w oceanI3DhardID-twin26316std w oceanI3DhardID-twin26017min w oceanI3DsoftID-twin263
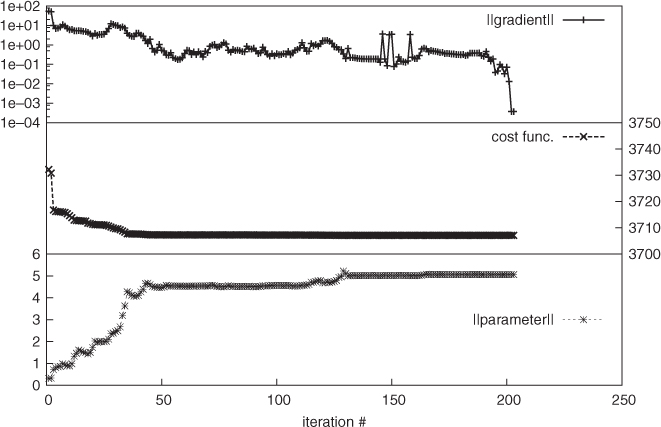
Fig. 4
Convergence of the minimisation for control vector P10, configuration ‘slow w/o ocean’, assimilation of ERA observations, and a 1-d assimilation window (Exp. 5): Norm of its gradient (top), cost function (centre), and absolute difference of the components of the control vector to the default value (labelled ‘true’ value in ID-twin experiments, bottom) over iteration number.
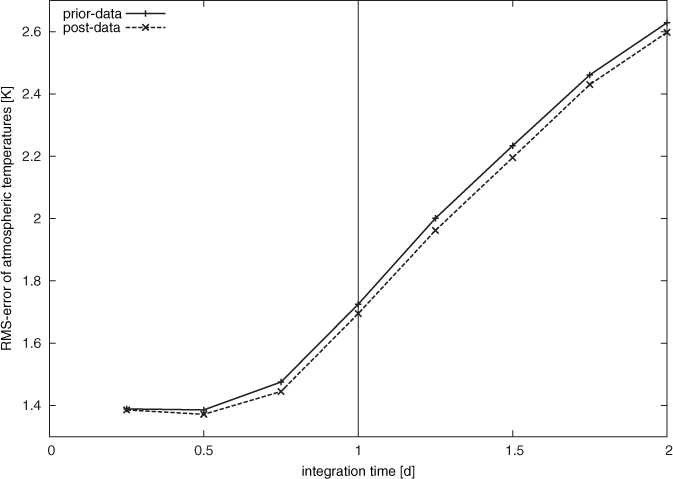
Fig. 5
RMS of temperature difference during and after assimilation window for Exp. 5.
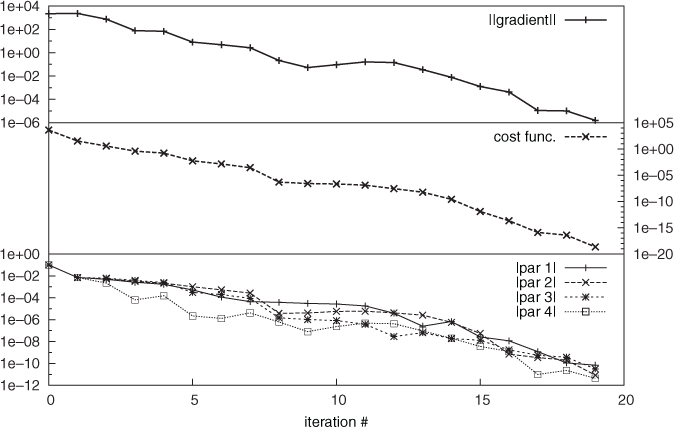
Fig. 6
As Fig. 4 but for convergence of the minimisation for control vector I4, configuration ‘min w ocean’, assimilation of pseudo observations, and a 26-d assimilation window (Exp. 11).
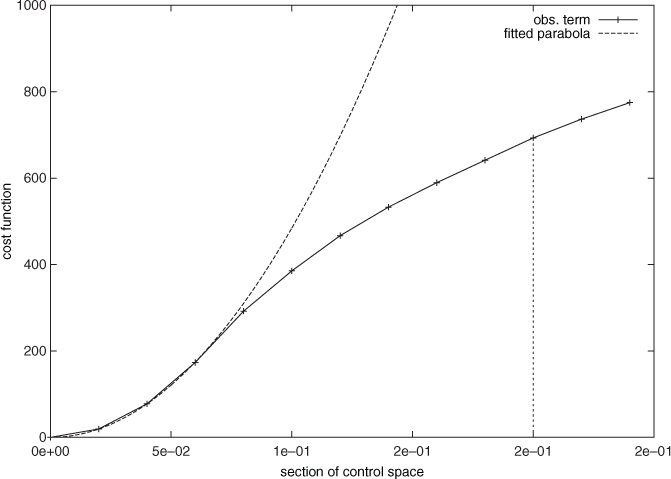
Fig. 7
Cost function over a section of control space from the true value (origin) to the first guess (marked with vertical line) of the first of four (unsuccessful) members of Exp. 12 (control vector I4, ‘slow w ocean’; solid line, ‘+’) and a parabola fitted at the known minimum (dashed line; second deriv. is about 100 000).
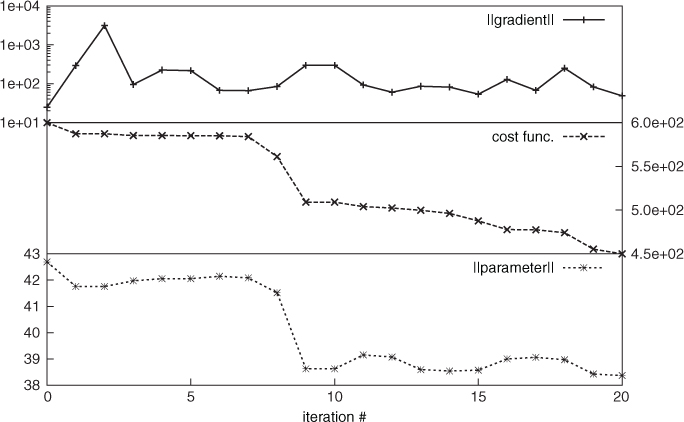
Fig. 8
As Fig. 4 but for convergence of the minimisation for control vector I3D, configuration ‘min w ocean’, assimilation of pseudo observations, and a 26-d assimilation window (Exp. 15).