
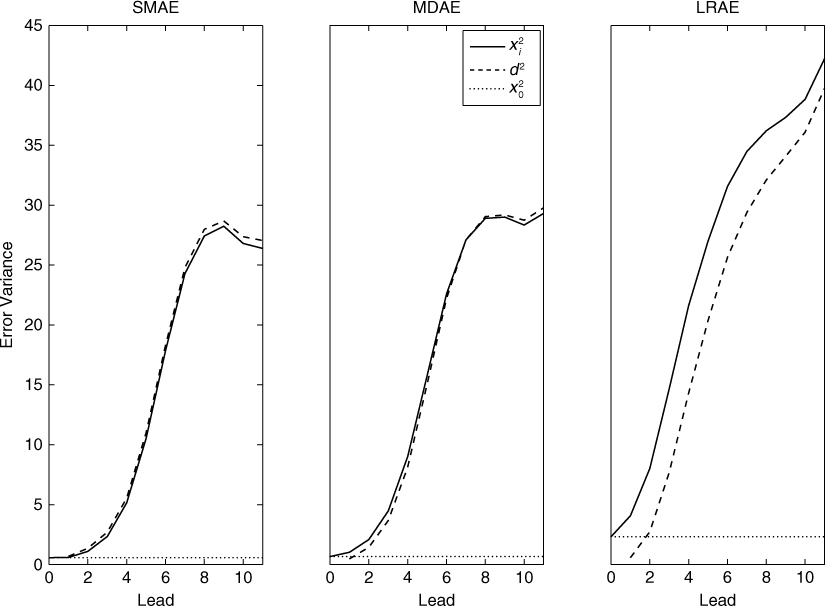
Fig. 1
Sample mean of true (solid line) and perceived (dashed line) forecast error variances, denoted respectively by x i 2 and by d i 2 as a function of lead time for the three experiments. The analysis error, denoted by x 0 2, is added (dotted line) as a reference. The sample includes 104 cases.
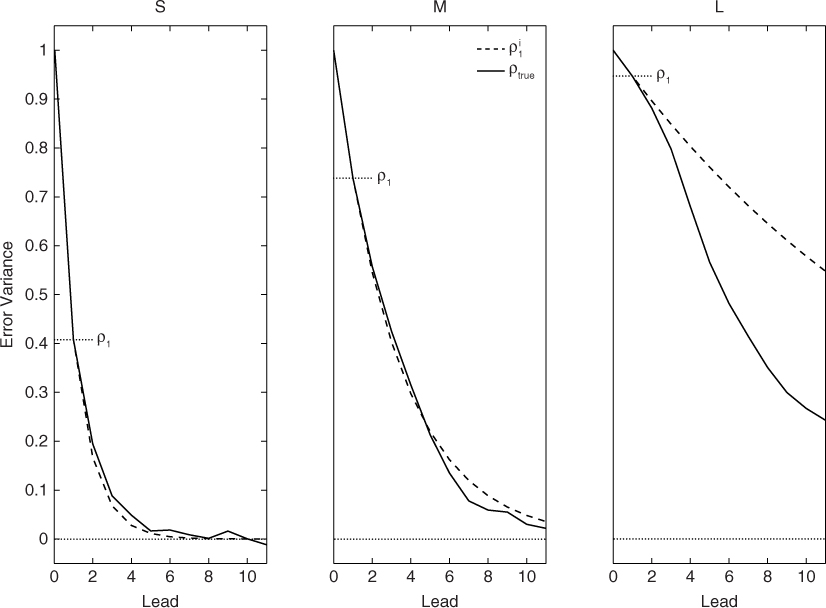
Fig. 2
Time correlation between analysis errors and forecast errors, ρ, as a function of lead time in the true system (continuous line) and in the empirical relationship [eq. (7); dashed line]. The correlation between the analysis errors and the first guess errors, ρ 1, is marked for each experiment.
Table 1. Parameters prescribed to the data assimilation experiments and resulting sample error variances from a time series of 104 cycles.
Experimentσo2ζx12xo2
S20.50.590.57M40.31.030.67L90.34.092.33
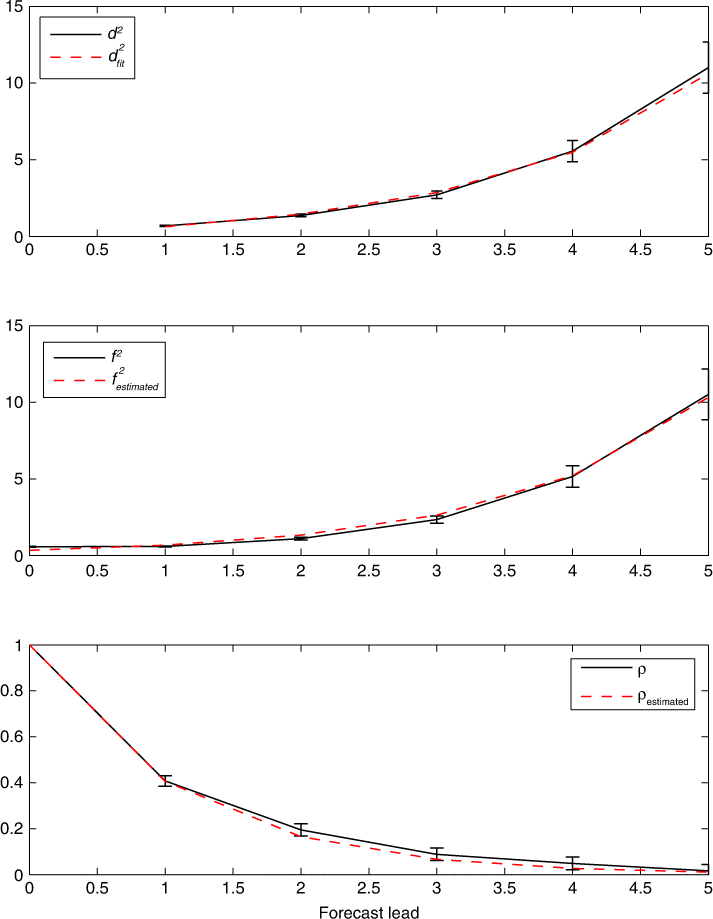
Fig. 3
Error variances and error correlation as a function of lead time for the S experiment using five lead points. Observed perceived error variance (d) and modelled perceived error variance (d fit) (upper panel), forecast error variance (f 2) and estimated forecast error variance (f 2 estimated) (middle panel), true and estimated correlation (lower panel). Error bars in the upper panel are the SEM; for the other panels are the ranges of parameters such that ∣d 2 –d 2 fit∣ < SEM.

Fig. 4
Same as Fig. 3 but for the L experiment.
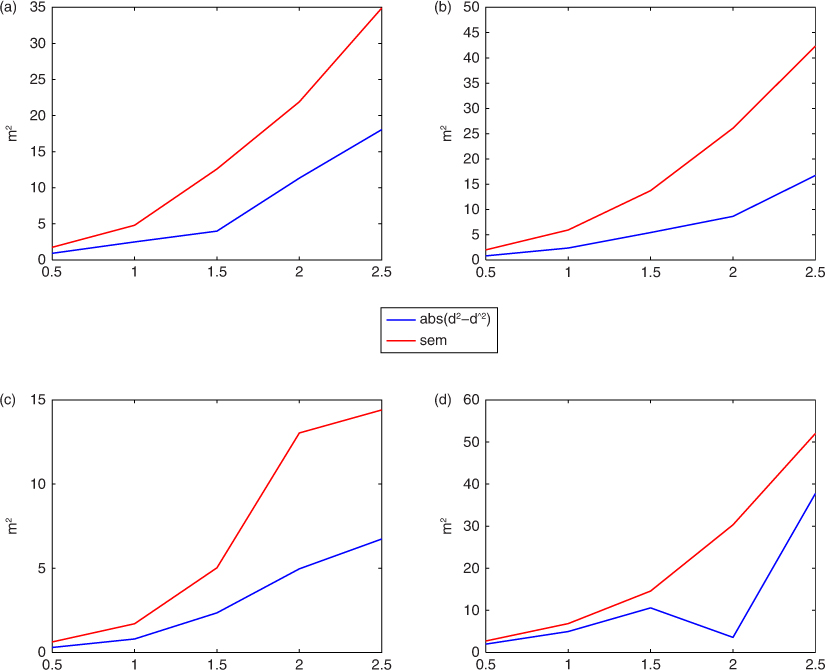
Fig. 5
Absolute value of difference between the observed perceived error variance and modelled perceived error variance, and the standard error of the mean (SEM) for (a) NCEP, (b) CMC, (c) ECMWF and (d) FNMOC. Abscissa axis corresponds to forecast lead time in units of days.
Table 2. Parameters estimated for the NH 500 hPa inter-comparison of NWP systems: analysis error variance (), error growth (α), error doubling times (EDT), correlation between the analysis and first-guess errors (ρ 1) and corresponding explained error variance (EEV).
NCEP38.00.252.70.5631CMC29.50.272.60.4722ECMWF11.50.302.30.225FNMOC49.20.262.80.6036
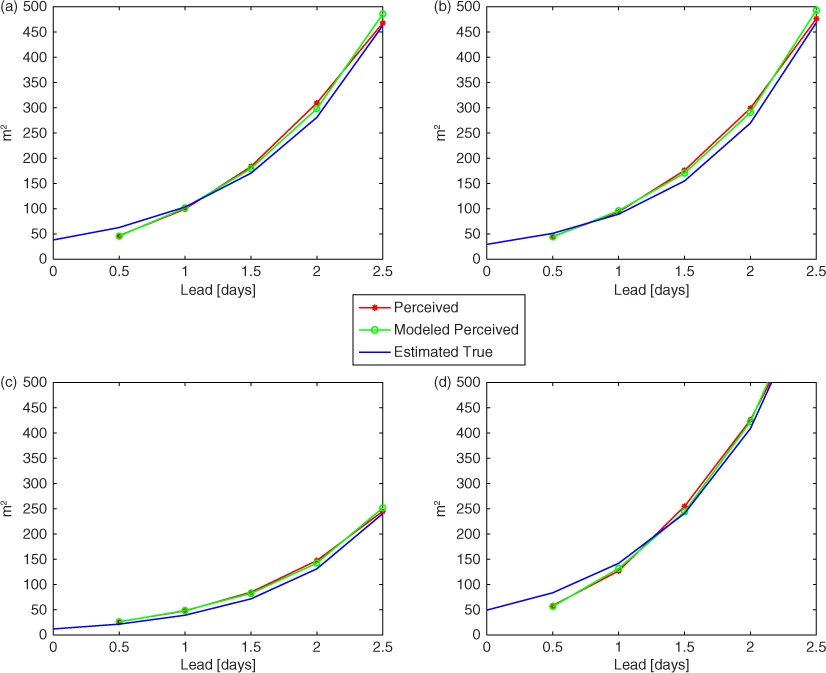
Fig. 6
Forecast (observed perceived, fitted perceives and true) error variances as a function of lead time for four global models: (a) NCEP, (b) CMC, (c) ECMWF and (d) FNMOC for models operational in 2008.

Fig. 7
Resulting correlation of forecast errors and verifying analysis errors for (a) NCEP, (b) CMC, (c) ECMWF, (d) FNMOC.
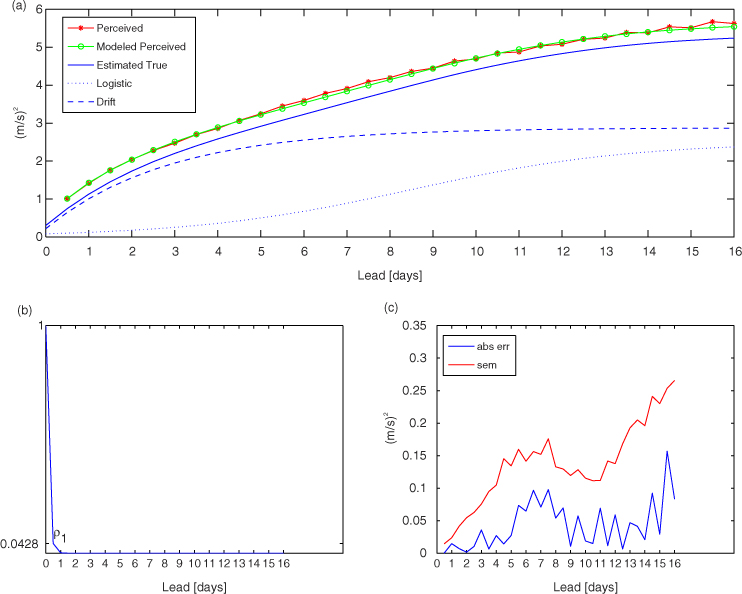
Fig. 8
(a) Seven-parameter model function applied to TR 10 mU wind forecasts from the NCEP model; (b) resulting analysis-forecast correlation; and (c) misfit compared to SEM (as in Fig. 5).