
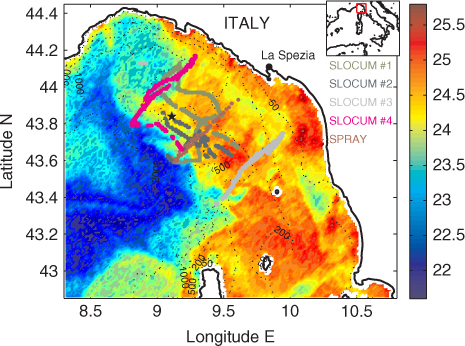
Fig. 1
Ligurian Sea surface temperature (°C) on 21 August 08:34 (from AVHRR satellite) and trajectories of the five assimilated gliders between 21 and 31 August. The position of the ODAS mooring (43.84°N 9.11°E) is indicated by the black star.
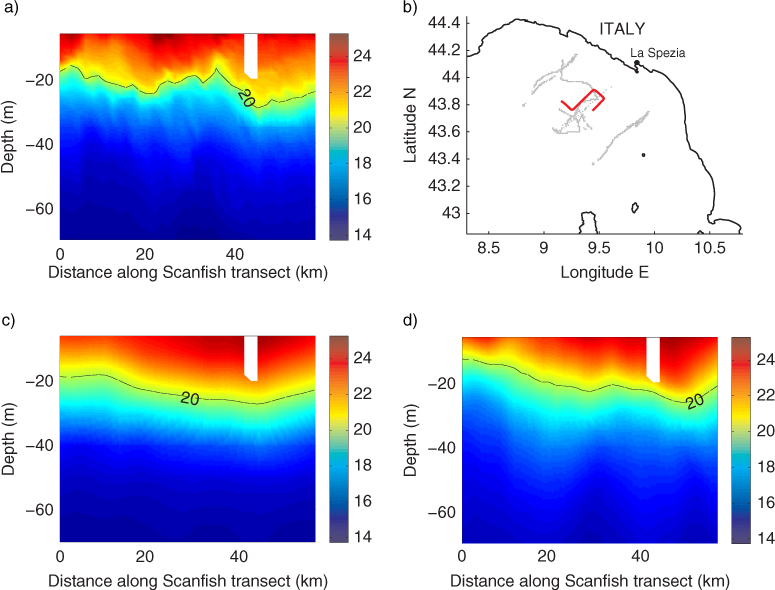
Fig. 2
Temperature section (°C) along the NRV Alliance ship route from 26 August 23:00 to 27 August 05:00: a) observed by the Scanfish; predicted on 26 August 00:00 by c) the 3DSE; d) the EnKF. b) In red: ship trajectory for this period (the transect starts from its westernmost position), and in grey: glider observations assimilated prior to 26 August.
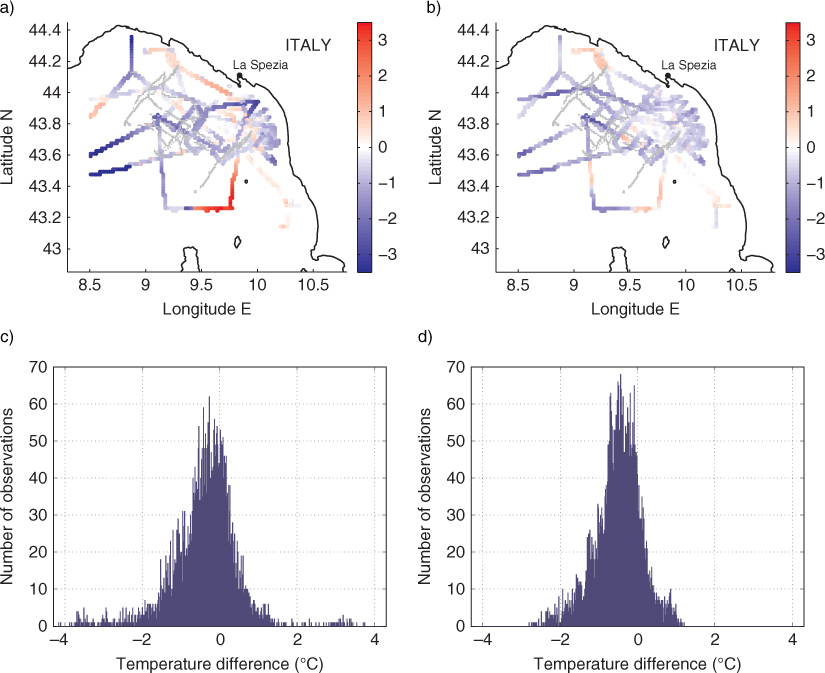
Fig. 3
Top panels: maps of temperature differences (°C) between models and the ship surface CTD observations from 21 August to 3 September: a) 3DSE; b) EnKF. For each sampled location, the maximum value of the differences over the three available simulation dates is shown. In light grey: position of the assimilated observations over the whole experiment. Bottom panels: corresponding histograms for c) 3DSE and d) EnKF.
Table 1. Summary table of the statistical measures of model-observation differences
MetricSimulationShip surface CTD temperatureSubsurface CTDs
TemperatureSalinity
RMSD3DSE0.93°C1.83°C0.84EnKF0.79°C1.36°C0.14bias3DSE−0.38°C−0.45°C−0.04EnKF−0.51°C−0.43°C0.08RMSD′3DSE0.84°C1.77°C0.84EnKF0.60°C1.28°C0.12SDD3DSE0.26°C−0.30°C0.68EnKF0.26°C−0.44 °C−0.03CC3DSE0.520.920.10EnKF0.780.960.68
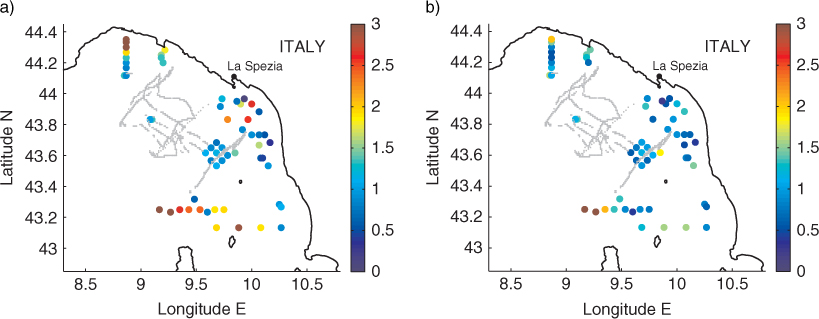
Fig. 4
Temperature RMSD (°C) at CTD sites: a) 3DSE; b) EnKF. For each sampled location, the average RMSD over the three available simulation dates is shown.
Table 2. Properties of the temperature RMSD values over all the CTD stations
3DSE1.780.075.5812EnKF1.250.253.614
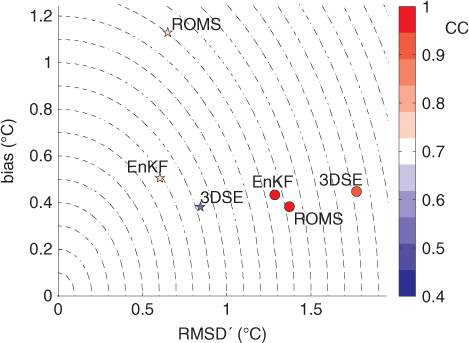
Fig. 5
Summary diagram illustrating the absolute value of the bias, the unbiased RMSD and the correlation coefficient associated with the temperature model-observation differences for the 3DSE, EnKF and control ROMS simulation. The dashed lines are isocontours of the total RMSD. The stars represent the surface model performance evaluated using the NRV Alliance surface CTD data, while the circles illustrate the subsurface performance computed from the entire set of CTD profile observations.
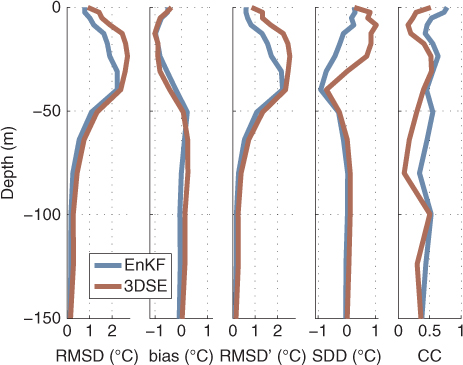
Fig. 6
Vertical variability of the statistical measures of the temperature model-observation differences over all CTD profiles.
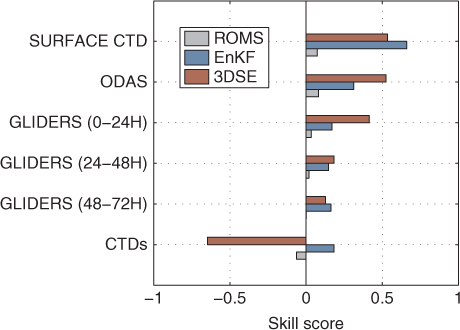
Fig. 7
Skill scores of the 3DSE, EnKF and control simulation for different validation observation sources.
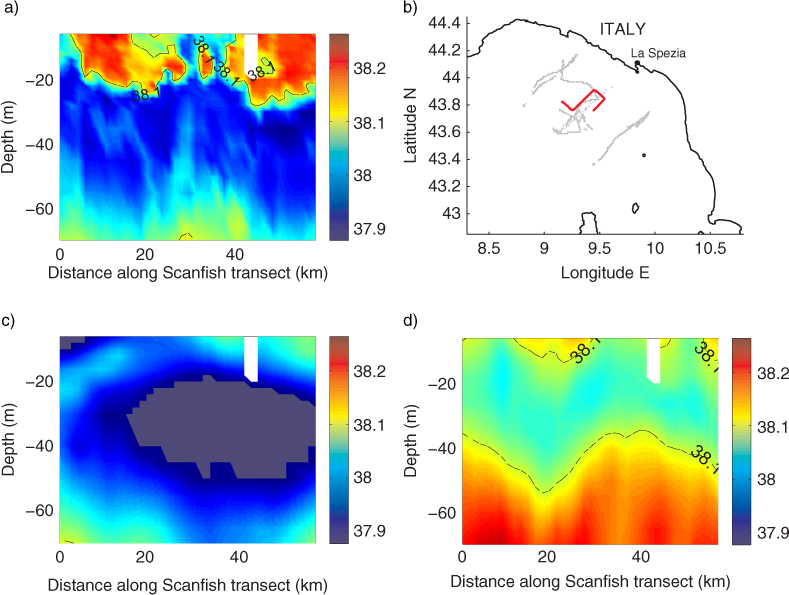
Fig. 8
Salinity section along the Scanfish transect: a) observations; c) 3DSE; d) EnKF.

Fig. 9
Salinity RMSD at CTD sites: a) 3DSE; b) EnKF.