
Table 1. Participating one-dimensional lake models and numerical model settings used in this study for Kamembe meteorology runs on a 60 and 240 m depth grid
Hostetler601606.1 sSimStrat60/24011020.5 sLAKEoneD60/2401552.5 sLAKE40/401.5/620226.0 sFLake2/601.7 sMINLAKE201265/801/5608.3 sCLM4-LISSS25Irregular30150.0 s
[i] Note that MINLAKE2012 includes fine layer spacing in the first 1 m to facilitate the ice formation prediction. *All CPU times were measured on an Intel Core i5 processor (2.27 GHz), except for CLM4-LISSS (2.1 GHz AMD Magny-Cours processor), a model tailored for a supercomputing environment and therefore not easily portable to a single-processor machine.
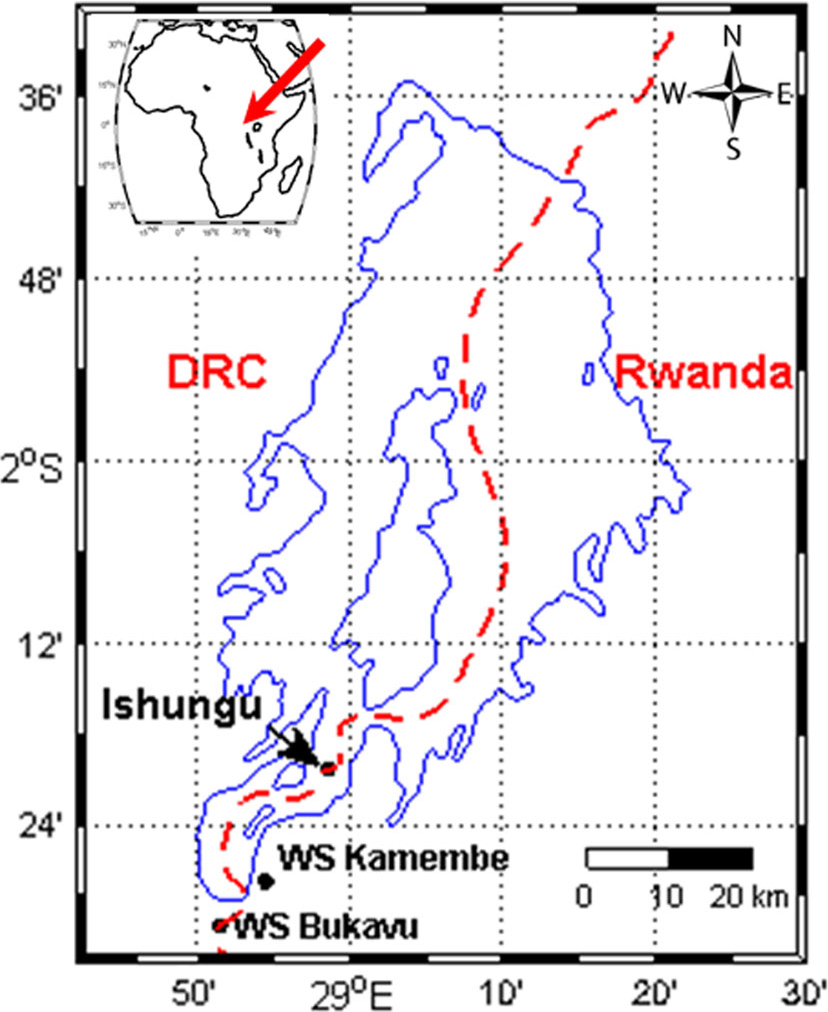
Fig. 1
Lake Kivu with situation of the Ishungu evaluation site and the Kamembe Weather Station (WS Kamembe) and Automatic Weather Station Bukavu (WS Bukavu).
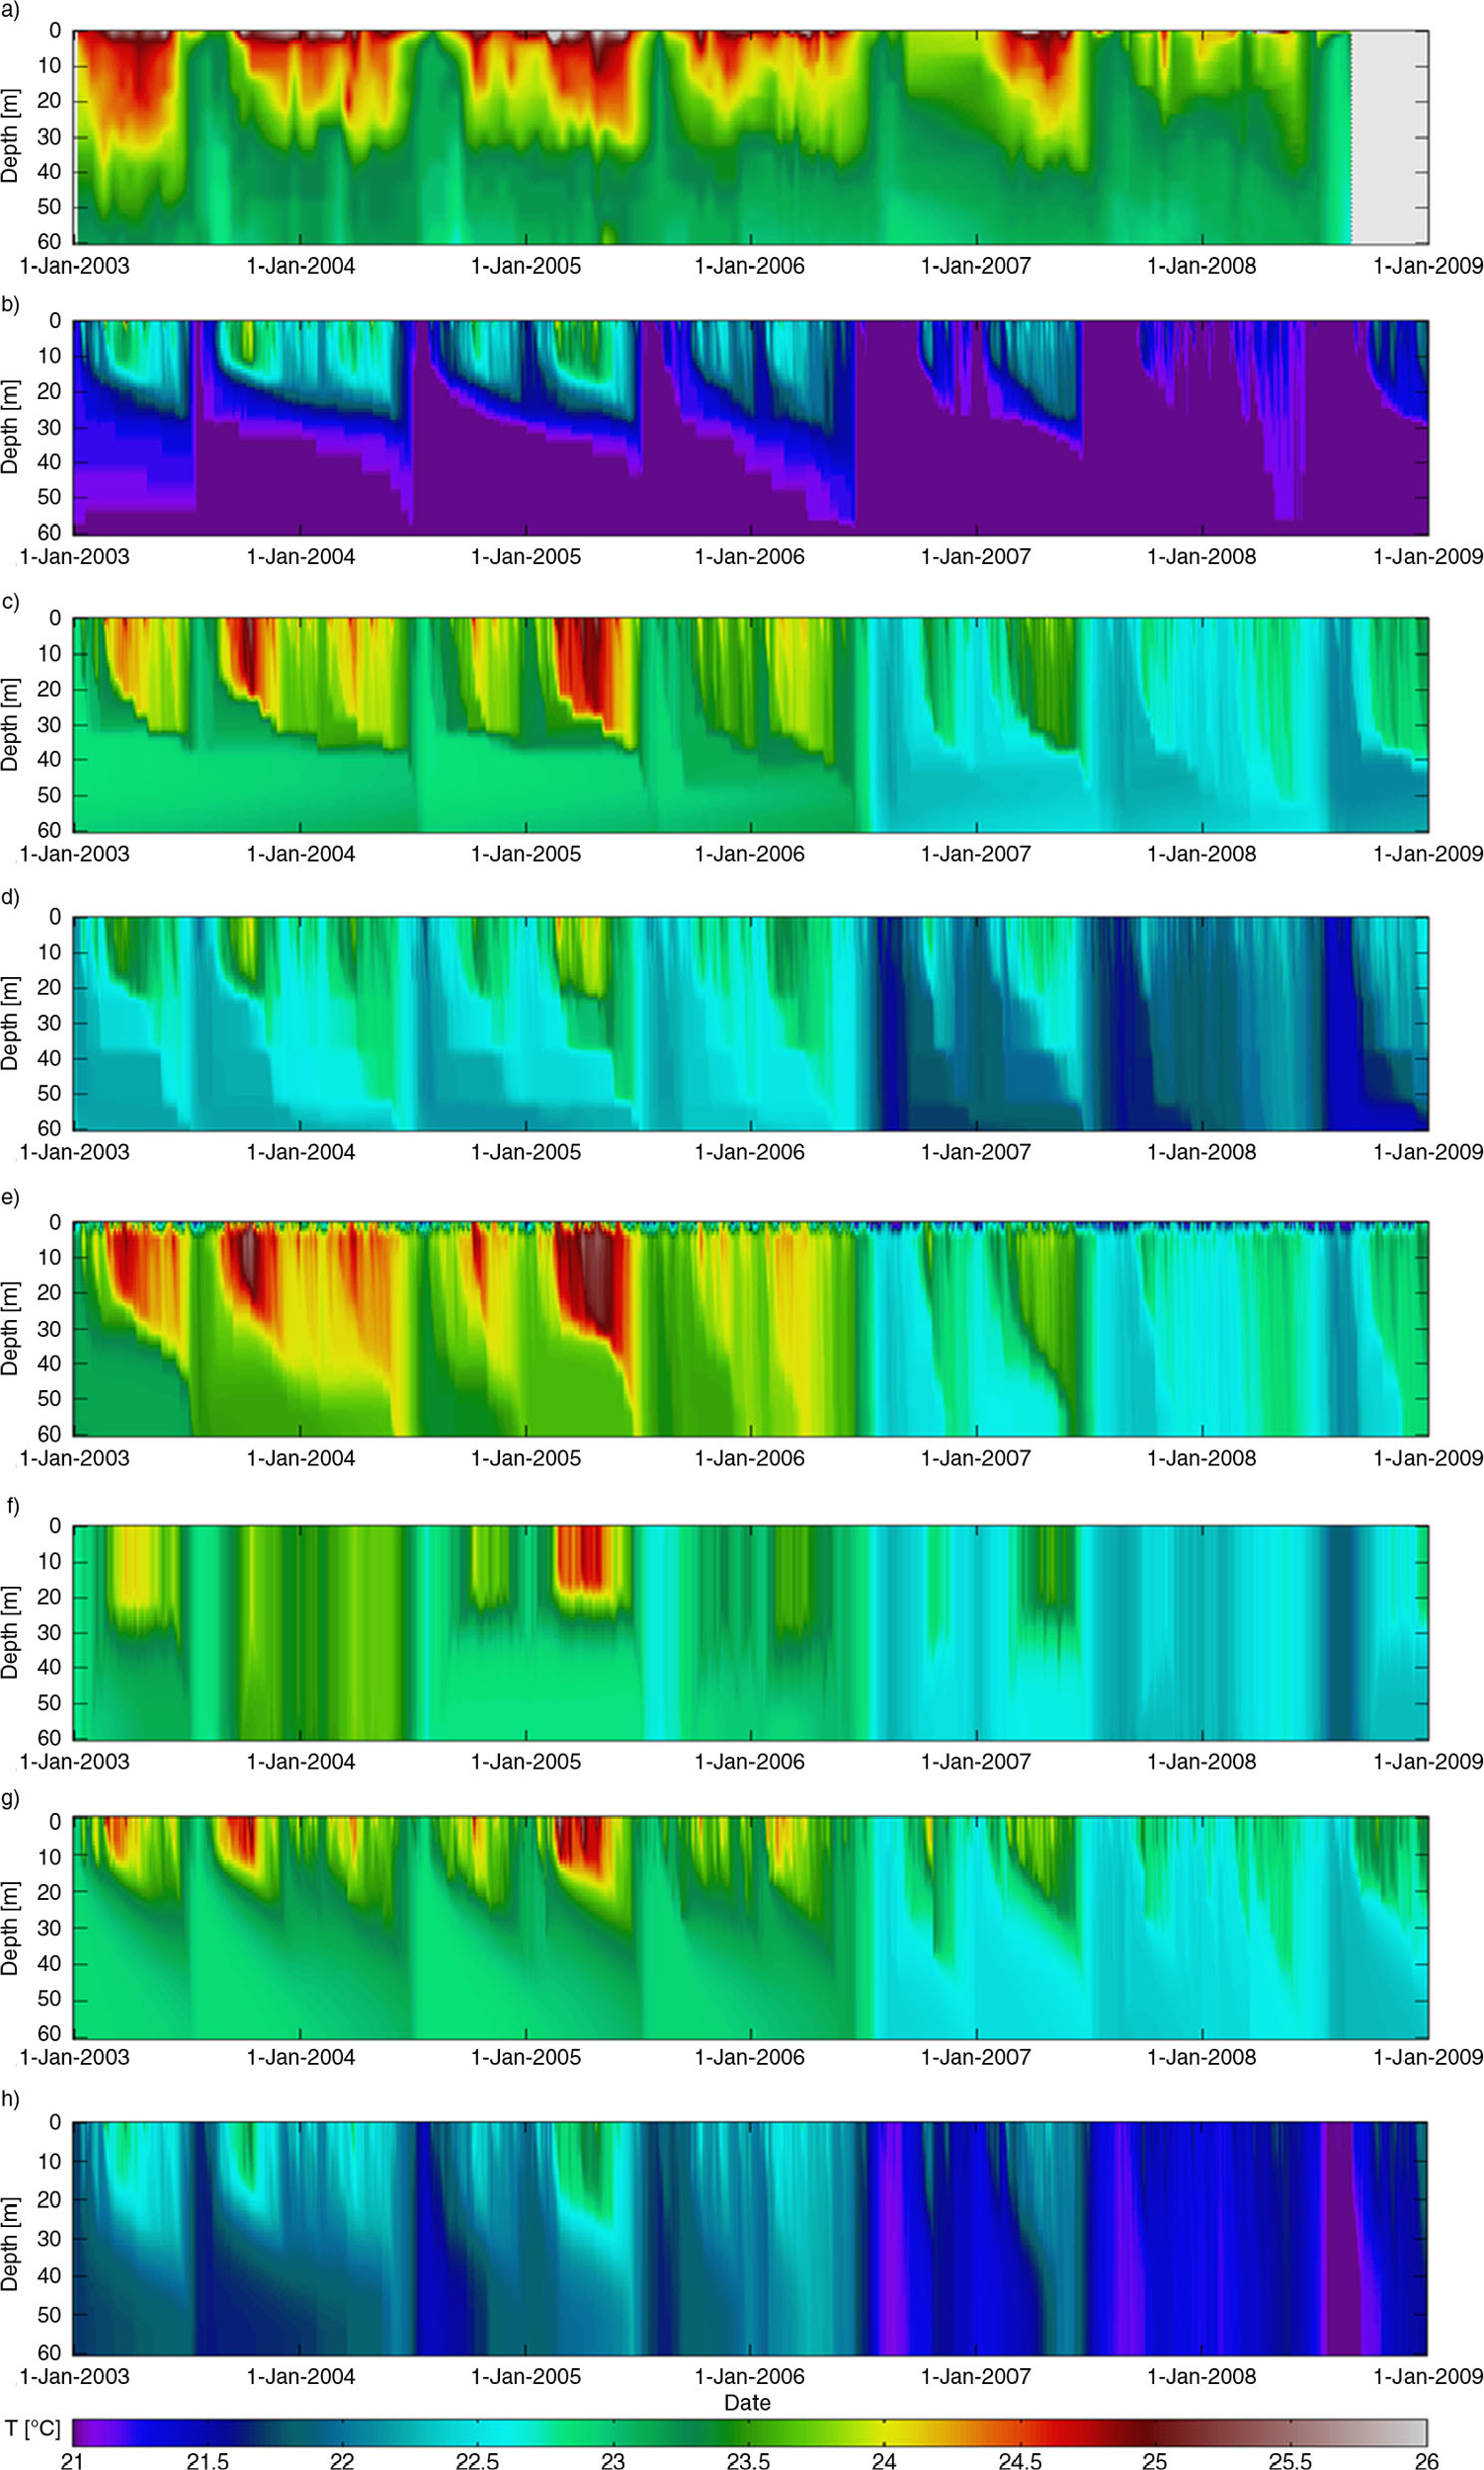
Fig. 2
Lake water temperatures (°C) at Ishungu (Lake Kivu), 2003–2008: (a) from observations, and as predicted by the models: (b) Hostetler, (c) LAKEoneD, (d) SimStrat, (e), LAKE, (f) FLake, (g) MINLAKE2012, (h) CLM4-LISSS.
Table 2. Average meteorological conditions at Kamembe Weather Station (WS Kamembe) during the model integration period excluding spin-up (2003–2008)
T19.6°C3 h3WS KamembeRH77%3 h4WS Kamembep842 hPa3 h25WS Kamembeu2.7 m s −11 h, 6–18 UTC47WS KamembeWD114°1 h, 6–18 UTC47WS KamembeP3.8 mm d −124 h, accumulated2WS KamembeSW in 193 W m −26 h, accumulated0ERA-InterimLW in 361 W m −26 h, accumulated0ERA-Interim
Table 3. Net radiation R net (W m −2) calculation used in this study by the different one-dimensional lake models to close the hourly lake energy balance
HostetlerLAKEoneDSimStratLAKEFlakeMINLAKE2012CLM4-LISSS
[i] The terms are: shortwave (longwave) albedo α SW (α LW ), incoming shortwave (longwave) radiation SW in (LW in ), outgoing longwave radiation LW out , SW in fractioning coefficient β=0.35 (35% to near-infrared, 65% to visible/ultraviolet radiation). Formulations are valid for each 1 h output time step (except LAKEoneD where this is for the last time step of each hour), with Δ denoting the change between the previous and current time step. Note that CLM4-LISSS does not account for SW in when the computed zenith angle is at or below the horizon.

Fig. 3
Modelled and observed temperature evolution at Ishungu (Lake Kivu), 2003–2008, at (a) 5 m, (b) 30 m, and (c) 60 m depth.
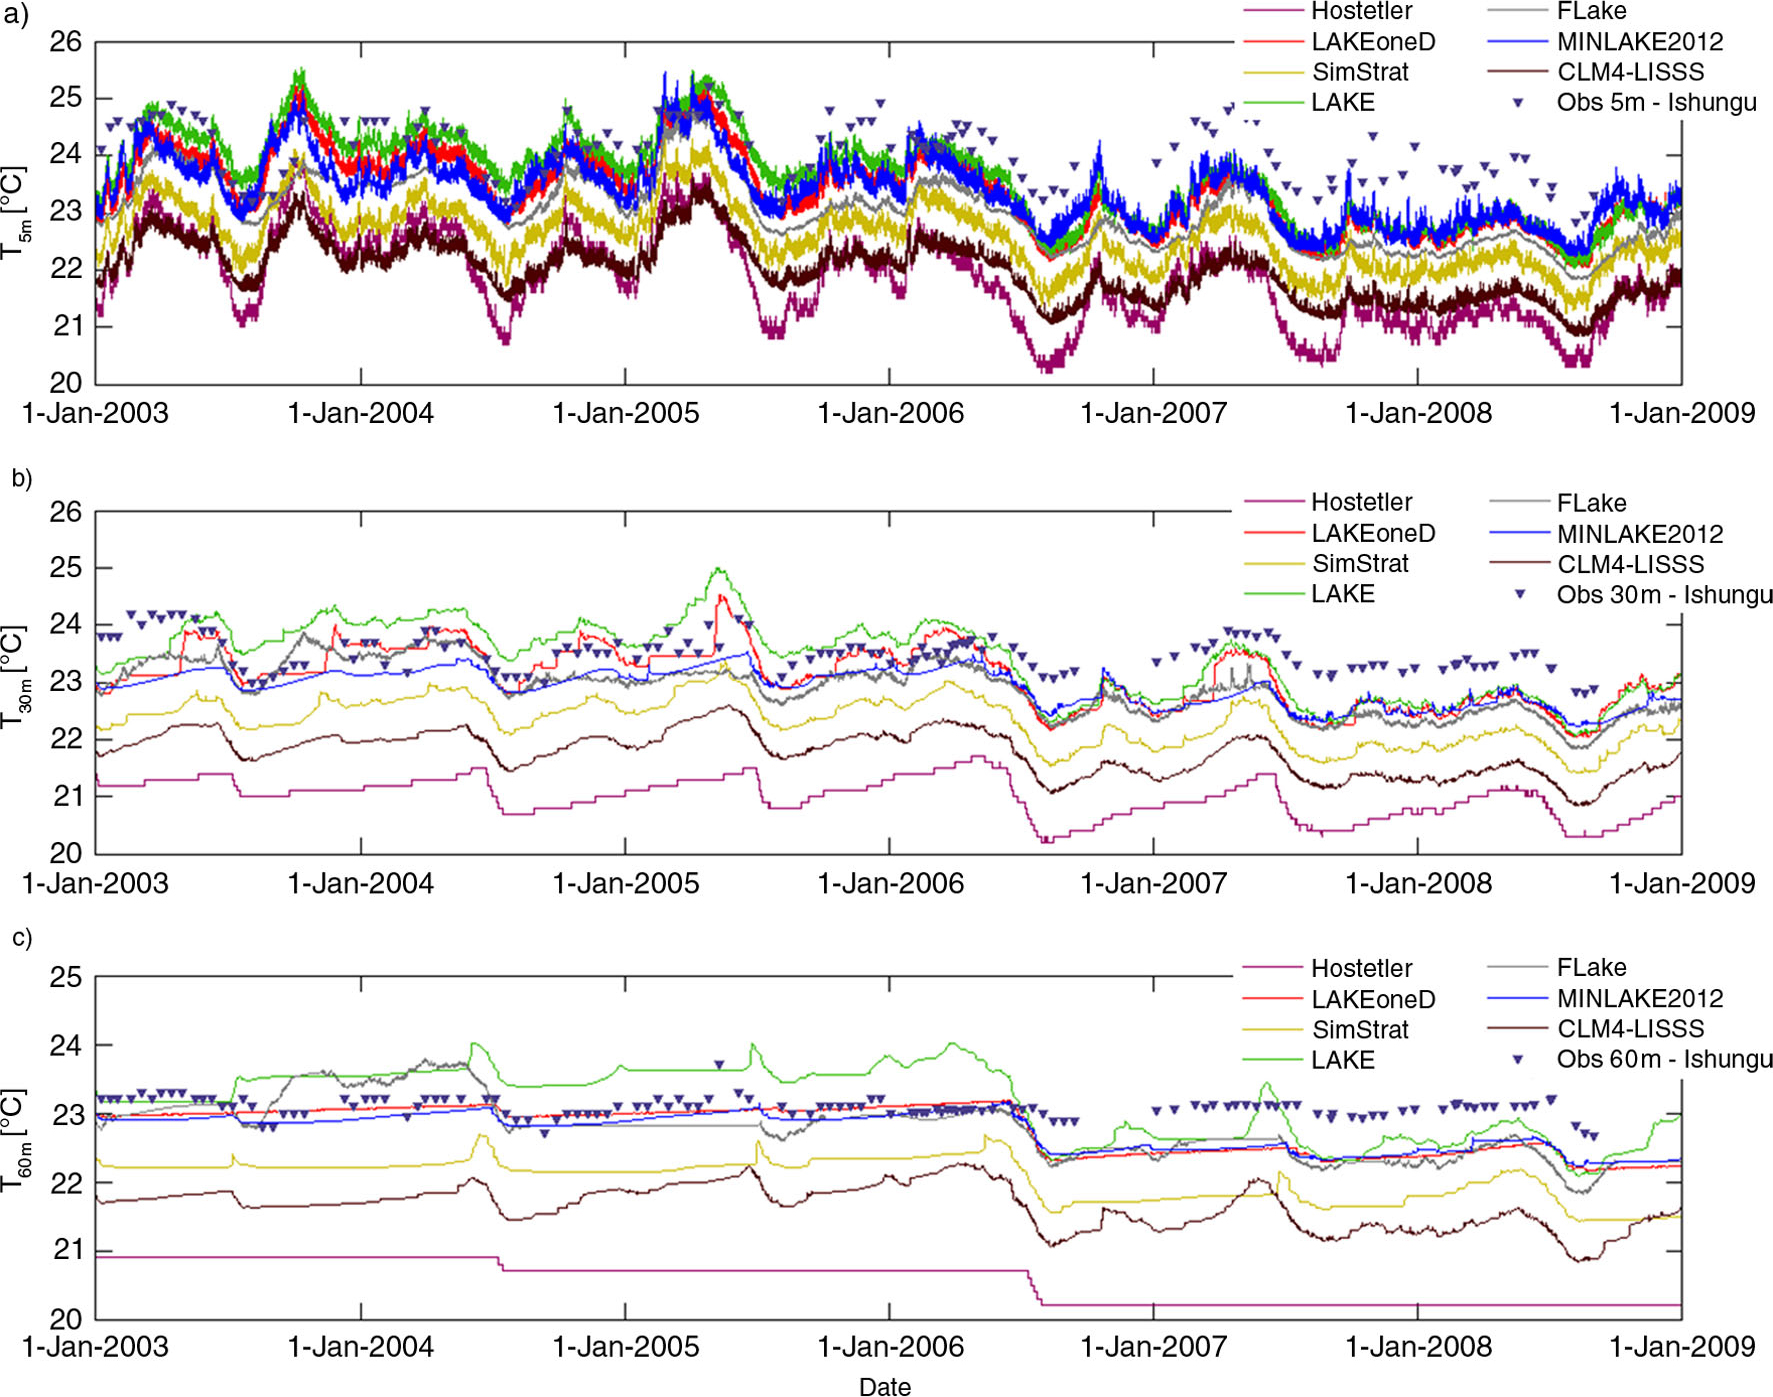
Fig. 4
Brier Skill Score (BSS) vertical profiles at Ishungu (Lake Kivu), calculated per 1 m vertical increment over the respective integration period, for (a) the WS Kamembe 60 m, (b) the WS Bukavu 60 m, (c) the WS Kamembe 240 m and (d) the WS Bukavu 240 m integrations. Note that Hostetler, FLake and CLM4-LISSS were not applied in the 240 m depth experiment.
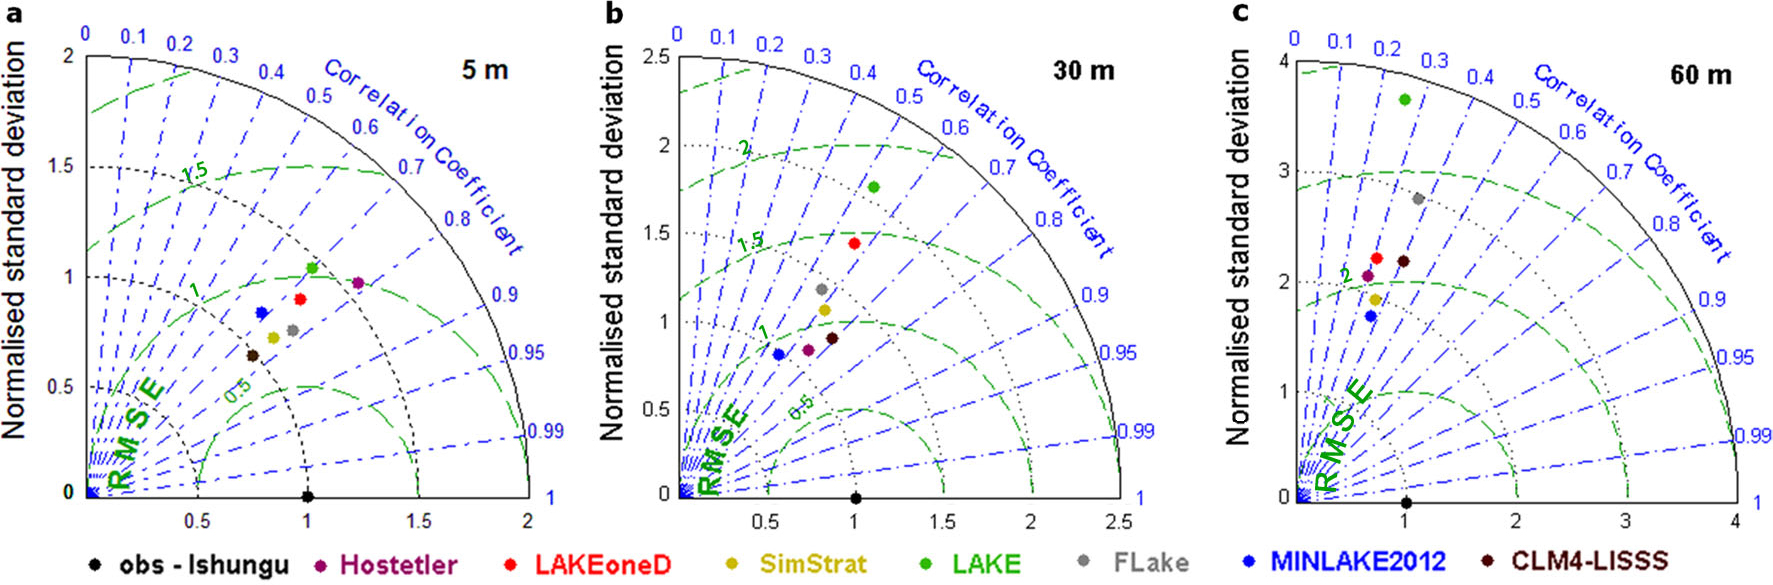
Fig. 5
Taylor diagram indicating model performance for water temperature at (a) 5 m, (b) 30 m and (c) 60 m depths at Ishungu (Lake Kivu), 2003–2008. Standard deviation σ (°C; radial distance), centred Root Mean Square Error RMSE c (°C; distance apart) and Pearson correlation coefficient r (azimuthal position of the simulation field) were calculated from the observed temperature profile interpolated to a regular grid (1 m increment) and the corresponding modelled midday profile.
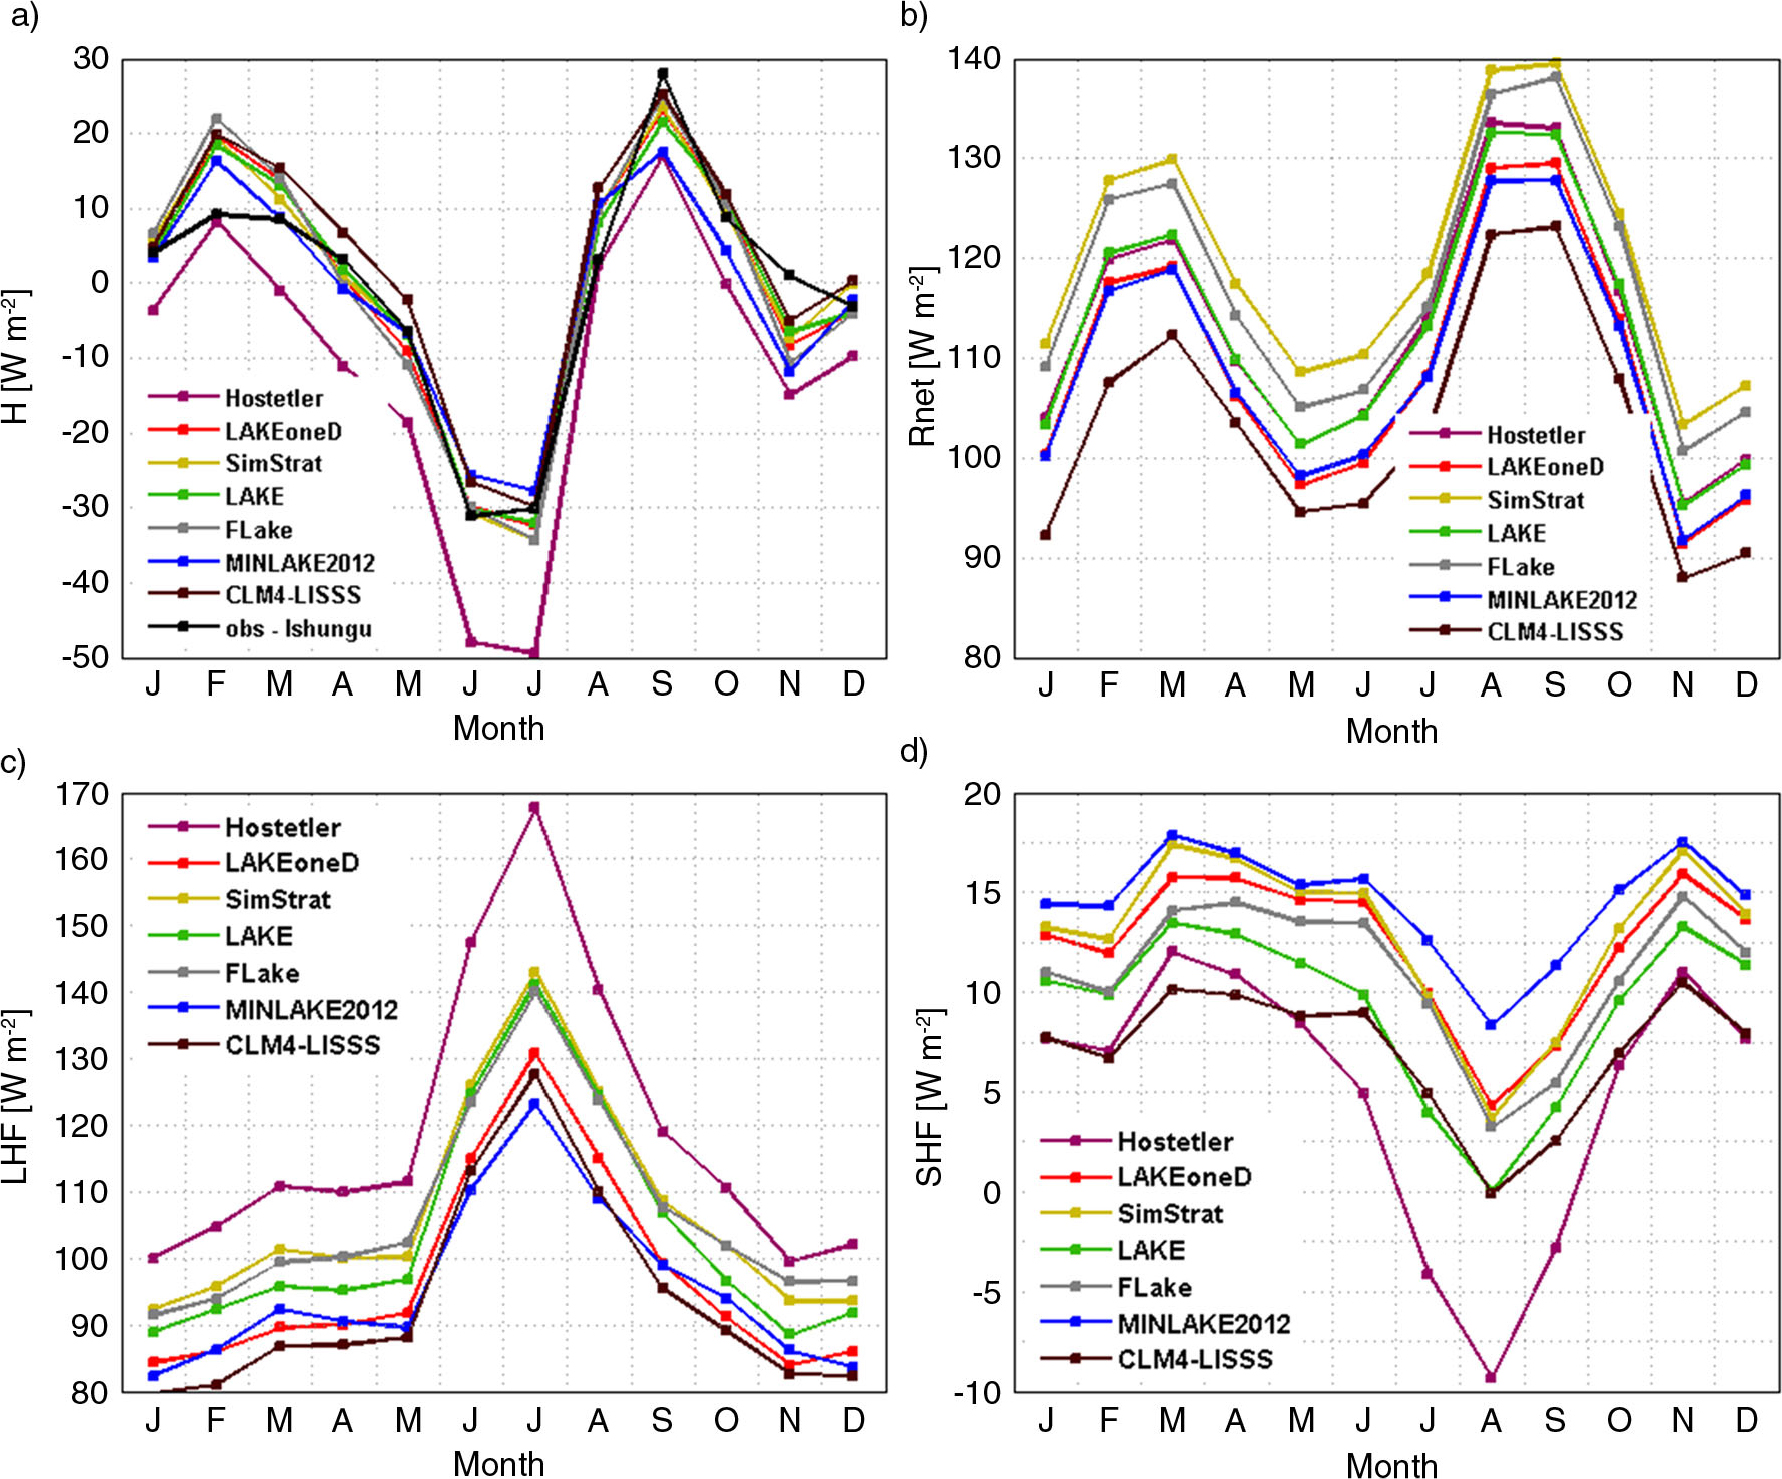
Fig. 6
Monthly average lake energy balance components (W m−2) at Ishungu (Lake Kivu), 2003–2008, calculated by model's surface flux routines. Components are (a) lake enthalpy change H, (b) net radiation R net , (c) latent heat flux LHF, and (d) sensible heat flux SHF.
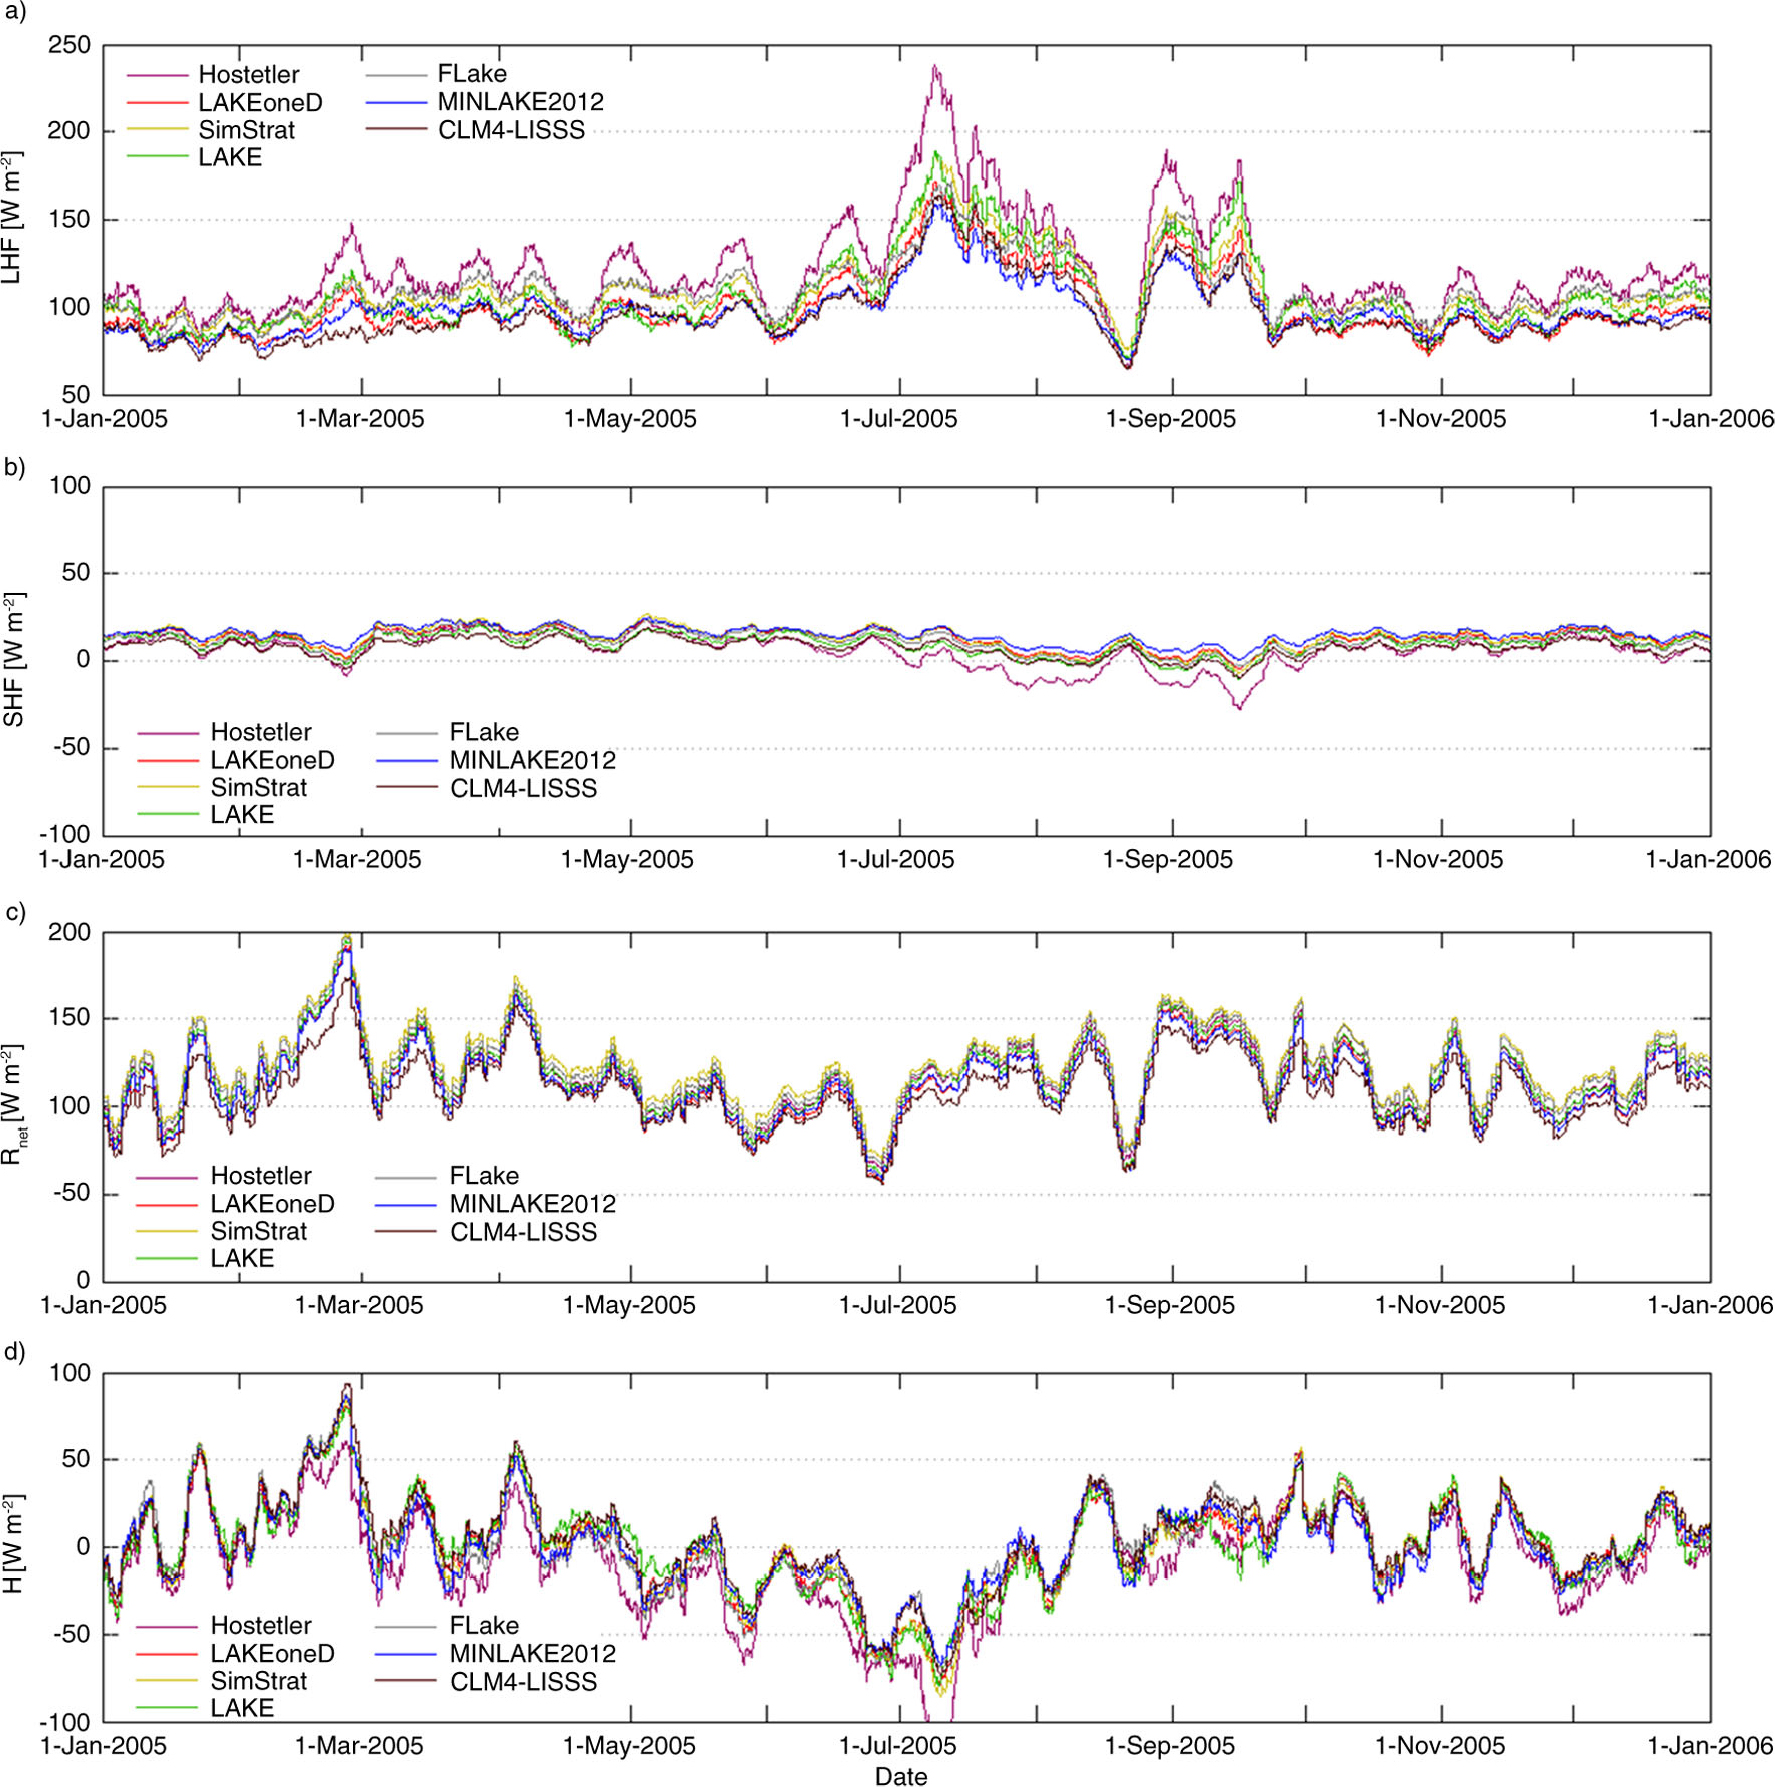
Fig. 7
Running mean lake energy balance components (W m −2; 7 d averaging window) at Ishungu (Lake Kivu), for 2005. Components are (a) latent heat flux LHF, (b) sensible heat flux SHF, (c) net radiation R net , and (d) the resulting lake enthalpy change H .
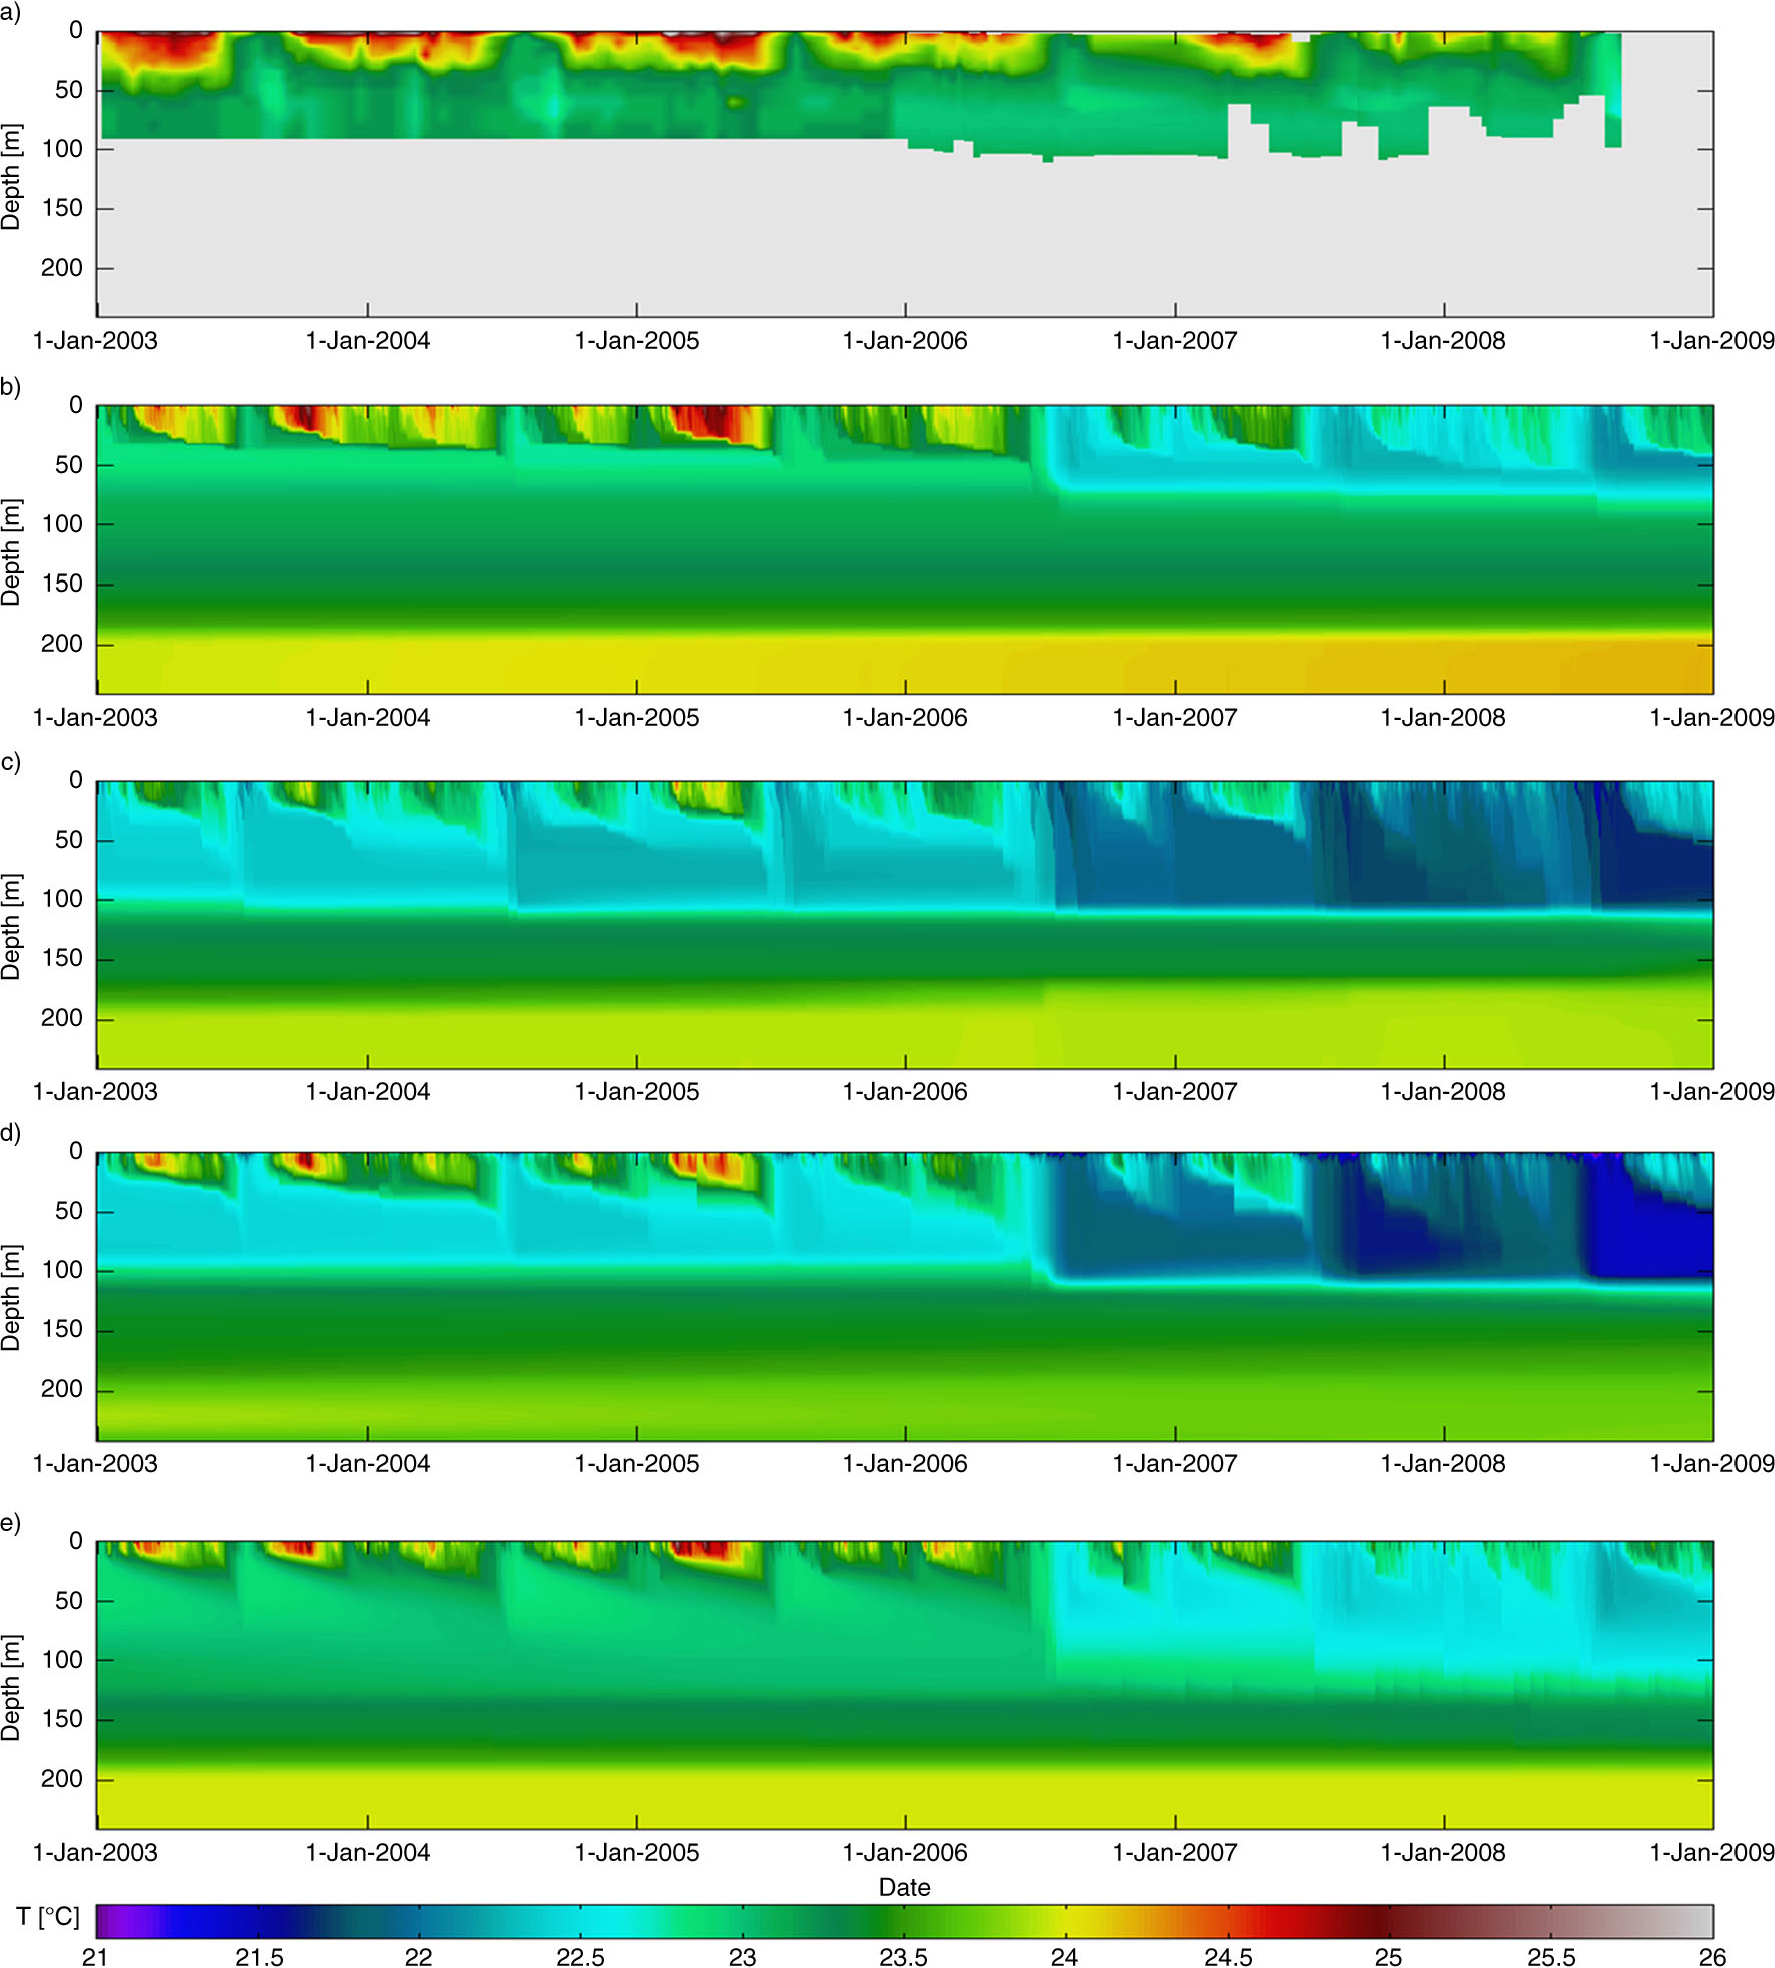
Fig. 8
Lake water temperatures (°C) at Ishungu (Lake Kivu), 2003–2008: (a) as observed, and as predicted by the models: (b) LAKEoneD, (c) SimStrat, (d), LAKE, (e) MINLAKE2012 for the 240 m deep geometry. Note that linear interpolation was applied to the observed Ishungu profiles to avoid spurious extrapolation effects, and grey areas therefore denote depths or longer time periods for which no observations are available.
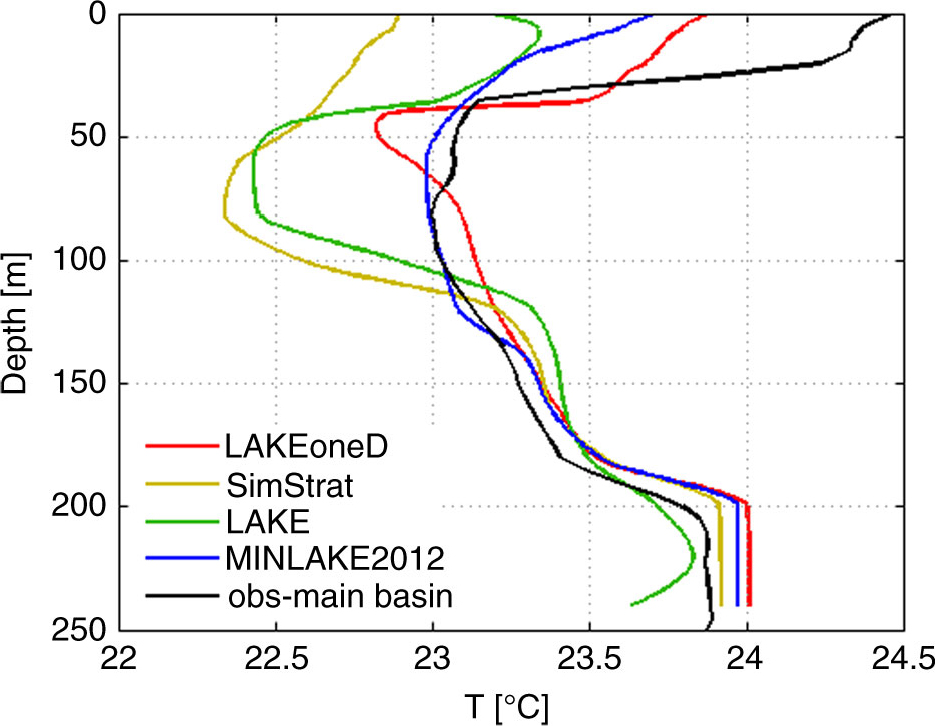
Fig. 9
Comparison of the observed temperature profile representative for the main basin during February 2004, as reported by Schmid et al. (2005; reproduced with permission), and corresponding modelled profiles (February 2004 average).
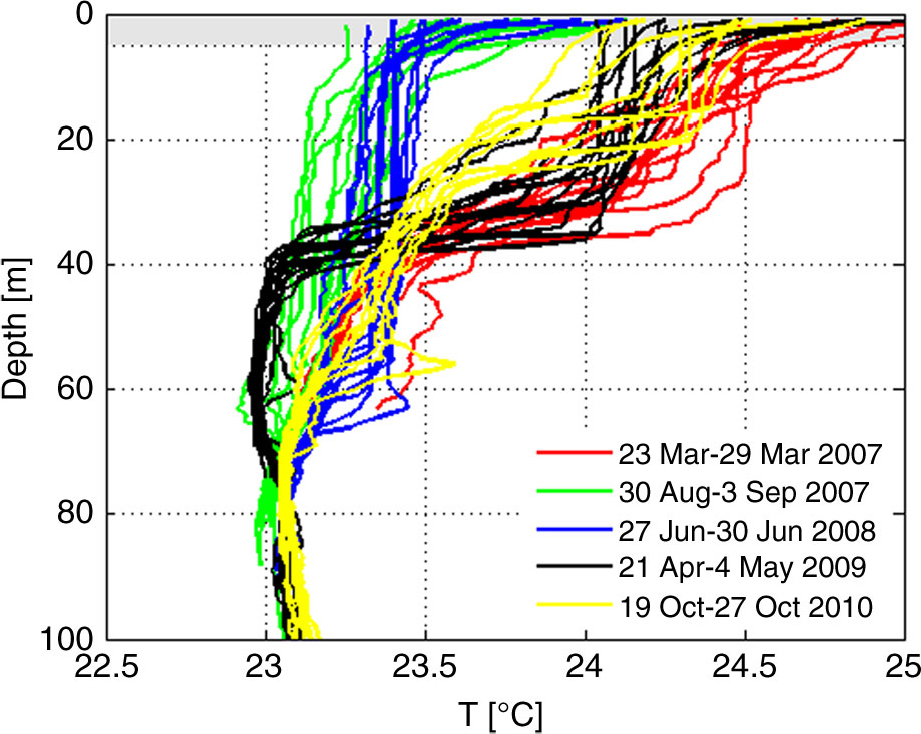
Fig. 10
Temperature profiles collected at 14 different locations in Lake Kivu during five cruises. Profiles collected at Bukavu and Kabuno bay are omitted due to their clear deviation from profiles of the main basin. Differences in the top 5 m (grey shade area) are partly due to daily variations.
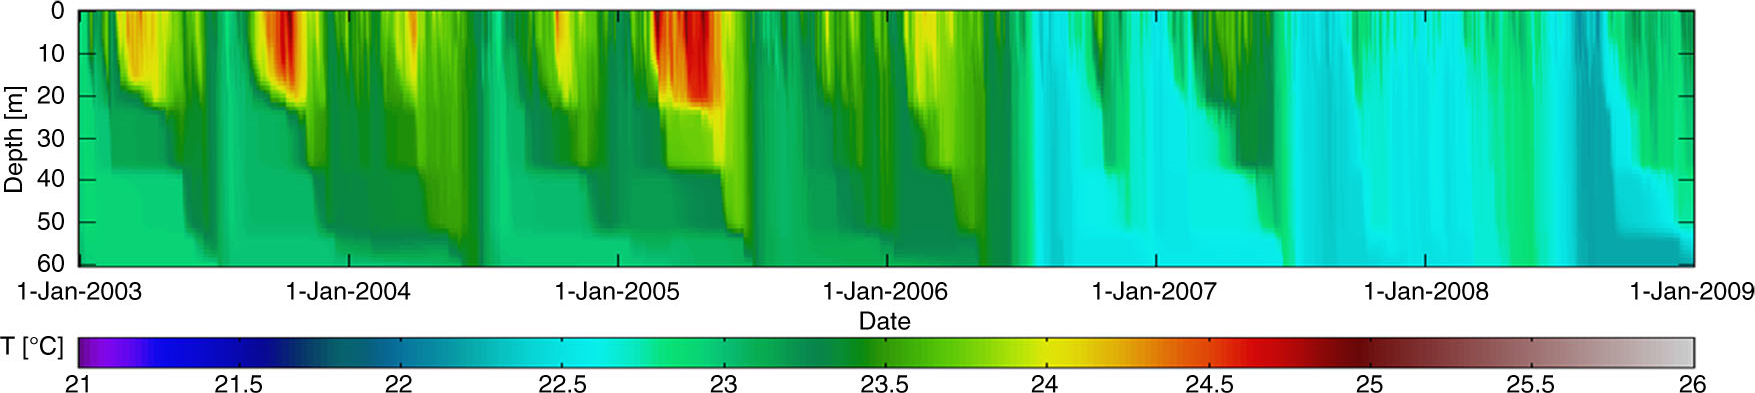
Fig. 11
Lake water temperatures (°C) at Ishungu (Lake Kivu), 2003–2008, as predicted by SimStrat, using a modified turbulent heat flux calibration parameter.