
Table 1. Set-up parameters of the lake models
Latitude51.97028852.92000053.000809653.32123552.04193352.190000Longitude4.9263135.6400005.60894605.9765485.4380115.070000Depth (m)0.52.52.02.01.52.5Fetch (km)0.15.02.01.01.05.0Type of water bodyDitchLakeCanalCanalLakeLake
Table 2. Meteorological forcing parameters
Surface pressure (hPa)xx10 m Wind speed (m/s)xx2 m Temperature (K)xx2 m Specific humidity (kg/kg)x2 m Relative humidity (percentage)xSolid precipitation (kg/m2/s)xPrecipitation (kg/m2/s)xTotal cloud cover (fraction)xLow cloud cover (fraction)xIncoming SW radiation (W/m2)xIncoming LW radiation (W/m2)x
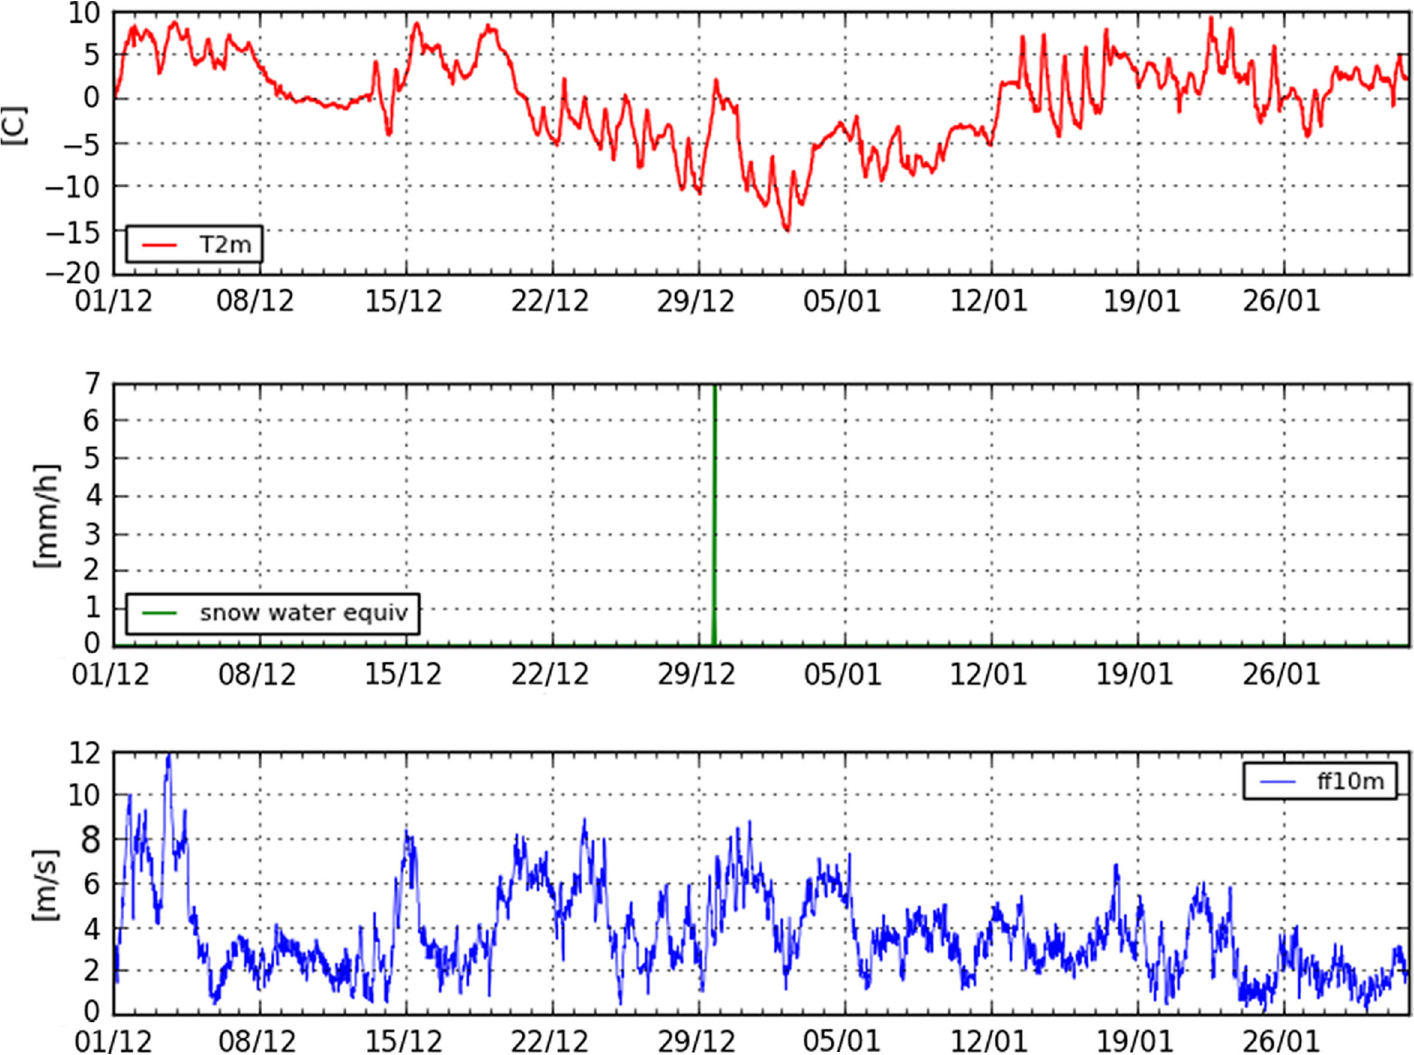
Fig. 1
Time series of 2 m temperature, snowfall and wind speed during the winter of 1996–1997 at Cabauw. The snowfall on 29 December 1996 is converted to a snow layer of 0.05 m.
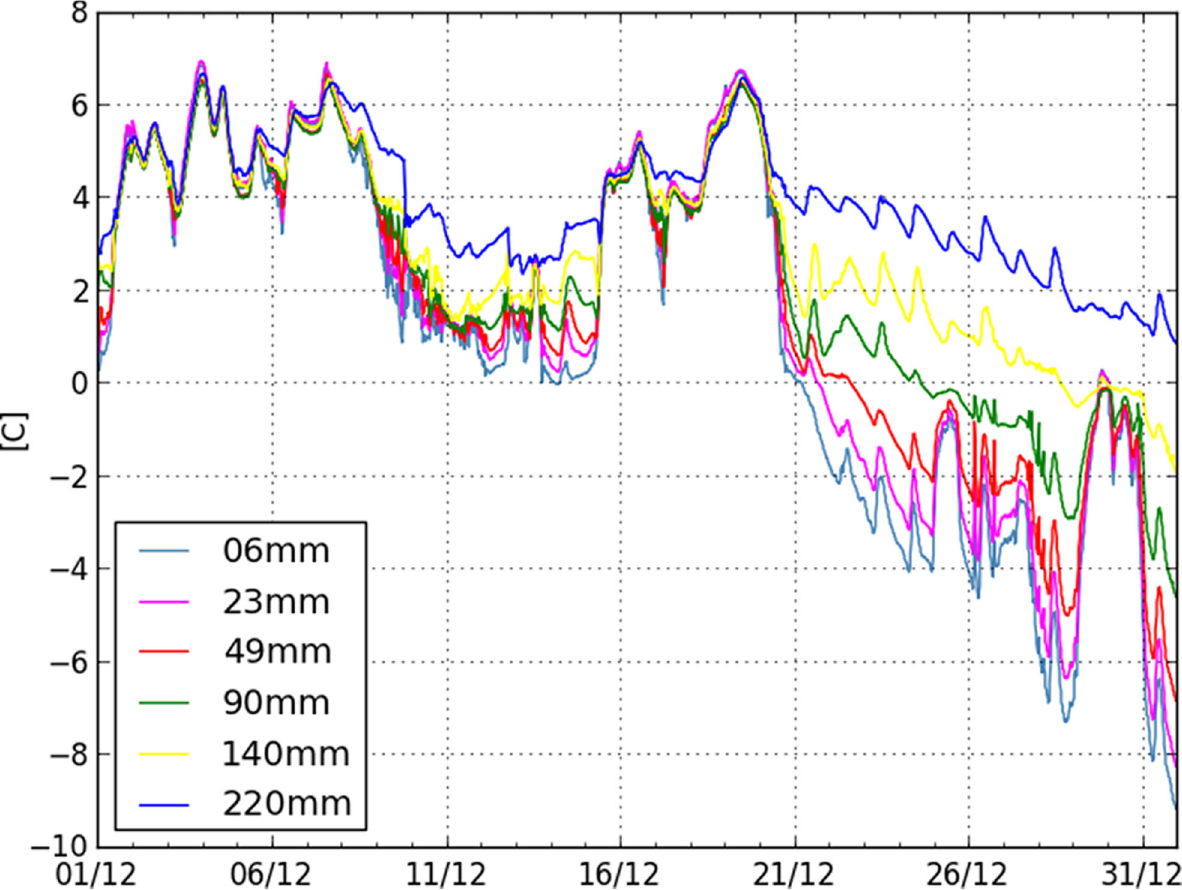
Fig. 2
Water temperature records at fixed depths from the surface at Cabauw (The Netherlands) during December 1996.
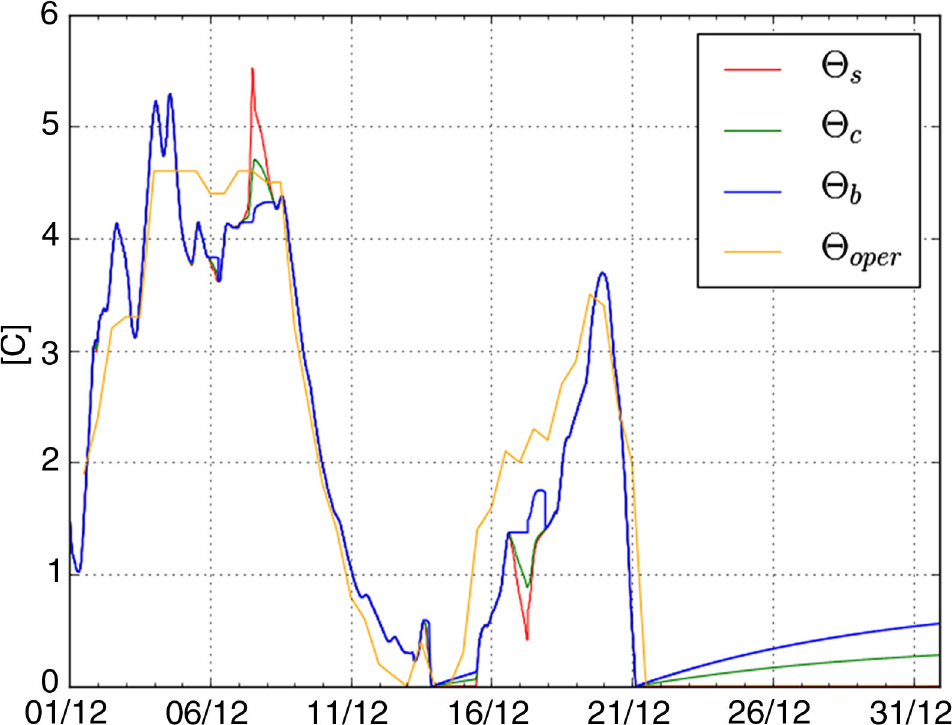
Fig. 3
Simulated water temperatures from FLake and BW88 during December 1996, Θ s is mixed layer temperature, Θ c is column temperature, Θ b is bottom temperature, Θoper is the column temperature of BW88.
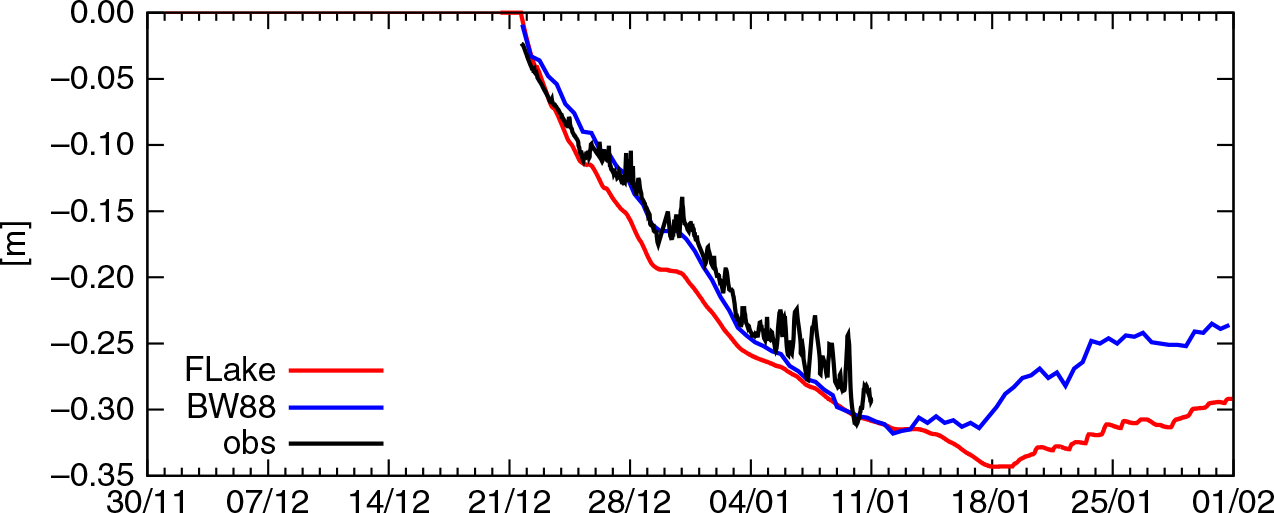
Fig. 4
Observed and simulated ice thickness at Cabauw during the winter of 1996–1997. The biases for FLake and BW88 are −0.0072 and −0.0067 m, respectively. Note that the lake models are driven by observations.
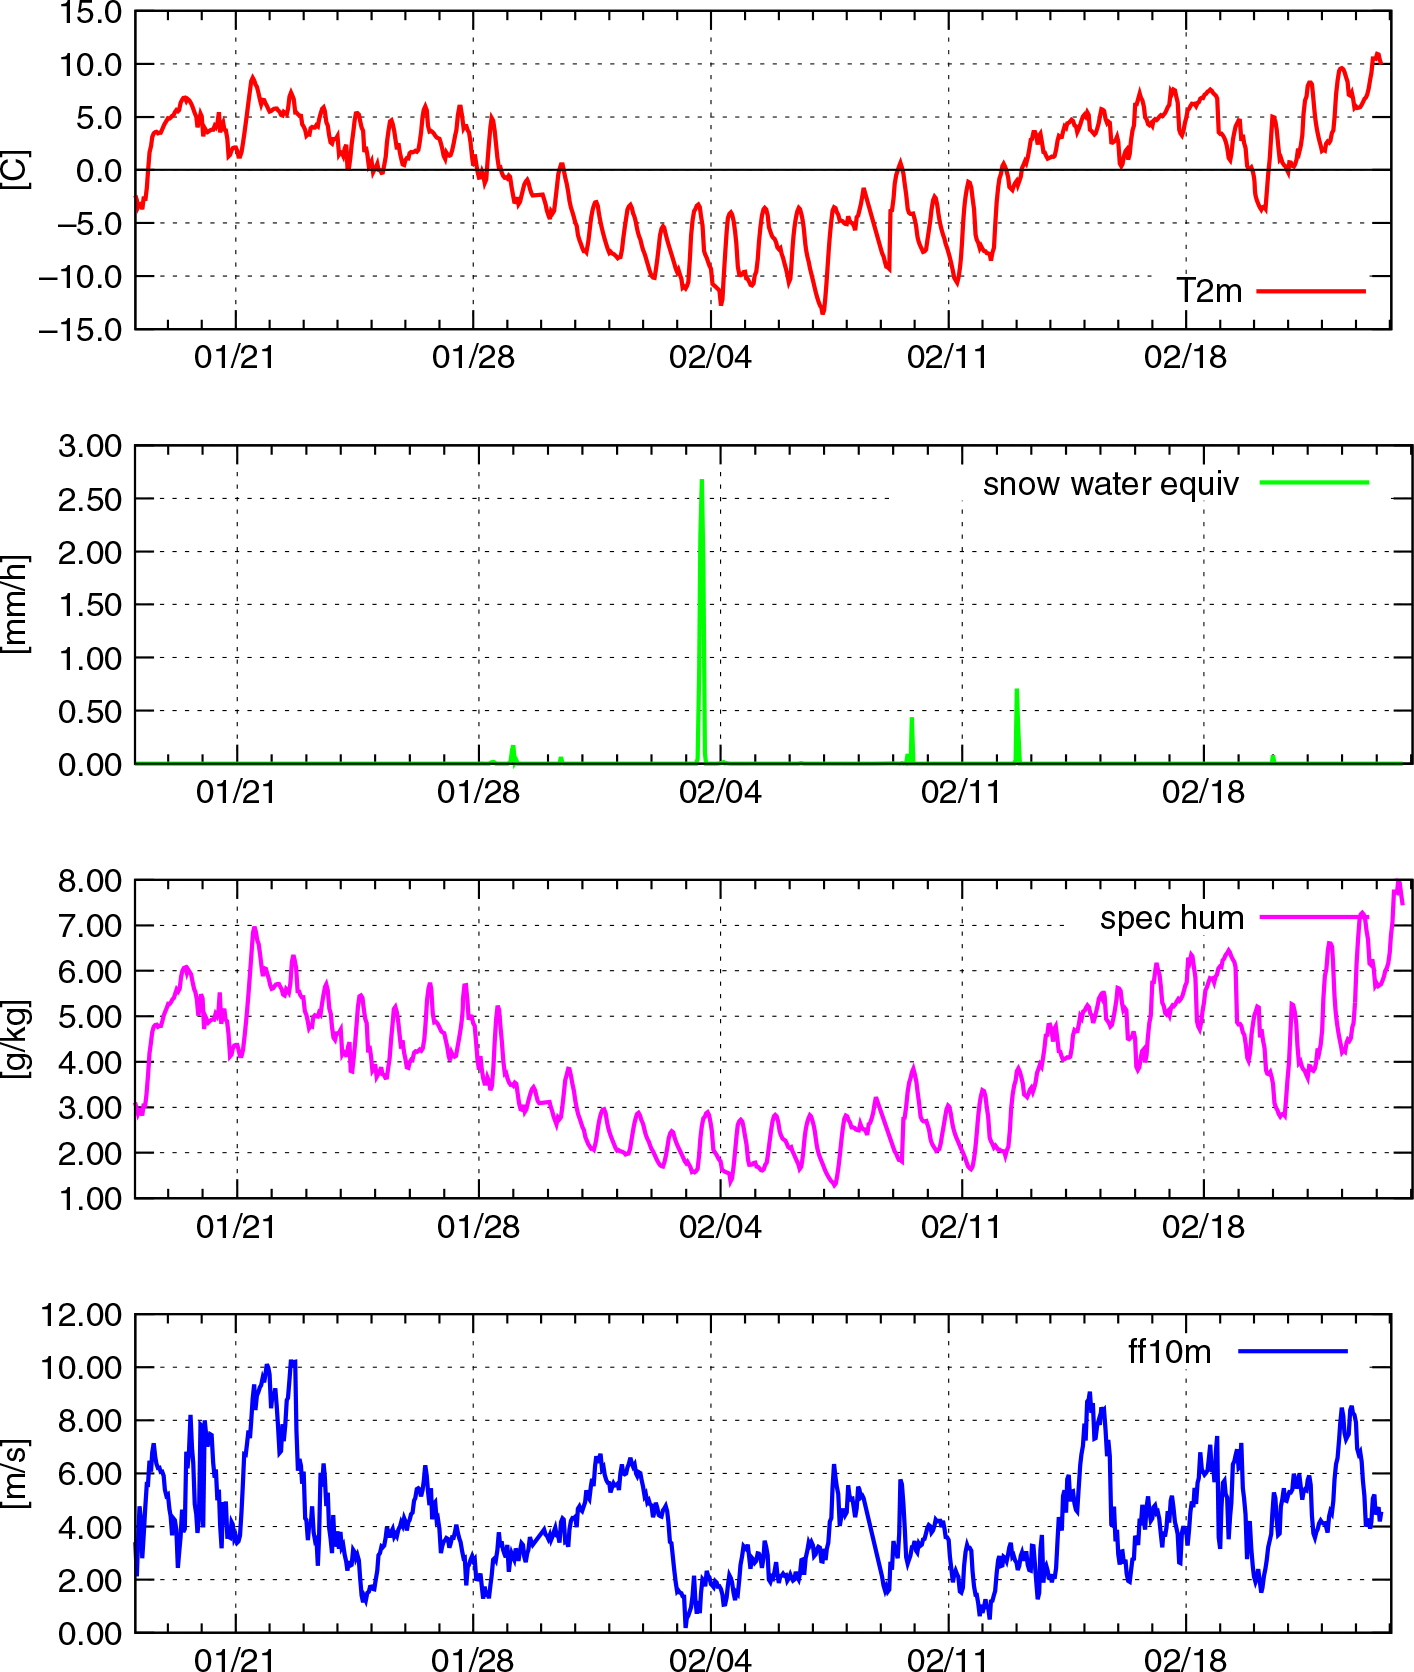
Fig. 5
2 m temperature, snowfall, specific humidity and 10 m wind simulated by HARMONIE for IJlst during the cold spell in January–February 2012.
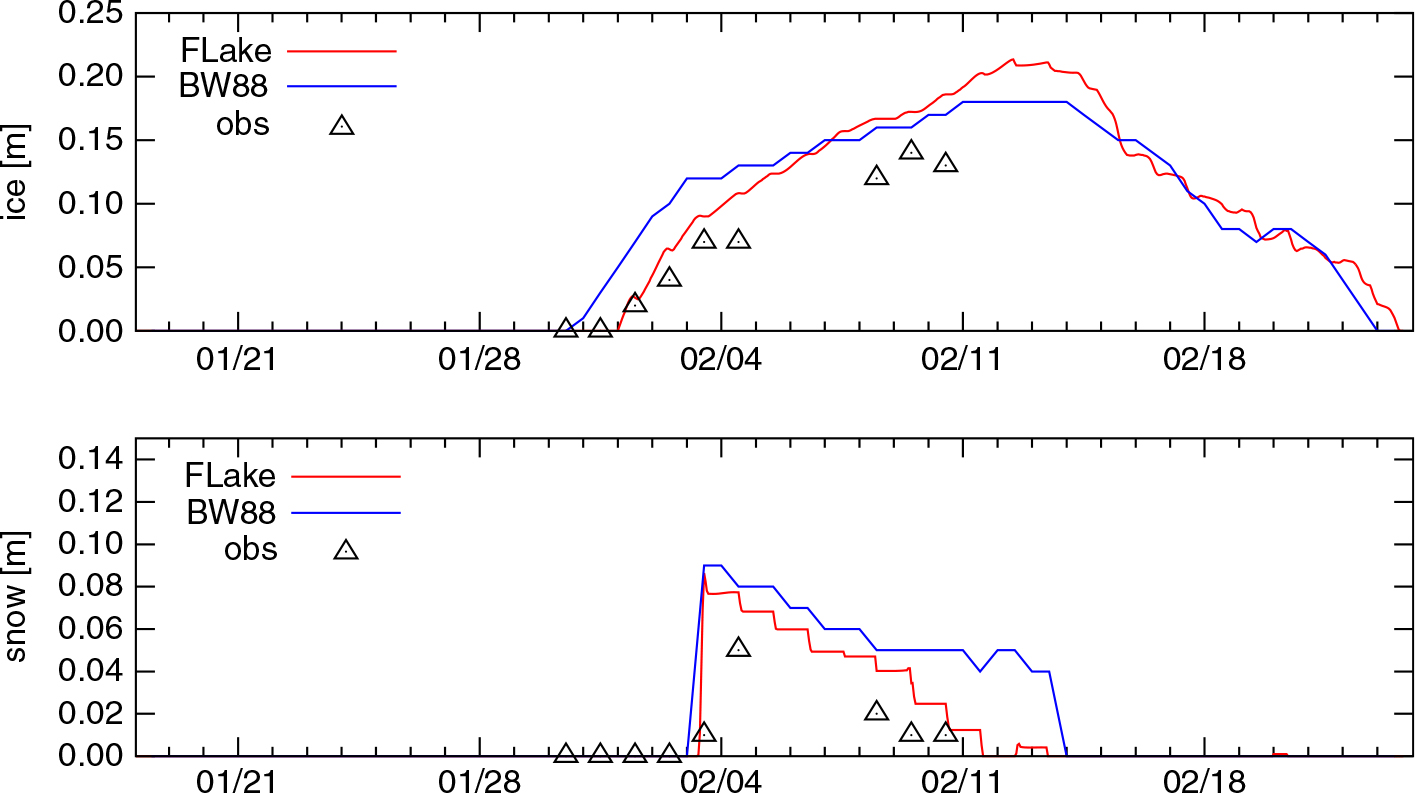
Fig. 6
Modelled ice (top) and snow (bottom) thickness and observations for IJlst during January–February 2012.
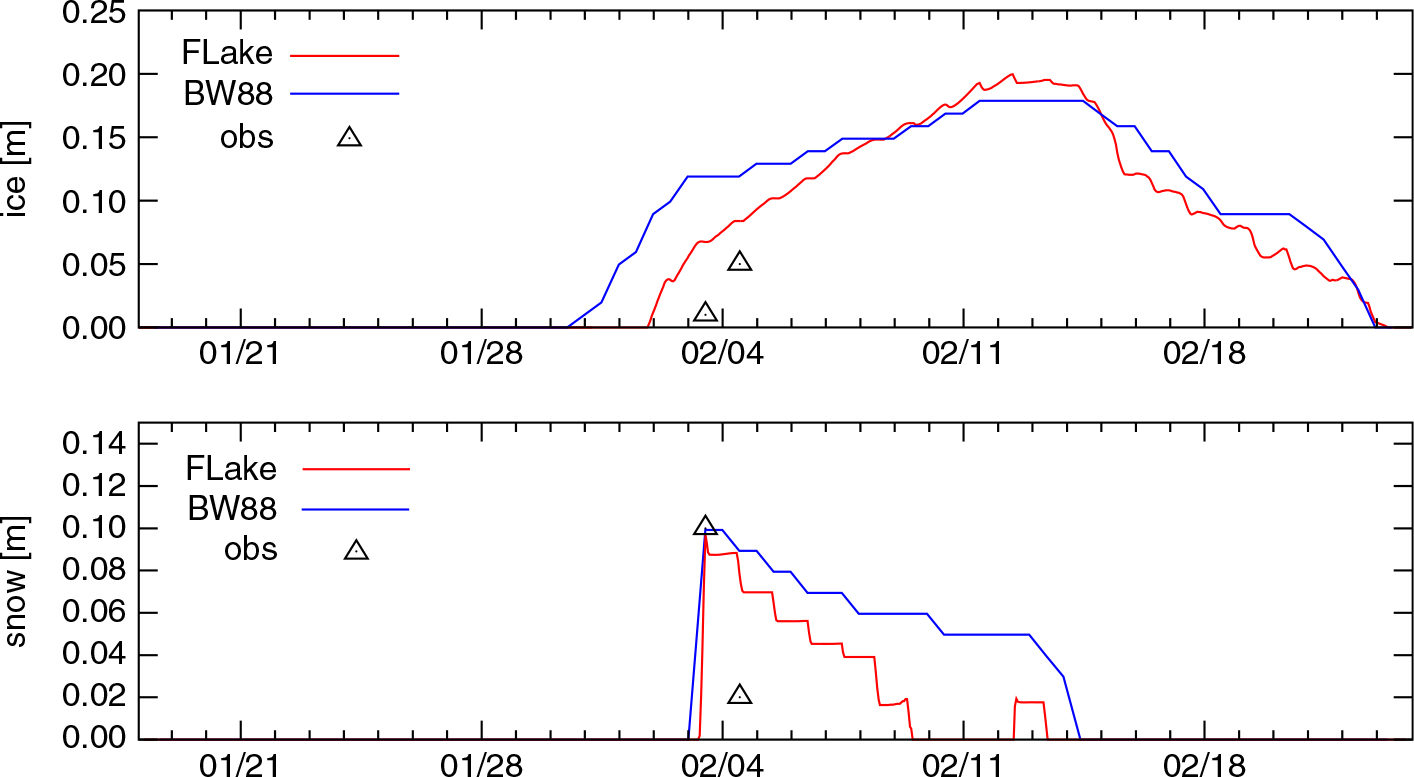
Fig. 7
Modelled ice (top) and snow (bottom) thickness and observations for Sloten during January–February 2012. Note the retarded freezing.
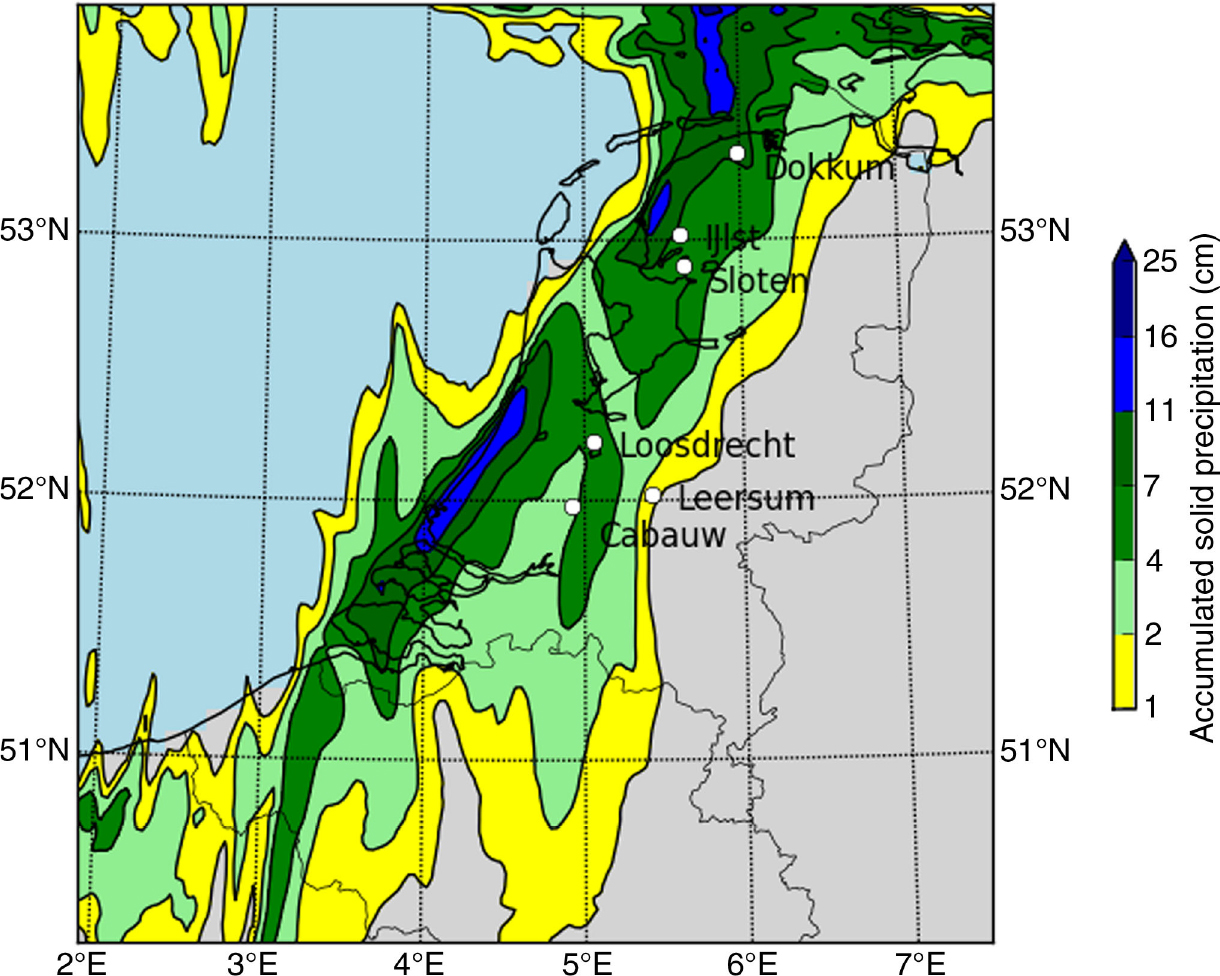
Fig. 8
Predicted accumulated snowfall over 24 h valid on 4 February 2012 08 h UTC. Note the different snow amounts in Dokkum, IJlst, Sloten, Leersum, Loosdrecht and Cabauw.
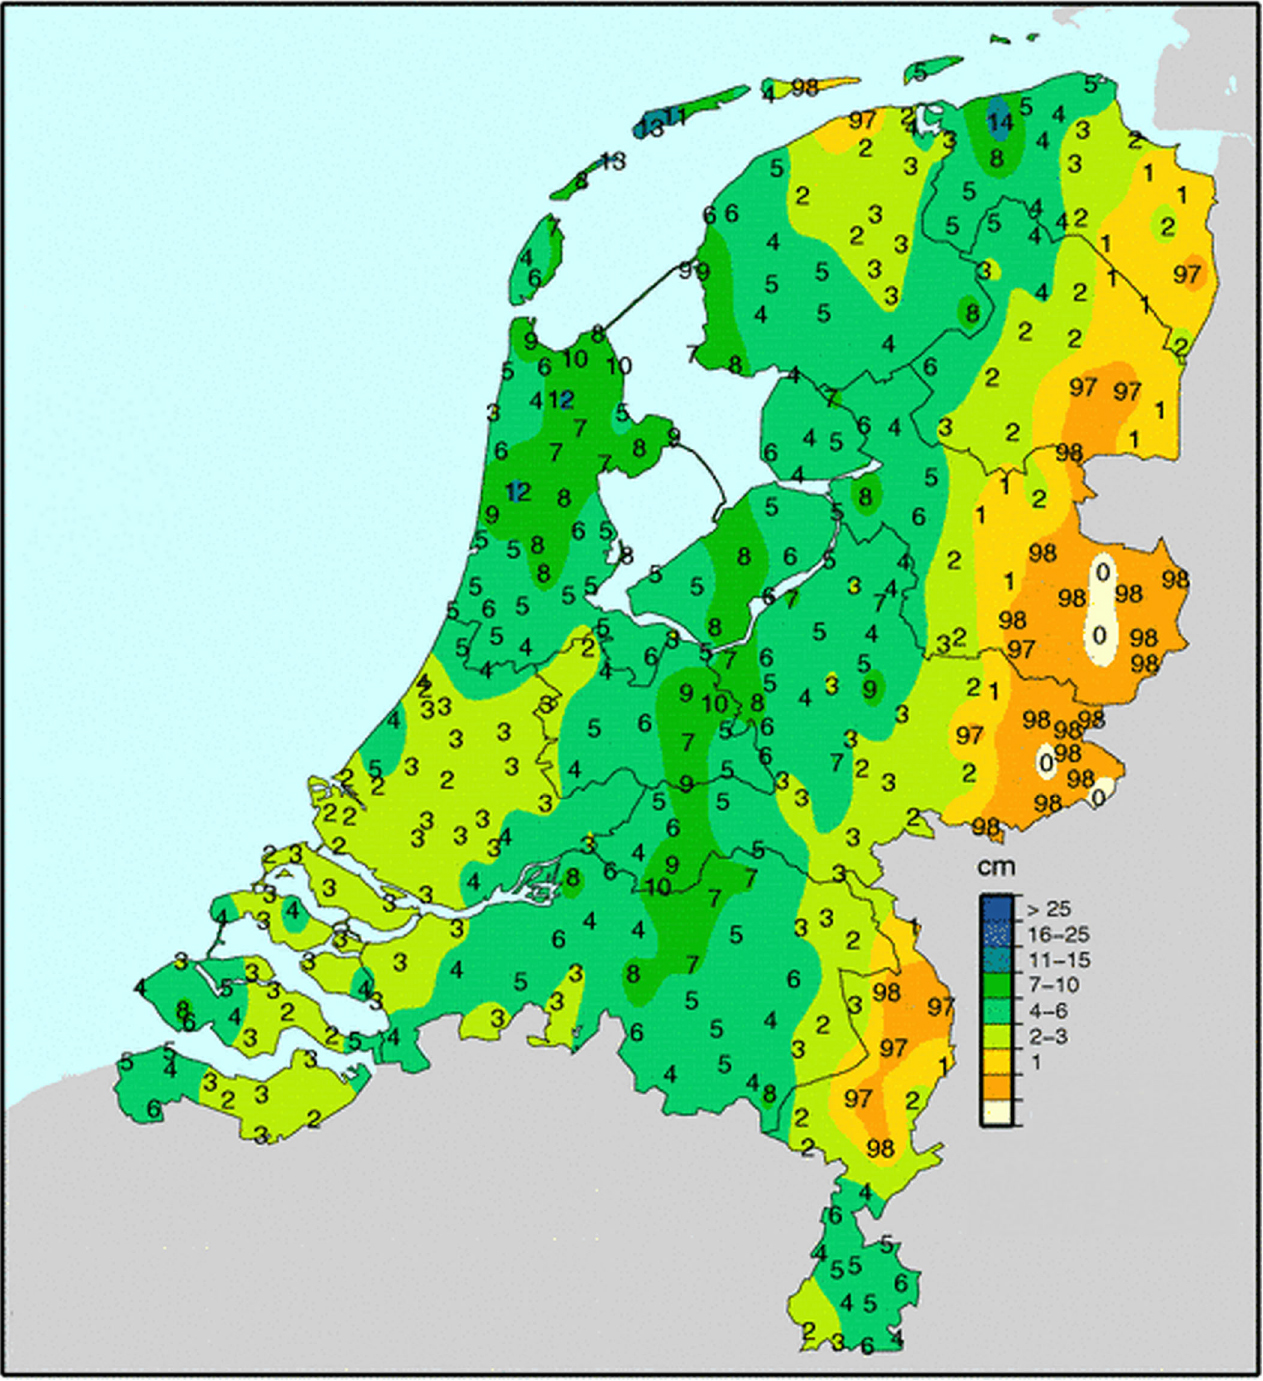
Fig. 9
Observed accumulated snowfall over 24 h valid on 4 February 2012 08 h UTC. Note that the snowfall is given in cm.
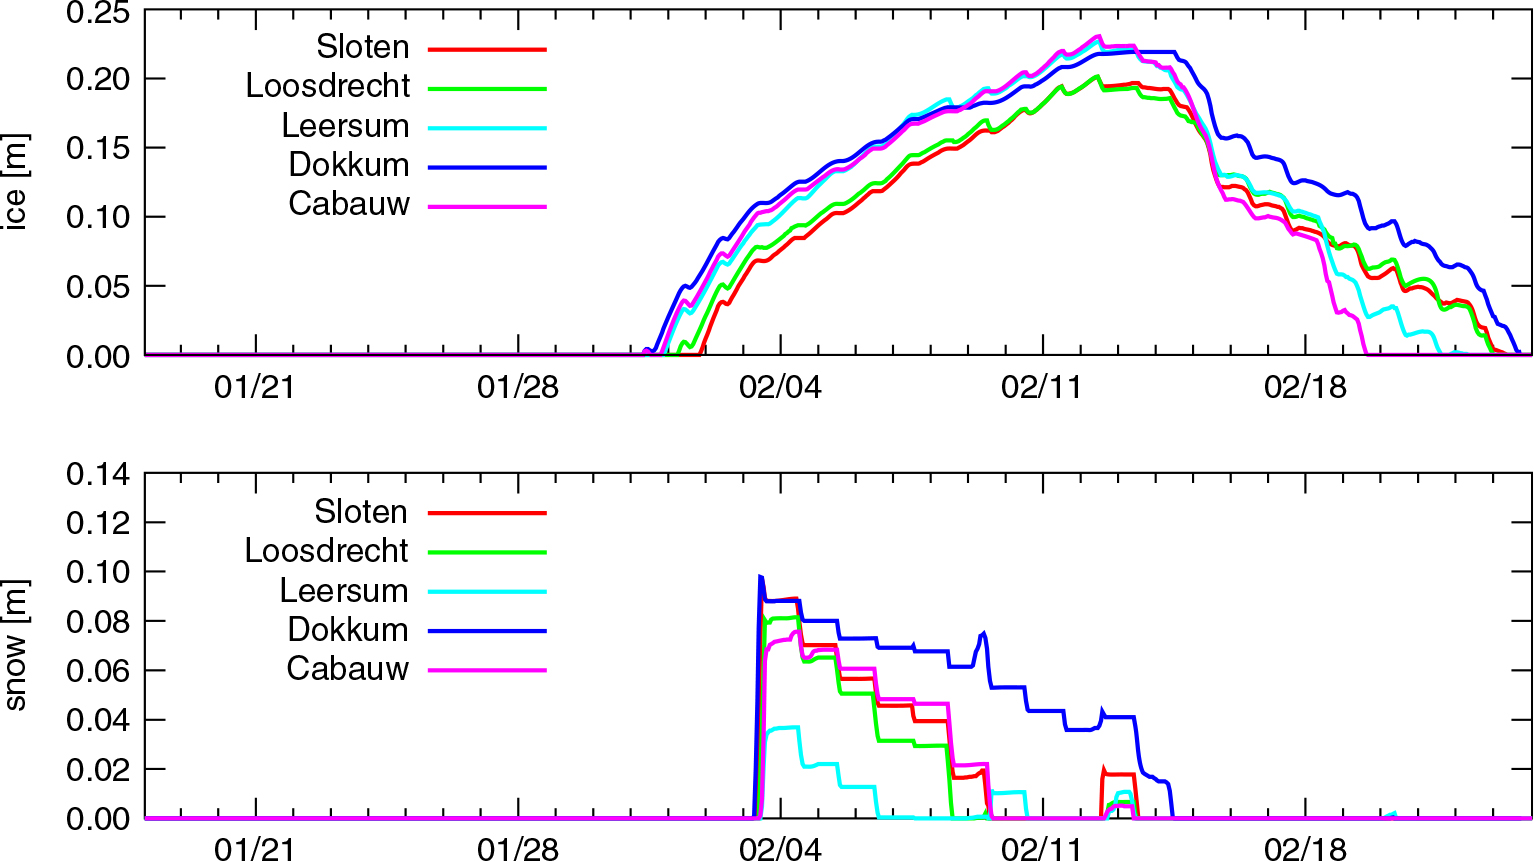
Fig. 10
Modelled ice and snow thickness by FLake for five locations during January–February 2012.
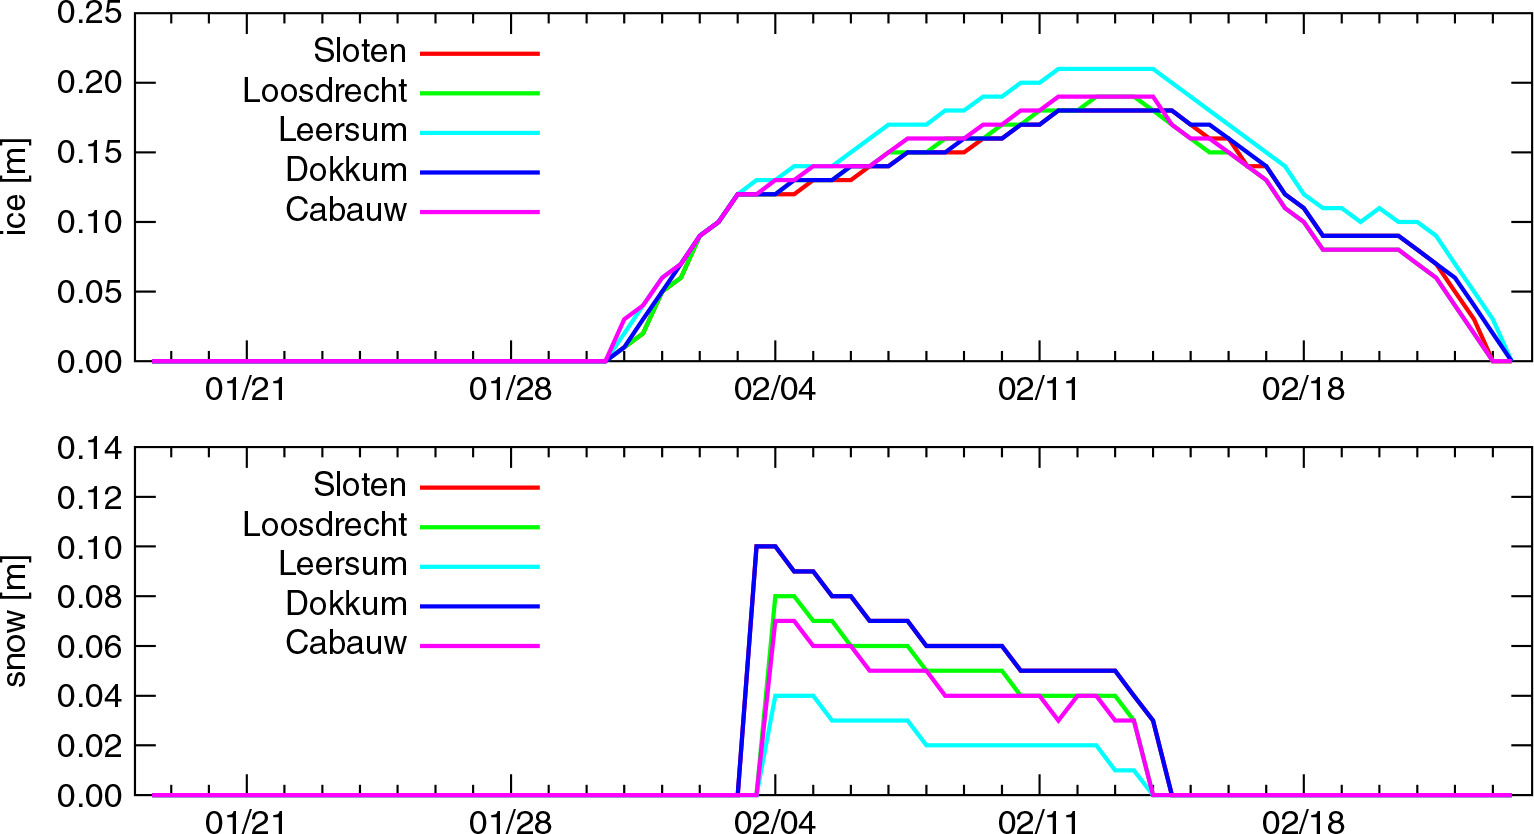
Fig. 11
Modelled ice and snow thickness by BW88 for five locations during January–February 2012.