
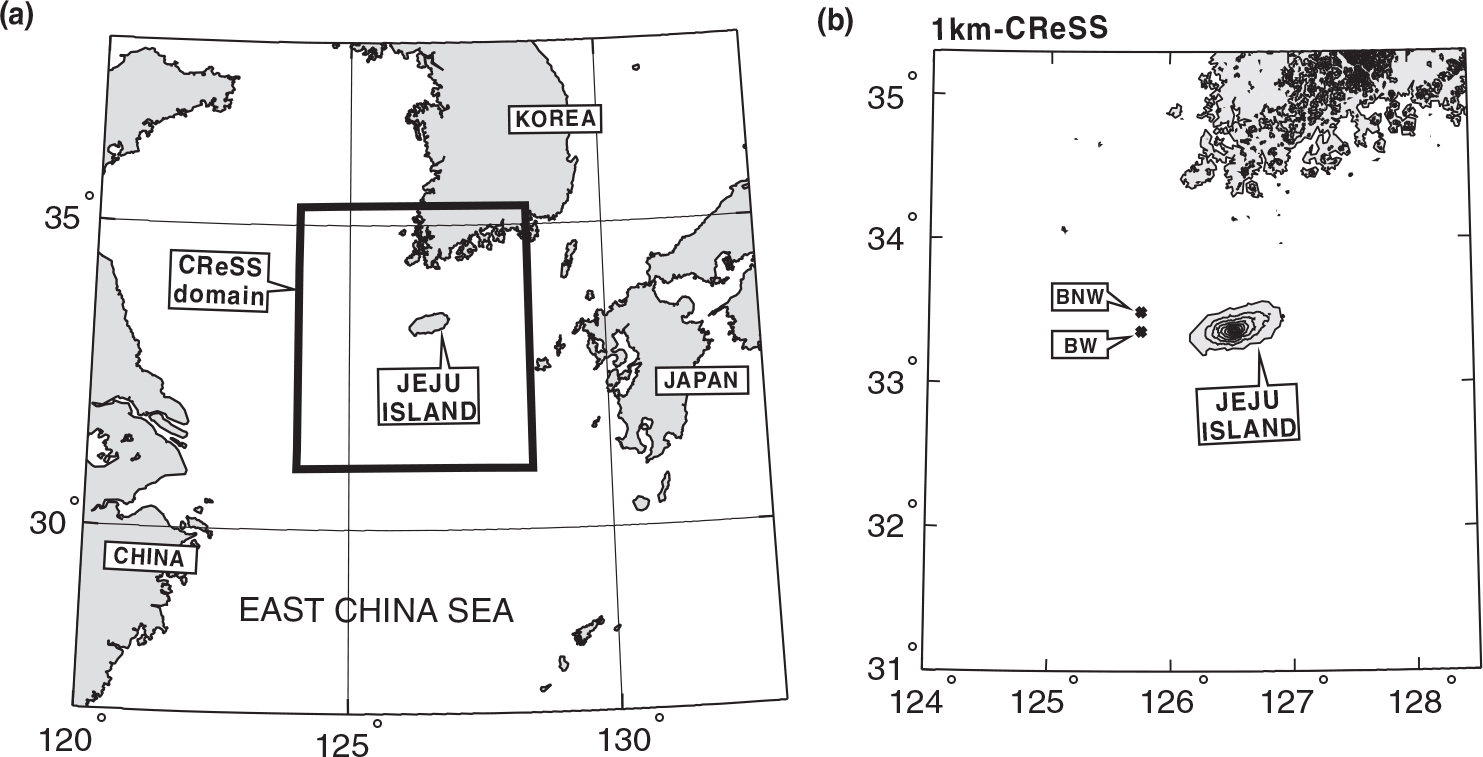
Fig. 1
Location and elevation map of Jeju Island. The inner domain [the square in (a)] is considered in numerical experiments using a cloud-resolving storm simulator (CReSS) with 1.0 km resolution [shown in (b)]. The centre locations of initial warm bubbles (BNW and BW) for the experiments are depicted by cross symbols in (b).
Table 1. Specifications of CReSS
Basic equationQuasi-compressible non-hydrostatic Navier–Stokes equations with a map factorProjectionLambert conformal conicVertical coordinateTerrain-followingAdvection schemeAnti-flux form with fourth-order central differentialTime splittingHorizontally explicit and vertically implicit for sound wavesPrecipitation schemeBulk cold-rain scheme (predicting qv, qc, qr, qi, qs, qg, Ni, Ns and Ng )Surface layerBulk method similar to Segami et al. (1989)
Table 2. List of idealised experiments
No bubble (NB)NB2NB4NB5BIL (BNW)BNW2BNW4BNW5BIL (BW)BW2BW4BW5
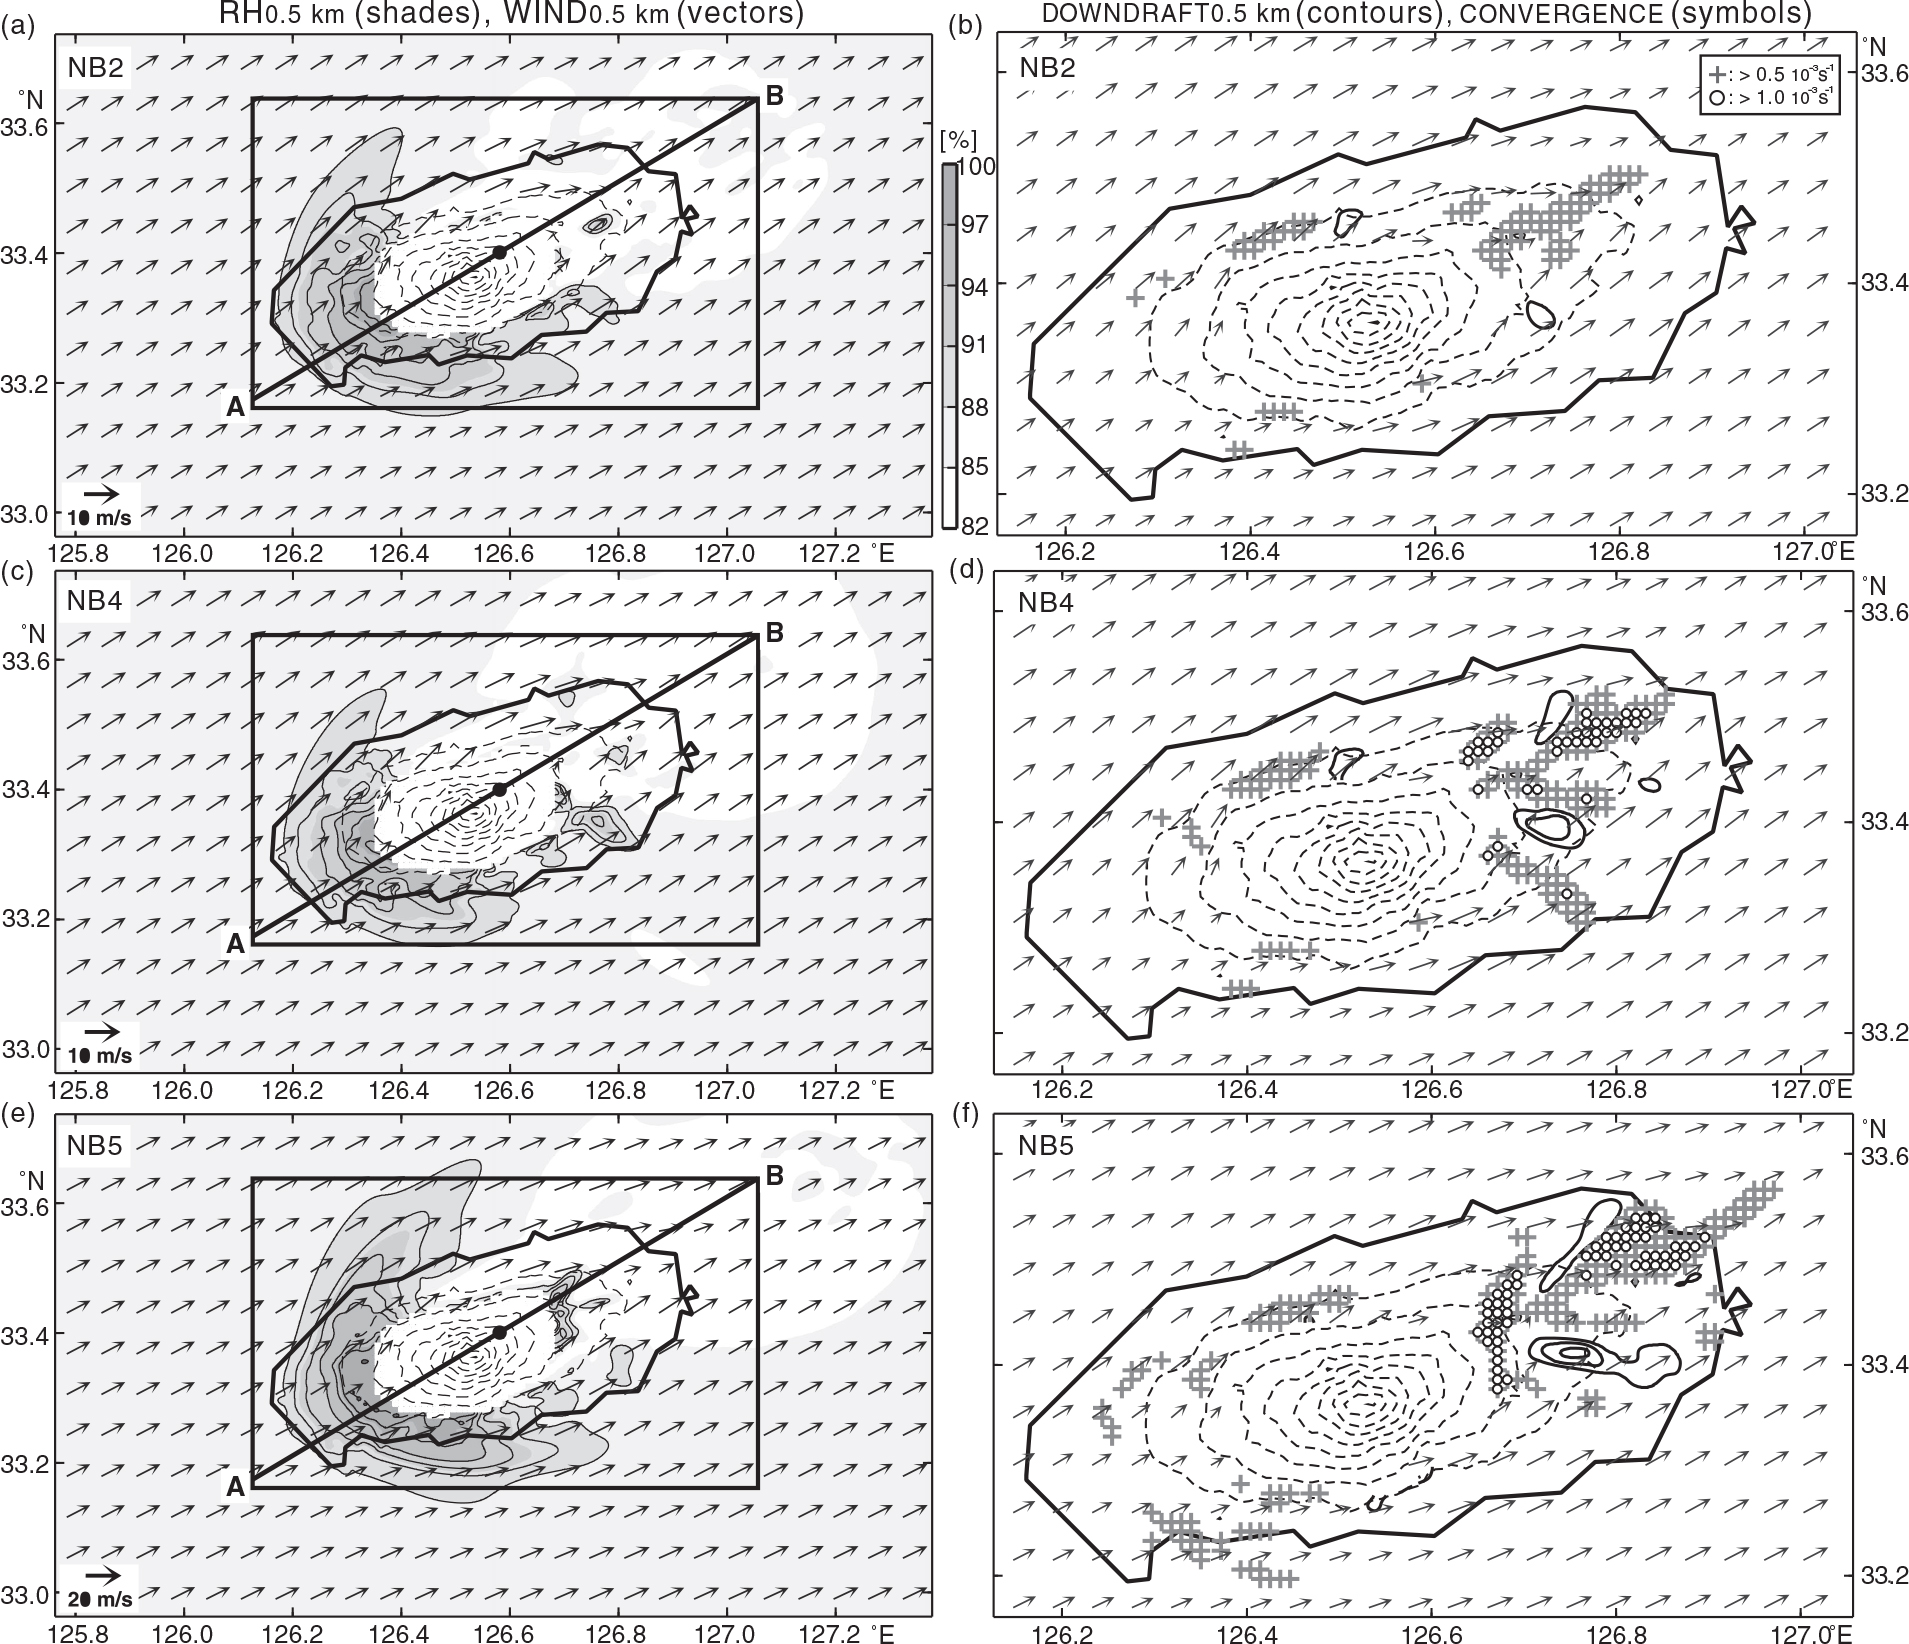
Fig. 2
Horizontal distributions of horizontal wind, relative humidity (RH), convergence and downdraft in the NB2, NB4 and NB5 runs at 0100 ST. The thick solid line and thin dashed lines in each panel represent the coastline and topography, respectively, of Jeju Island (contour interval, 200 m). The left panels (a), (c) and (e) show the horizontal wind field (arrows) and RH (in grey scale) at a height of 500 m. The right panels (b), (d) and (f) show the horizontal wind (arrows), the downdraft (contour intervals, 0.2 m s−1, from −0.3 m s−1) and maximum convergence (grey crosses and open circles represent convergences between 0.5×10⁻³ s−1 and 1.0×10⁻³ s−1, and greater than 1.0×10⁻³ s−1, respectively). The locations of the vertical 100-km long cross-sections shown in Fig. 3 are indicated in (a), (c) and (e). Black dots on line A–B in (a), (c) and (e) are the midpoints (at 50 km) of the cross-sections, and represent the locations of the downward pointing arrows in each panel of Fig. 3.
Table 3. Summarised results of experiments without bubble: inter-model comparisons
NB20.60.9−0.3NB40.71.7−0.6NB50.71.6−0.8
[i] Cwest and Ceast are the maximum intensity of the convergence at a height of 500 m on the terrain in the western and the eastern sides, respectively, of longitude 126.6°E, respectively. Weast is the maximum intensity of downdraft at a height of 500 m on the terrain in the eastern side of longitude 126.6°E.
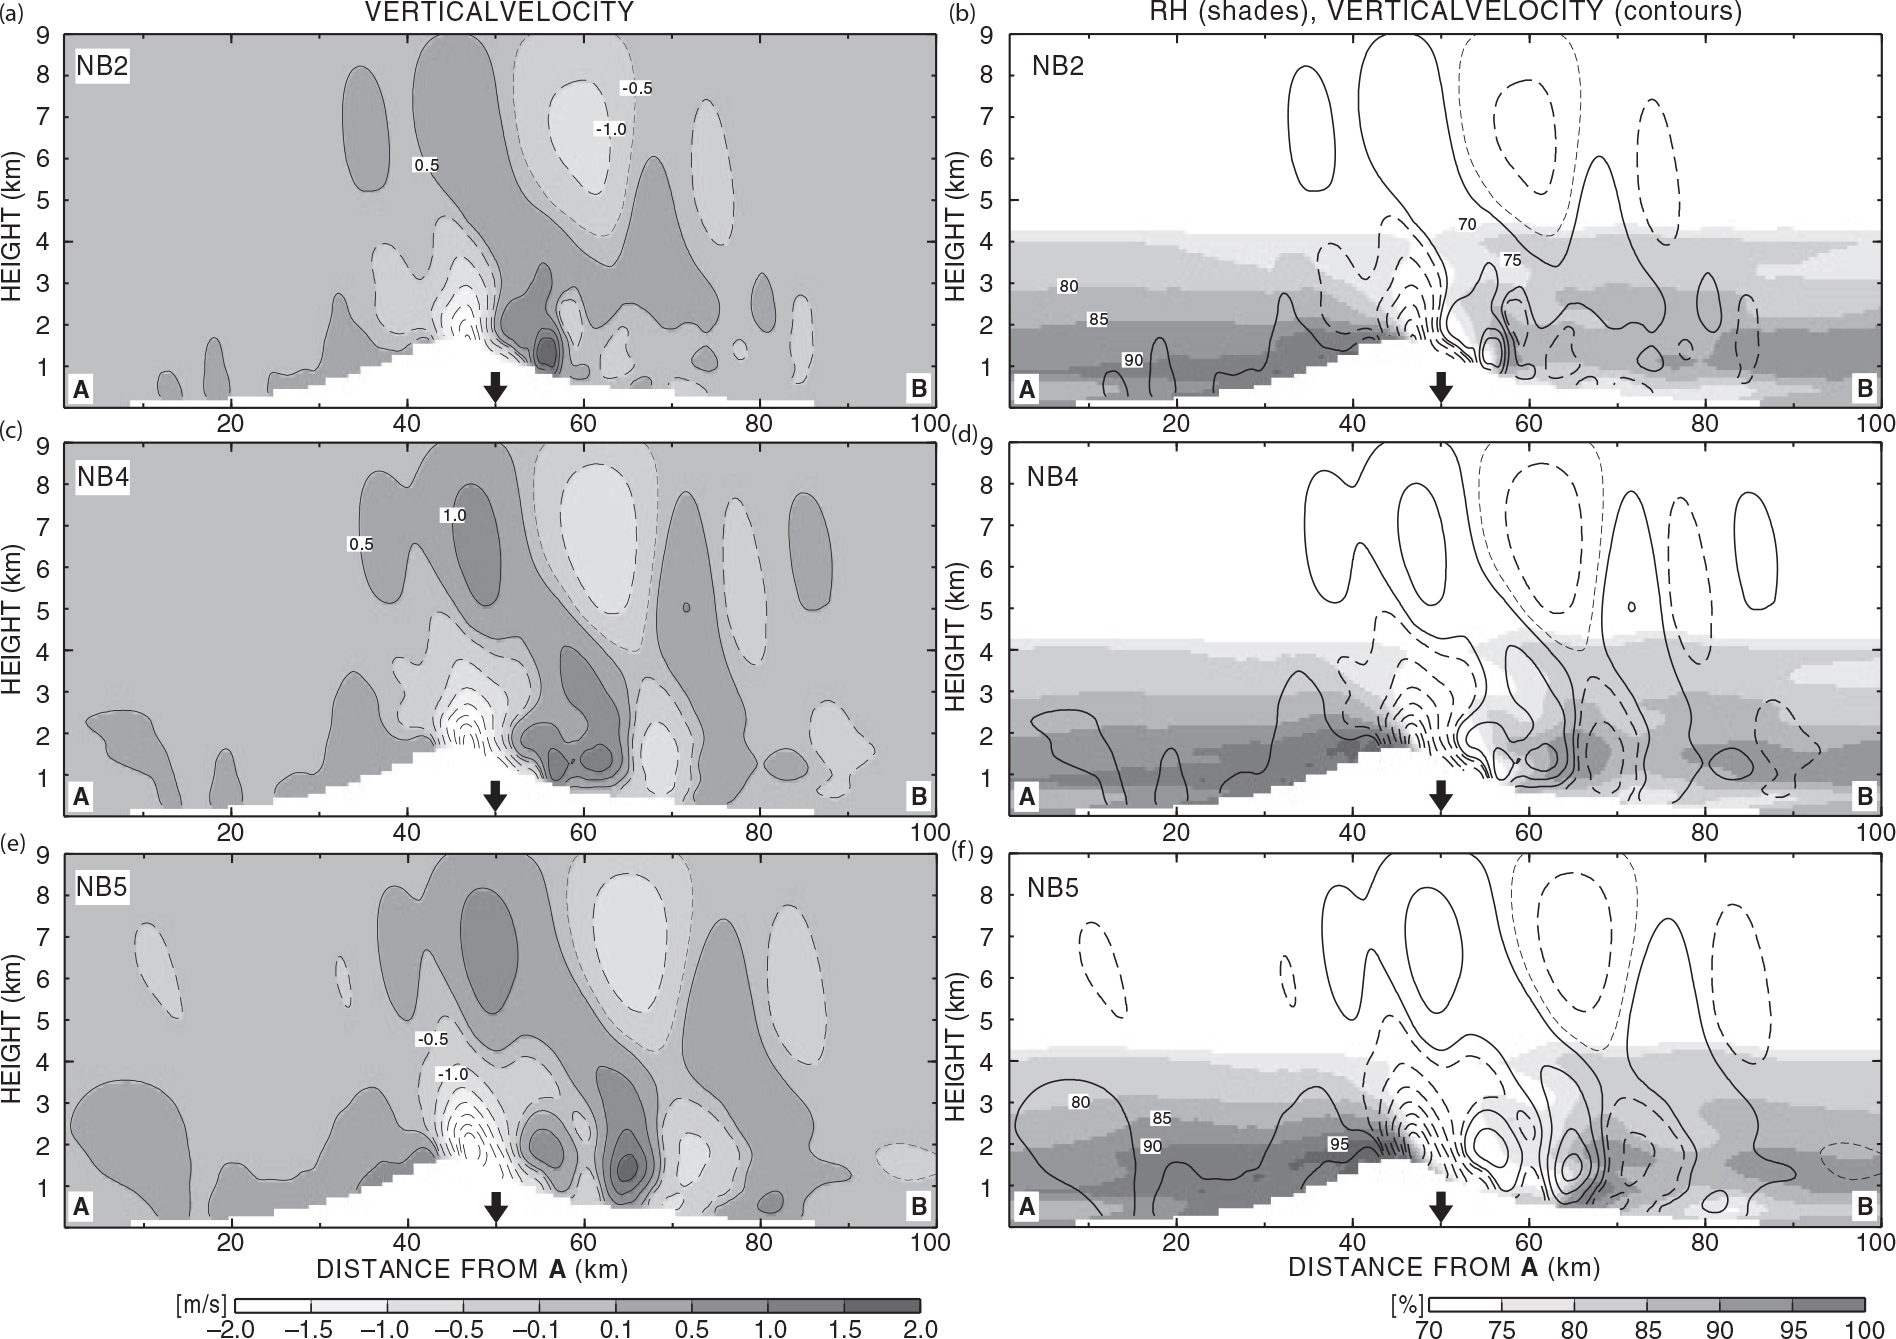
Fig. 3
Vertical distributions of vertical velocity and relative humidity (RH) in the NB2, NB4 and NB5 runs at 0100 ST. The locations of the cross-sections are shown in Fig. 2a, c and e. The left panels (a), (c) and (e) depict the vertical velocity in grey scale. Regions of updraft stronger than 0.5 m s−1 and downdraft stronger than −0.5 m s−1 are contoured by solid lines and dashed lines, respectively, (contour interval, 0.5 m s−1). The right panels (b), (d) and (f) indicate regions of RH >70% in grey scale and the vertical velocity by contours (as in the left panel).
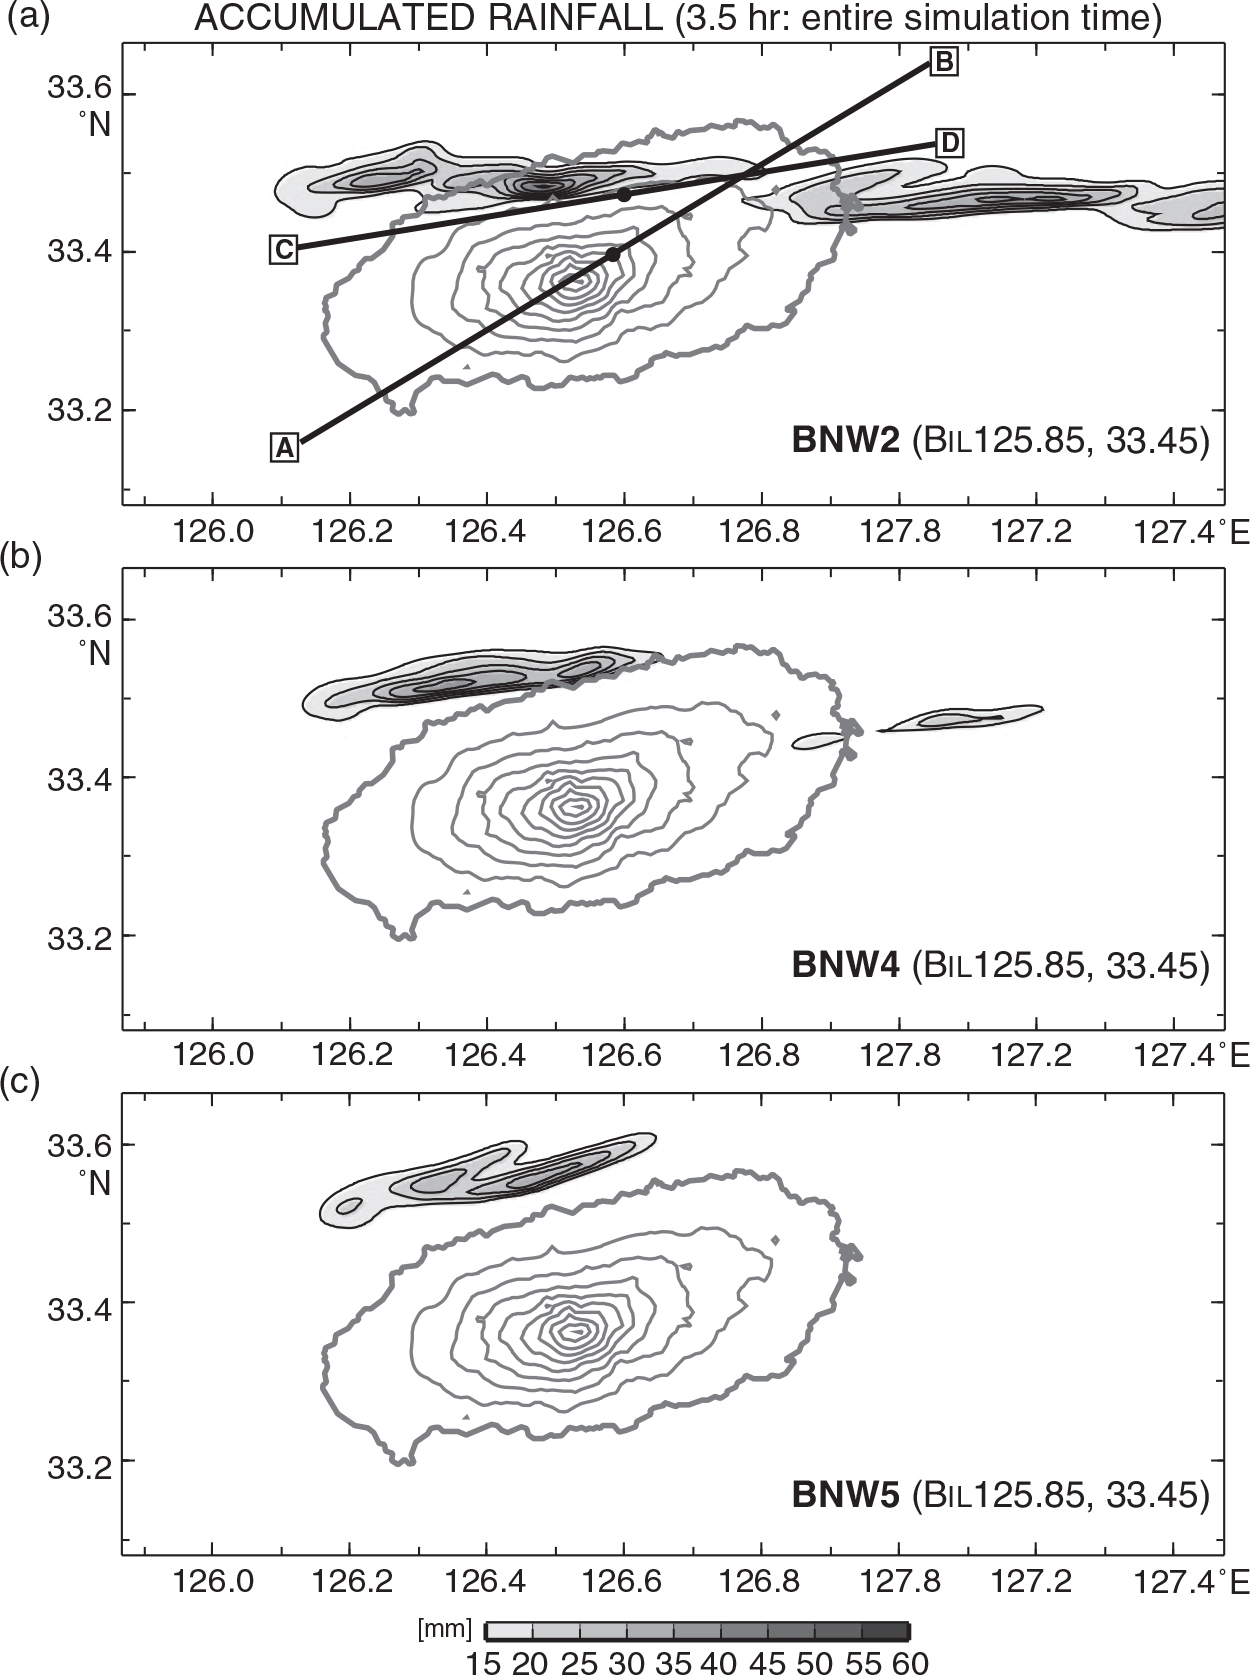
Fig. 4
Accumulated rainfall during the 3.5-hr simulation in the (a) BNW2, (b) BNW4 and (c) BNW5 runs. Contour interval, 5 mm, starting from 15 mm. Thick and thin solid lines in each panel depict the topography of Jeju Island (contour interval, 200 m). The locations of the vertical transects A–B and C–D in Fig. 7a, c and d are indicated in (a). Black dots on the transects in (a), which are the midpoints on the transects, located at 50 km on transect A–B and 43 km on transect C–D, represent the locations of the downward pointing arrows in each panel of Fig. 7.
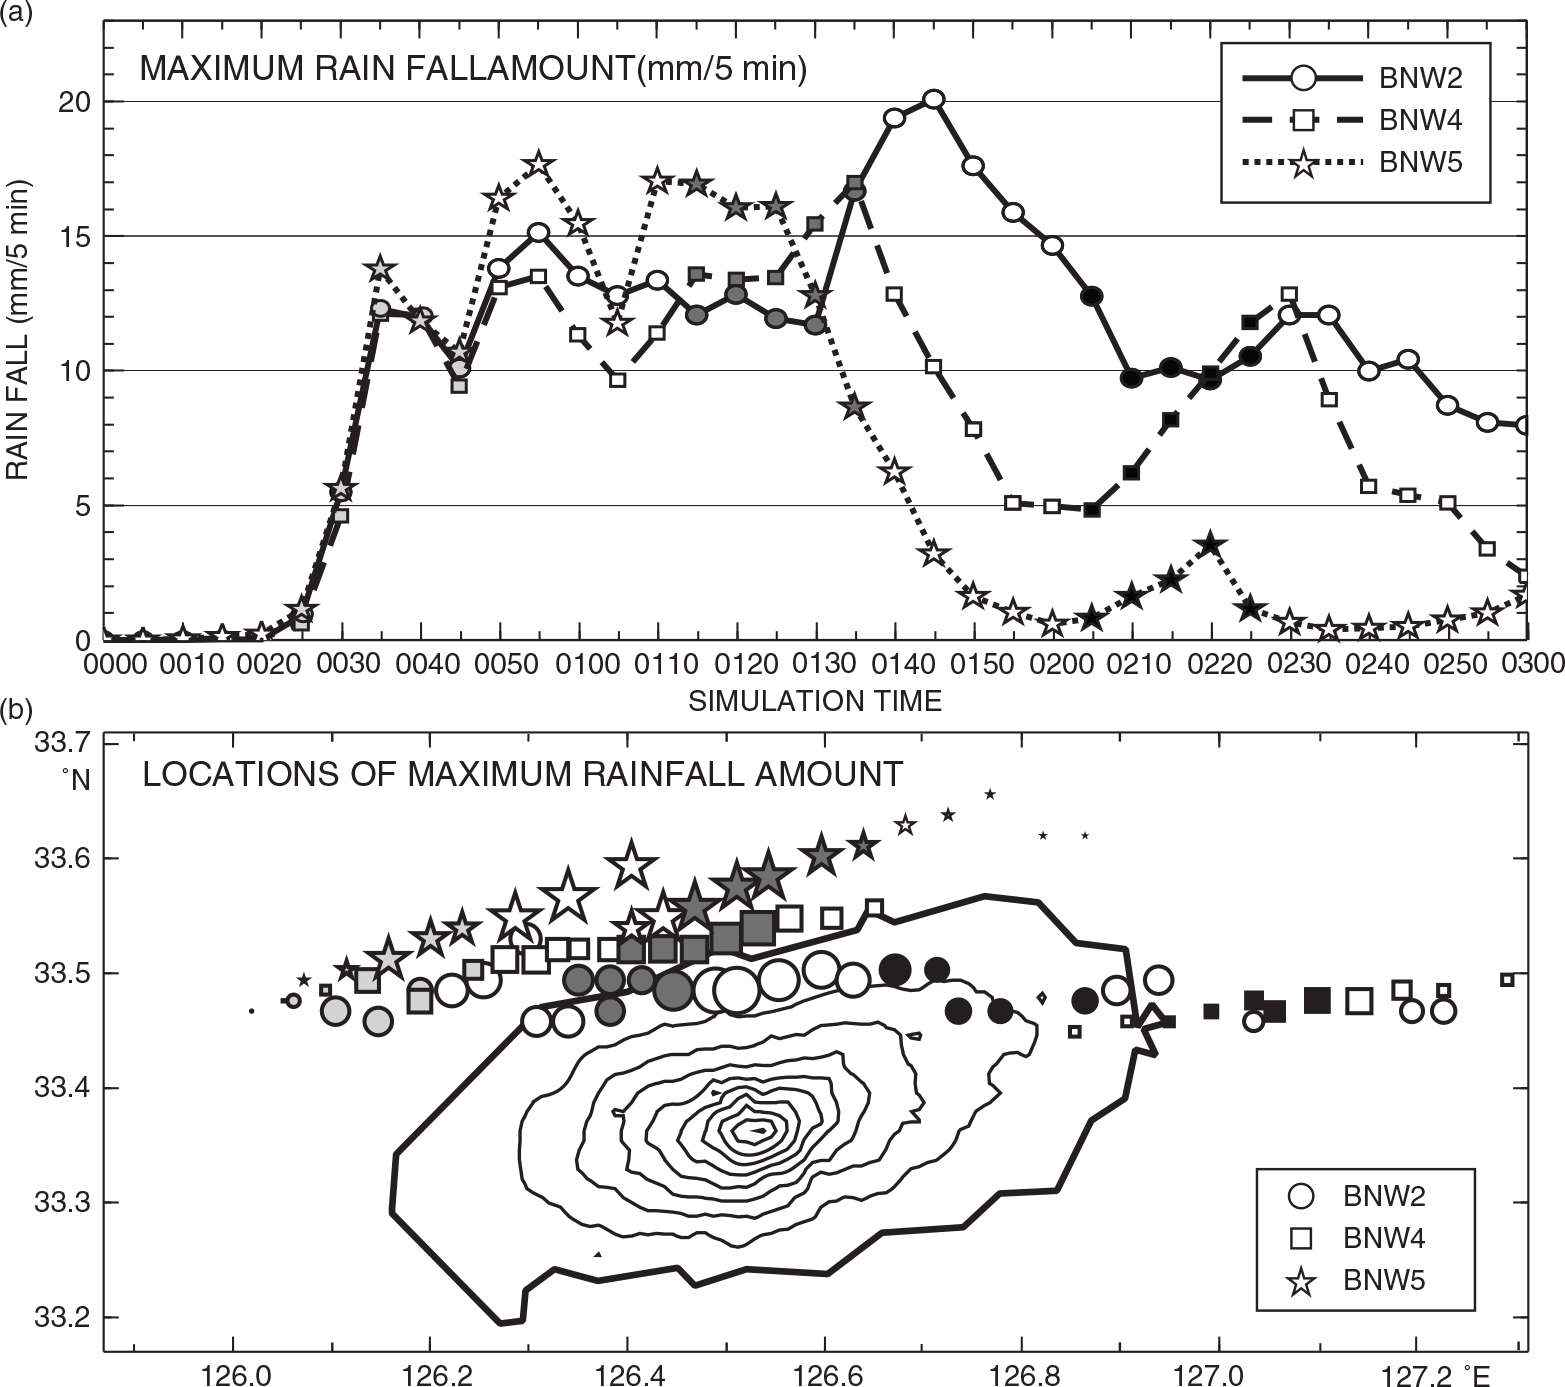
Fig. 5
Temporal variations in rainfall amount in the BNW2, BNW4 and BNW5 runs: (a) Time variation of the maximum accumulated rainfall amount (rainfall per 5 min) for the BNW2, BNW4 and BNW5 runs are depicted with solid, dashed and dotted lines, respectively. (b) The locations of maximum rainfall amount for the BNW2, BNW4 and BNW5 runs are represented as shaded circles, squares and stars, respectively. The grey shading of the symbols represents the time period and is changed every 25 min from 0025 ST; during the periods 0025–0045 ST and 0115–0135 ST, the symbols are shaded light and dark grey, respectively. During the period 0205–0225 ST, the symbols are shaded black. The size of each symbol is weighted to show the amount relative to maximum values. Thick and thin solid lines in (b) depict the topography of Jeju Island (contour interval, 200 m).
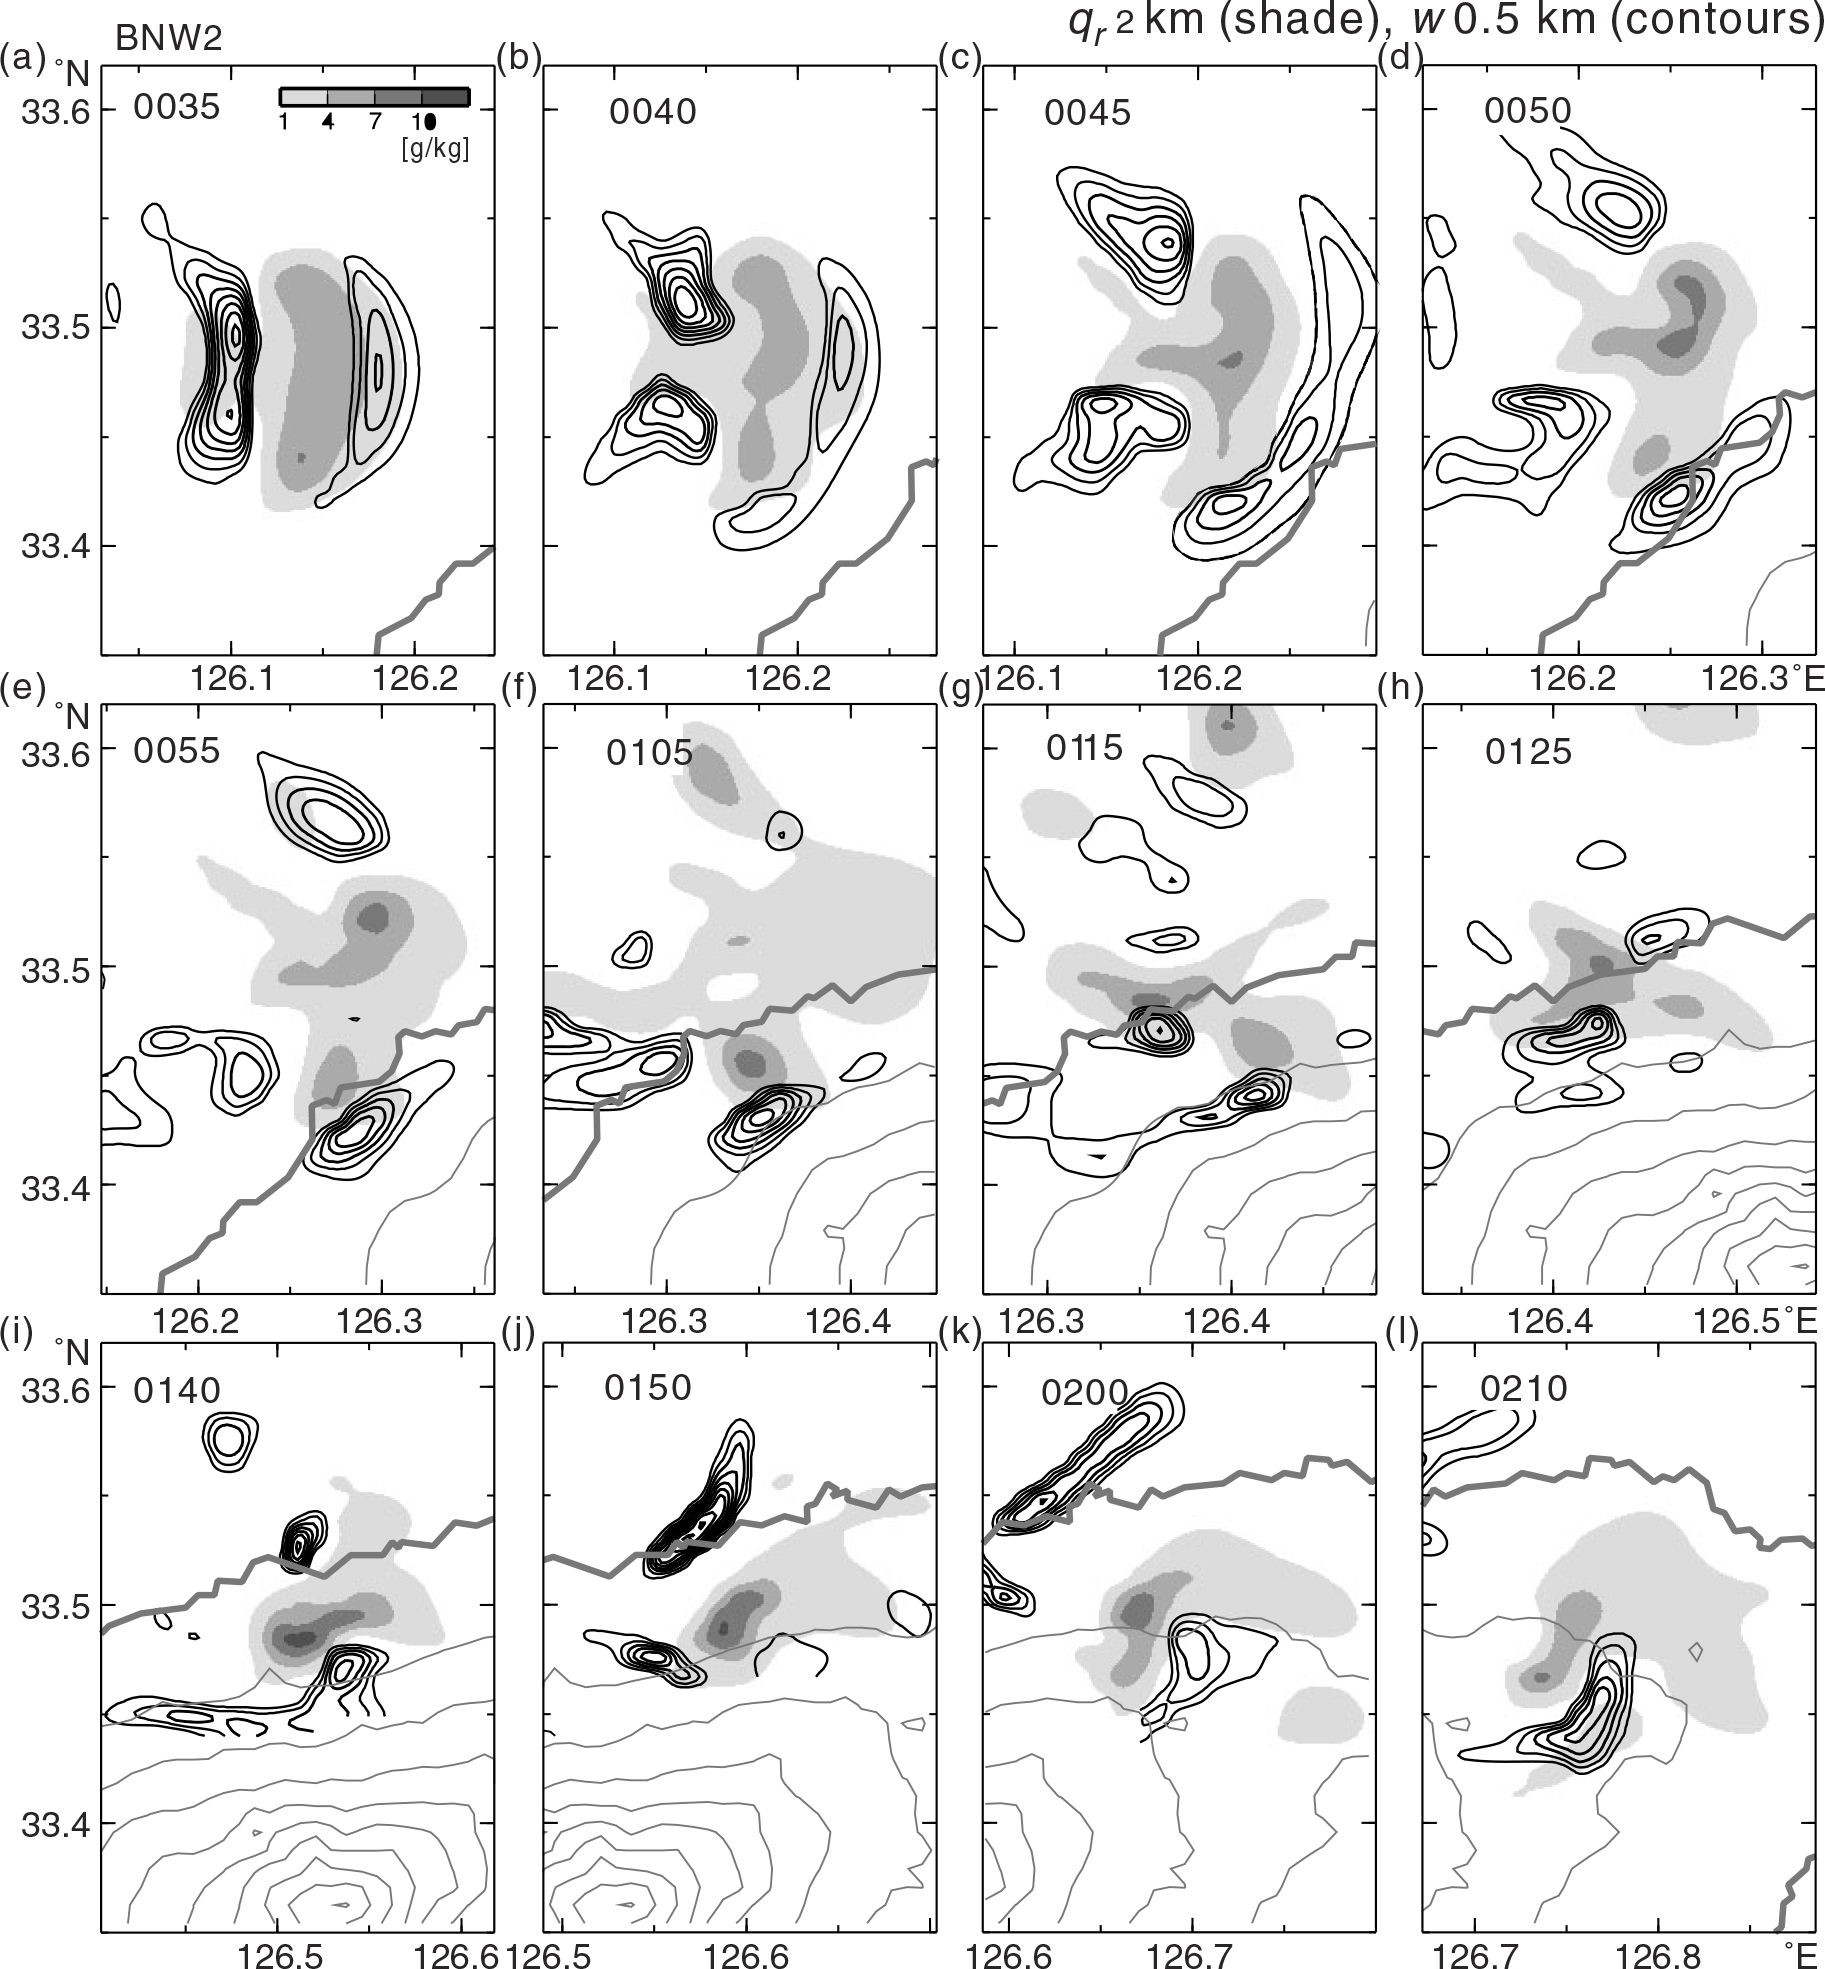
Fig. 6
Horizontal distributions of the mixing ratio of rain water (qr , in grey scale) at a height of 2 km and the updraft (w, contours) at a height of 500 m in the BNW2 run: (a)–(e) at 5-min intervals during the period 0035–0055 ST; (f)–(h) at 10-min intervals during the period 0105–0125 ST; and (i)–(l) at 10-min intervals during the period 0140–0210 ST. Regions of w>0.3 m s−1 are contoured by solid lines (contour interval, 0.2 m s−1). Regions of qr >1 g kg−1 are shaded in grey scale (shade interval, 3 g kg−1). The thick and thin grey contour lines represent the coastline and the topography, respectively, of Jeju Island (contour interval, 200 m).
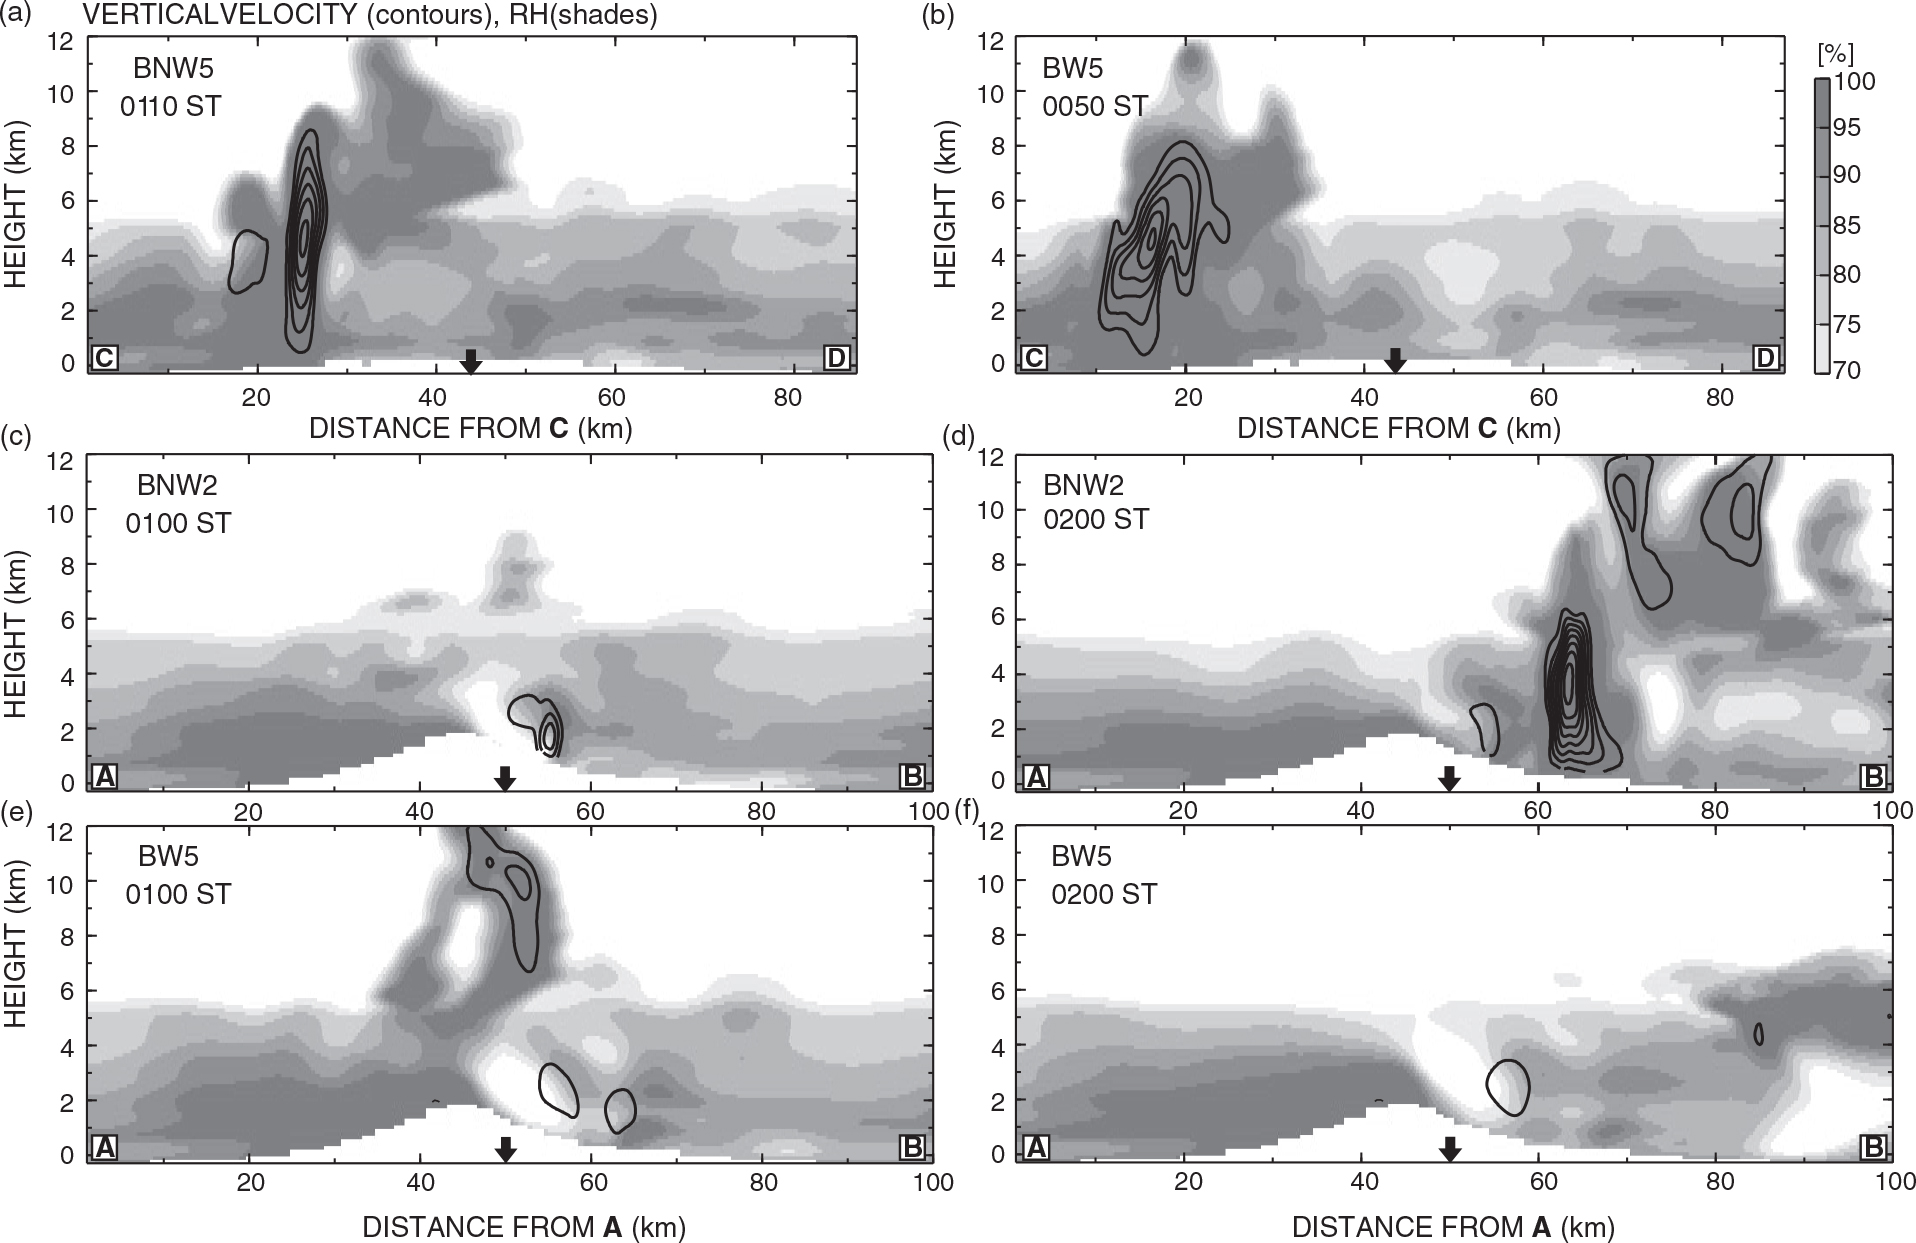
Fig. 7
Vertical distributions of vertical velocity (contours) and relative humidity (RH, shading). (a), (b) Updrafts stronger than 1.0 m s−1 along transect C–D are contoured by solid lines (contour interval, 1.0 m s−1). (c)–(f) Along transect A–B, updrafts stronger than 0.5 m s−1 are contoured by solid lines (contour interval, 0.5 m s−1) and values of RH >70% are depicted in grey. The locations of transects A–B and C–D are shown in Fig. 4a for the BNW2 run and in Fig. 8c for the BW5 run. The midpoints along transects A–B and C–D are represented by thick downward arrows on the horizontal axes of each panel.
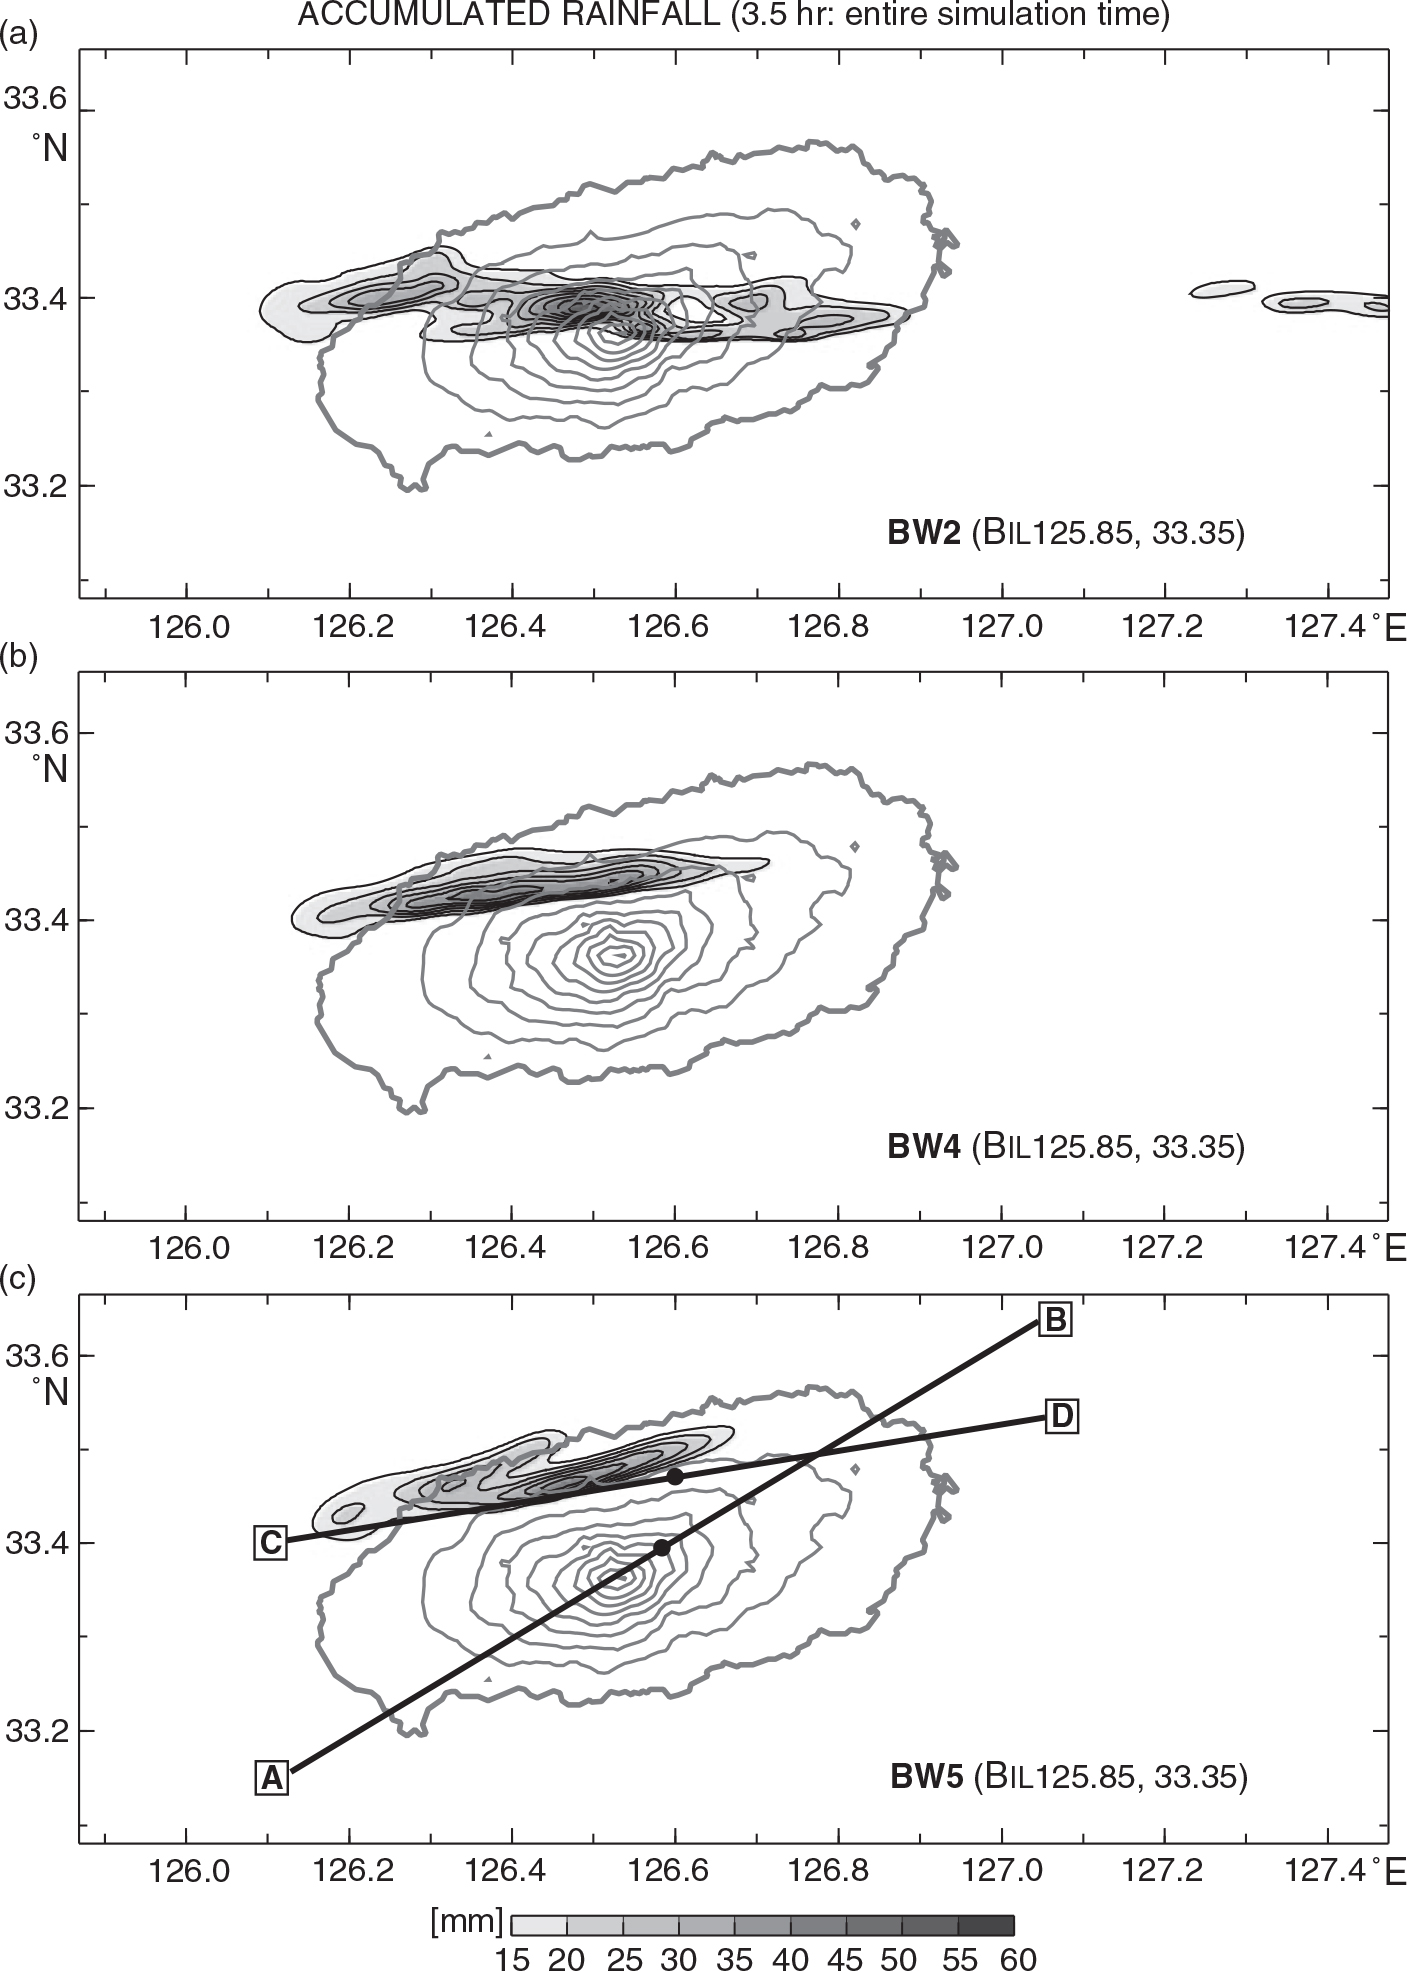
Fig. 8
Accumulated rainfall amount for 3.5 hr of the entire simulation time in (a) BW2, (b) BW4 and (c) BW5 runs. Contour interval is 5 mm starting from 15 mm. Thick and thin solid lines in each panel depict the topography of Jeju Island (interval: 200 m). The locations of the vertical transects A–B and C–D in Fig. 7b and 7e–f are indicated in (c). Black dots on the lines in (c) showing the midpoints of transect A–B at 50 km and of transect C–D at 43 km represent the locations of the downward pointing arrows in each panel of Fig. 7. Black dots on transect A–B and C–D in (c) are the midpoints of the transects and represent the locations of the downward pointing arrows in each panel of Fig. 7.
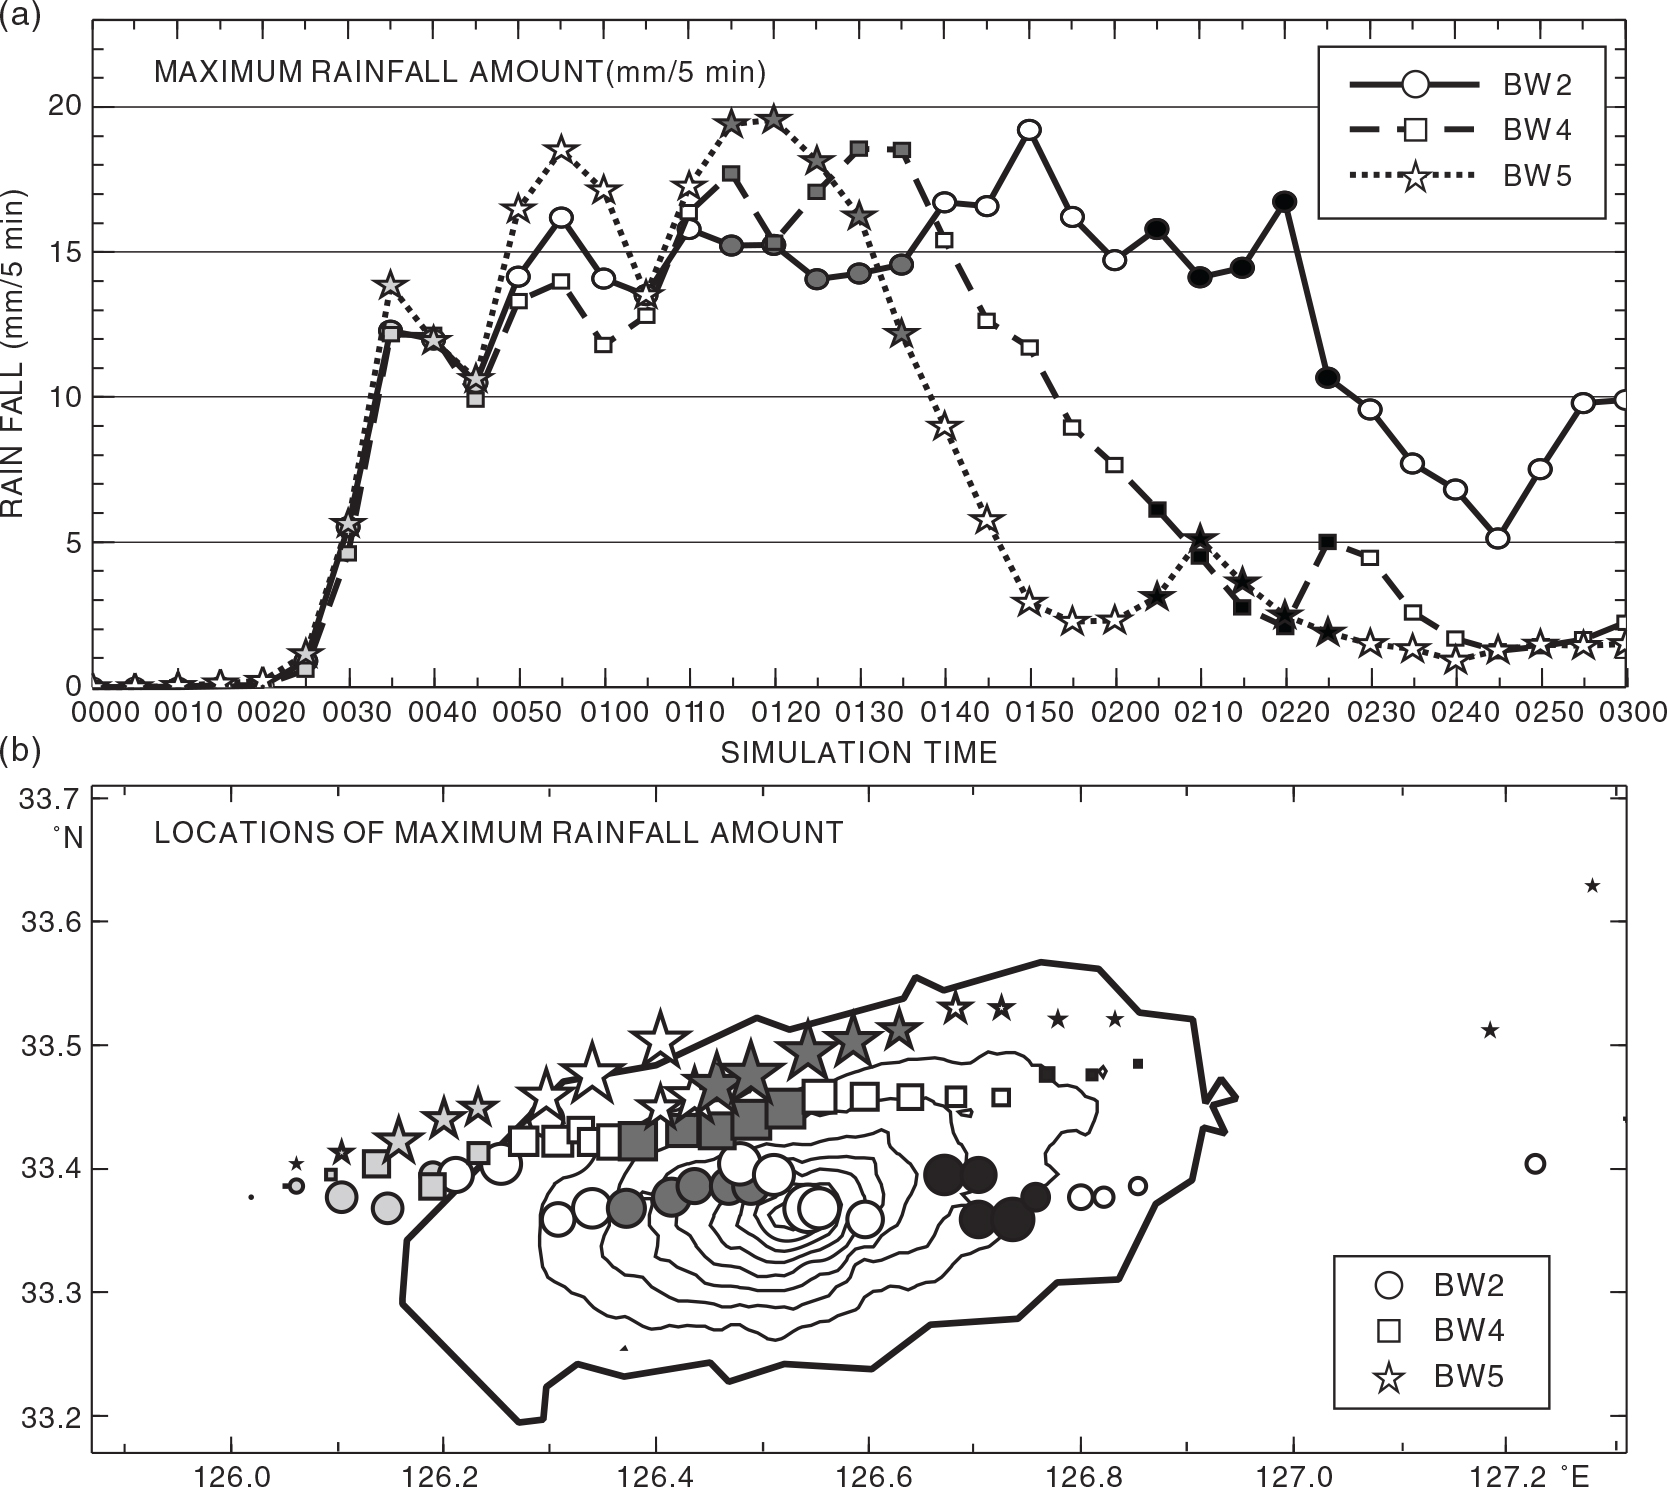
Fig. 9
Temporal variations in rainfall amount in the BW2, BW4 and BW5 runs: (a) Time variation of the maximum accumulated rainfall amount (rainfall per 5 min) for the BW2, BW4 and BW5 runs are depicted with solid, dashed and dotted lines, respectively. (b) The locations of maximum rainfall amount for the BW2, BW4 and BW5 runs are represented as shaded circles, squares and stars, respectively. The grey shading of the symbols represents the time period and is changed every 25 min from 0025 ST; during the periods 0025–0045 ST and 0115–0135 ST, the symbols are shaded light and dark grey, respectively. During the period 0205–0225 ST, the symbols are shaded black. The size of each symbol is weighted to show the amount relative to maximum values. Thick and thin solid lines in (b) depict the topography of Jeju Island (contour interval, 200 m).
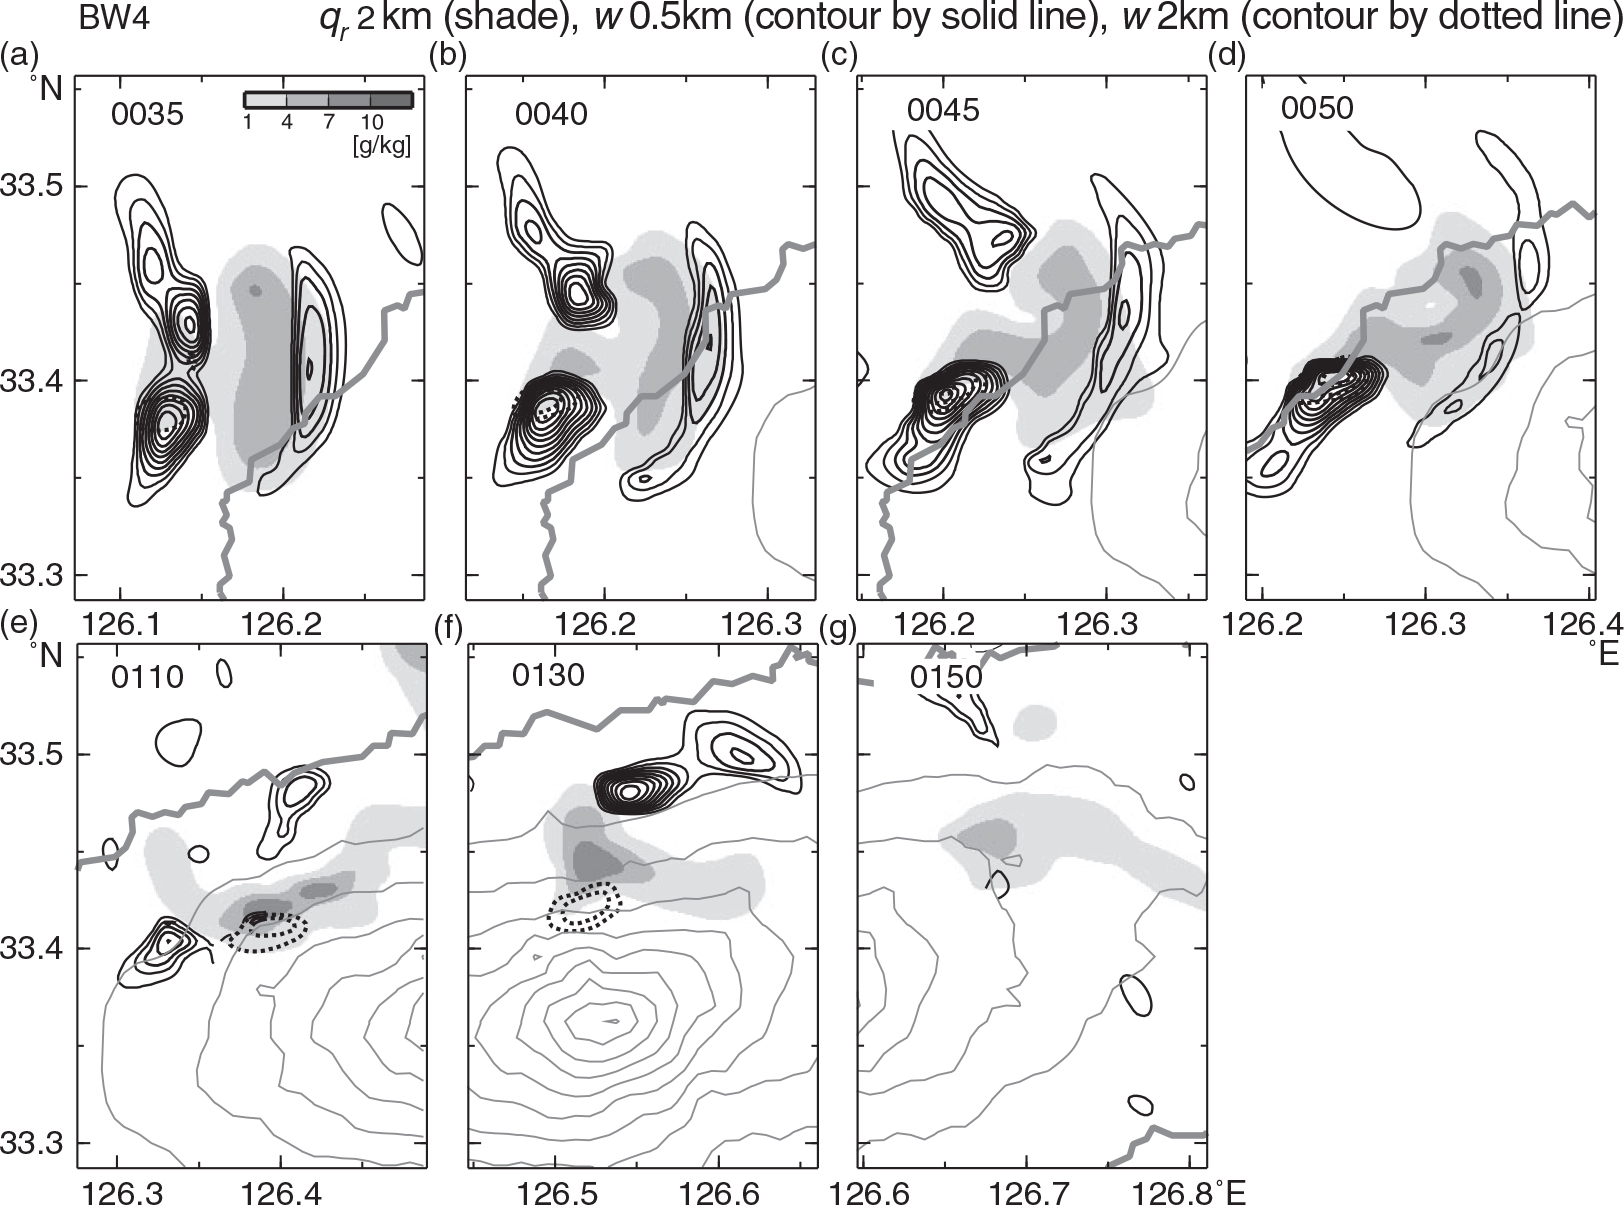
Fig. 10
Horizontal distributions of the mixing ratio of rain water (qr , in grey scale) at a height of 2 km and the updraft (w, contours) at a height of 500 m in the BW4 run: (a)–(d) at 5-min intervals during the period 0035–0050 ST; and (e)–(g) at 20-min intervals during the period 0110–0150 ST. Regions of w>4 m s−1 at a height of 2 km are contoured by dotted lines (contour interval, 2 m s−1). The shaded and contoured regions are as in Fig. 6.
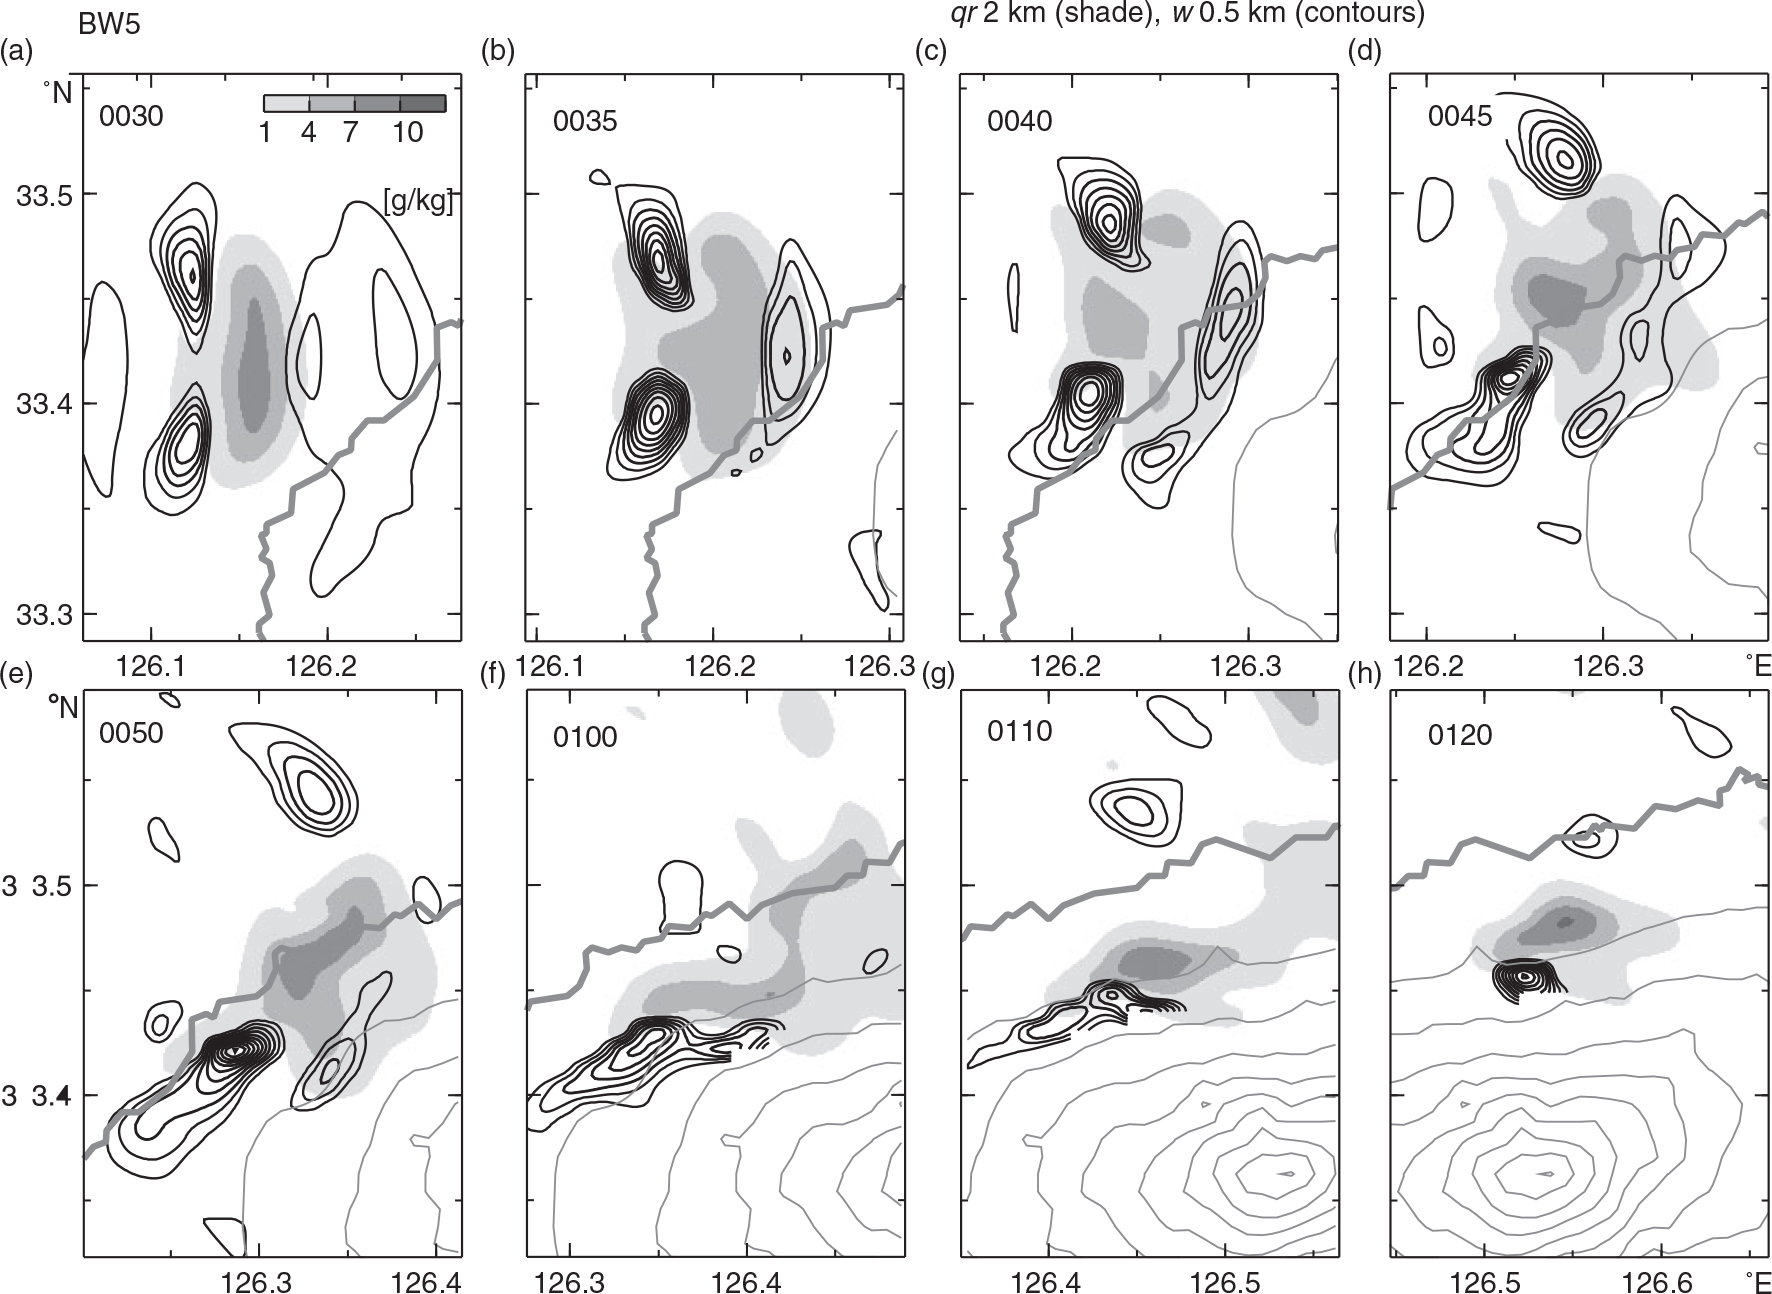
Fig. 11
Horizontal distributions of the mixing ratio of rain water (qr , in grey scale) at a height of 2 km and the updraft (w, contours) at a height of 500 m in the BW5 run: (a)–(e) at 5-min intervals during the period 0030–0050 ST; and (f)–(h) at 10-min intervals during the period 0100–0120 ST. The shaded and contoured regions are as in Fig. 6.
Table 4. Summarised results of experiments with bubble: inter-model comparisons
BNW220.133.48, 126.5 (onshore)150173150YesYesBNW416.933.53, 126.3 (offshore)1411380YesYesBNW517.733.56, 126.3 (offshore)110170NoNoBW219.233.36, 126.5 (crest)24149130NoNoBW418.633.44, 126.5 (onshore)1601290YesNoBW519.633.47, 126.5 (onshore)138870YesNo
[i] Pmax is the maximum rainfall amount in 5 min, and Lpmax is the location of Pmax. Awest and Aeast is the horizontal area of accumulated rainfall exceeding 20 mm to the west and east, respectively, of longitude 126.6°E, respectively. Drain is the duration of rainfall mounts exceeding 5 mm/5 min. OCwest and OCeast represent whether the rainfall system passes over the convergence zone on the western and eastern sides, respectively, of longitude 126.6°E.
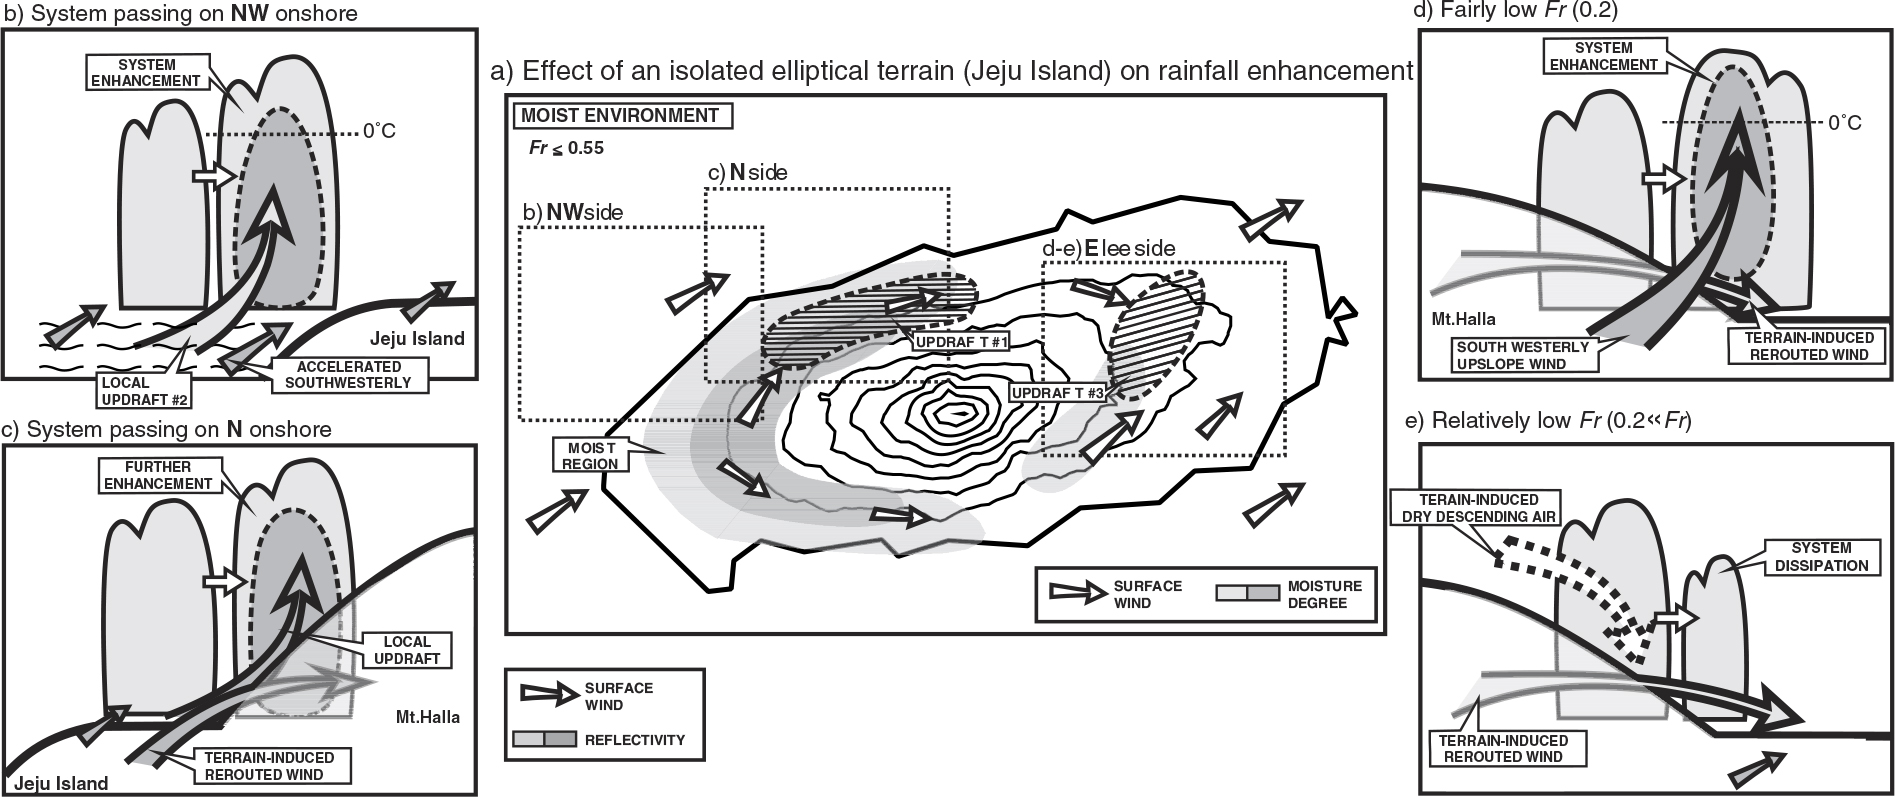
Fig. 12
Schematic diagram showing the effects of an isolated elliptically shaped terrain on the distribution of surface moisture and the evolution of rainfall systems in the vicinity of the terrain. (a) Distributions of surface wind (white arrows), moisture content (shading) and updrafts (hatched areas). (b) Terrain-induced rainfall enhancement off the northwestern shore of the terrain. (c) Terrain-induced rainfall enhancement on the northern lateral side of the terrain. (d) Terrain-induced rainfall enhancement on the lee side of the terrain. (e) Terrain-induced rainfall dissipation on the lee side of the terrain. The thick solid line in each panel indicates the topography of Jeju Island. The grey arrows in (b)–(e) indicate low-level winds.
Table 5. Vertical profiles of initial temperature (T), relative humidity (RH) and wind used in experiments. One full barb and half barb denote 5 and 2.5 m s−1, respectively.
8000259507500262507000265606500267606000270605500272705000273704500274804000277803500280803000284852500287852000290901500294901000294905002999015029990Land surface299––
Sea surface297––