
Table 1. Warm and cold years when the episodes matured after October
19631964196519701968197119691973197219741976197519771983198219841986198819871995199119981994199919972000200220052004200720062008200920102011
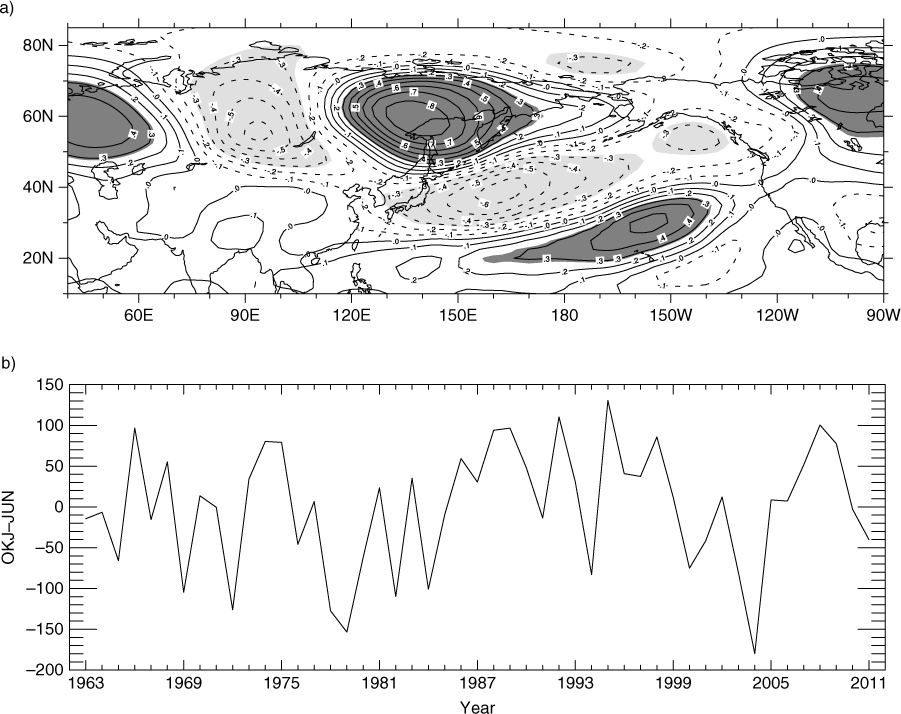
Fig. 1
The correlation coefficient between the OKJ–JUN and Z500 in (a) June and (b) the evolution of the OKJ–JUN from 1963 to 2011. Shaded areas in (a) indicated the regions over the 95% confidence level. The contour interval is 0.1.
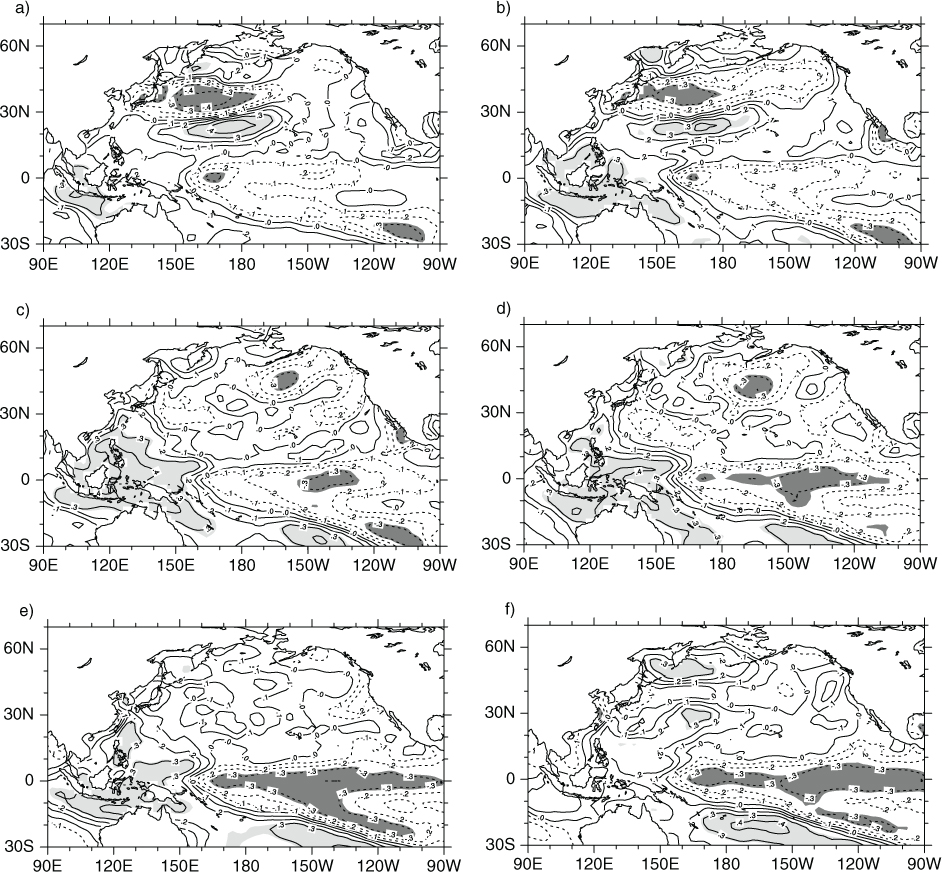
Fig. 2
The correlation coefficient between the OKJ–JUN and SST during (a) June, (b) July, (c) August, (d) September, (e) October, (f) November, from 1963 to 2011. Shaded areas indicated the regions over the 95% confidence level. The contour interval is 0.1.
Table 2. The years with the OKJ–JUN values for the three intensity levels of the index from 1963 to 2011
YearOKJ–JUNYearOKJ–JUNYearOKJ–JUN
196696.71964*−6.51963−14.4196855.21971−0.41965**−65.91970*13.619776.61967−15.51973*34.31985−9.21969−104.6197480.32005*8.71972**−126.1197579.22006**7.11976**−45.8198123.42010*−3.01978−127.41983*35.31979−153.4198659.21980−62.0198730.51982−109.91988*94.01984−100.8198996.61991−13.7199048.21994−83.01992110.42000−75.0199330.82001−41.31995*130.52003−80.5199640.82004−179.9199737.42011−40.11998*85.8199912.0200212.32007*51.52008100.52009**77.5
[i] Italic and bold digits indicate warm and cold years, respectively, listed in Table 1. Single (double) asterisks show the cold (warm) years that follow warm (cold) years immediately.
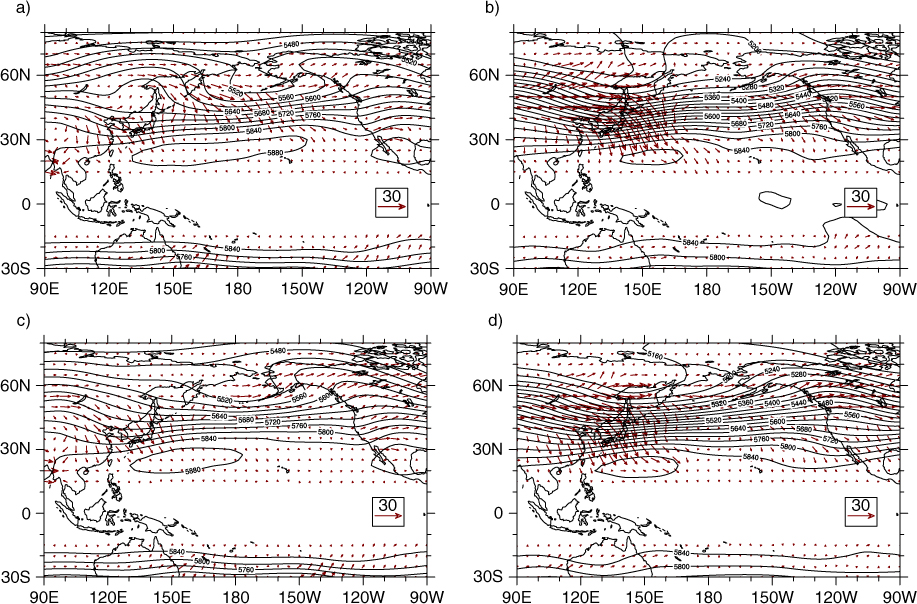
Fig. 3
The composite of Z500 and HWAF (unit: m2 s−2) for the years: 1966, 1968, 1974, 1975, 1986, 1988, 1989, 1992, 1995, 1998, 2007, 2008, 2009 for (a) June and (b) November, and for the years 1965, 1969, 1972, 1978, 1979, 1980, 1982, 1984, 1994, 2000, 2003, 2004 for (c) June and (d) November. The blank area between 10°S and 10°N indicates the HWAF near zero. The contour interval is 40 gpm.
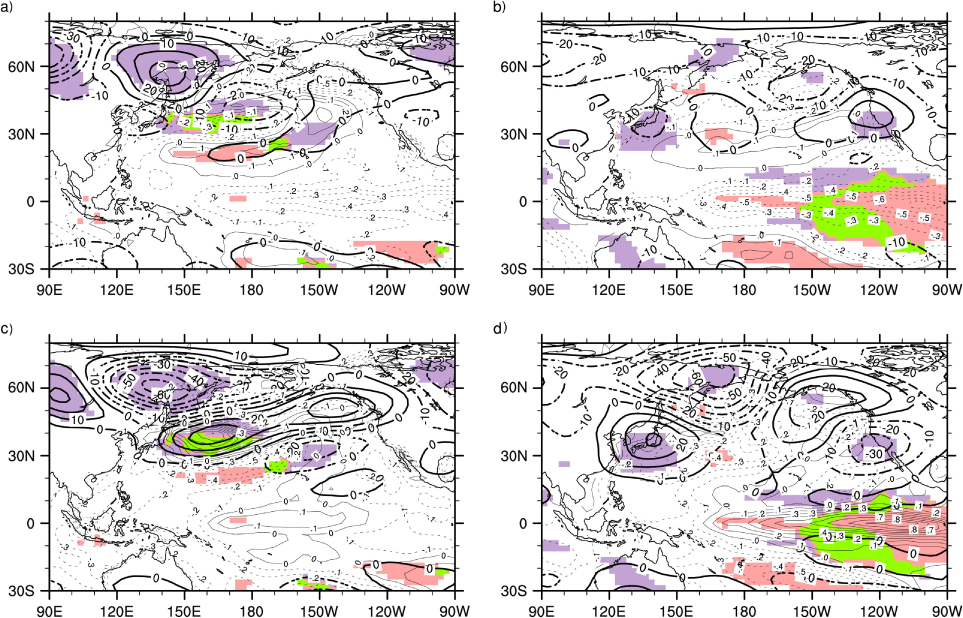
Fig. 4
As in Fig. 3, except for the composite of SSTA and Z500A. Thin contour line indicated SSTA (interval 0.1 K) and thick lines show the contour of the Z500A (interval: 10 gpm). Areas with purple (pink) colour indicated the regions where the difference in Z500 anomalies (SSTA) between high and low OKJ composite were statistically significant at 95% confidence level by t-test. Areas with green colour indicated the overlapping regions for the significant SSTA and Z500 anomalies.
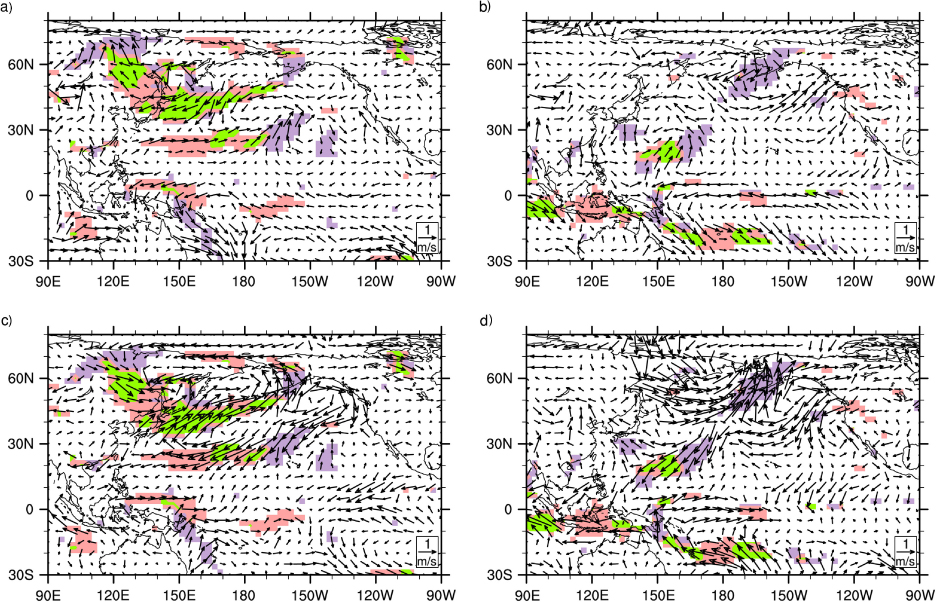
Fig. 5
As in Fig. 3, except for the anomalies of the surface wind vector (unit: ms−1). Areas with purple (pink) colour indicated the regions where the difference in meridional (zonal) surface wind anomalies between high and low OKJ composite were statistically significant at 95% confidence level by t-test. Areas with green colour indicated the overlapping regions for the significant meridional and zonal wind surface anomalies.
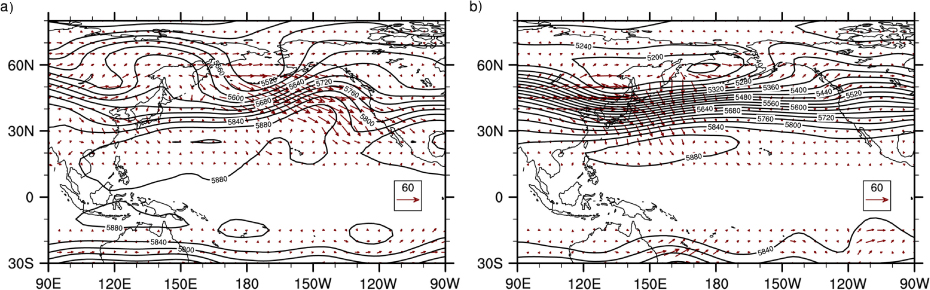
Fig. 6
As in Fig. 3, except for (a) June and (b) November 1998.
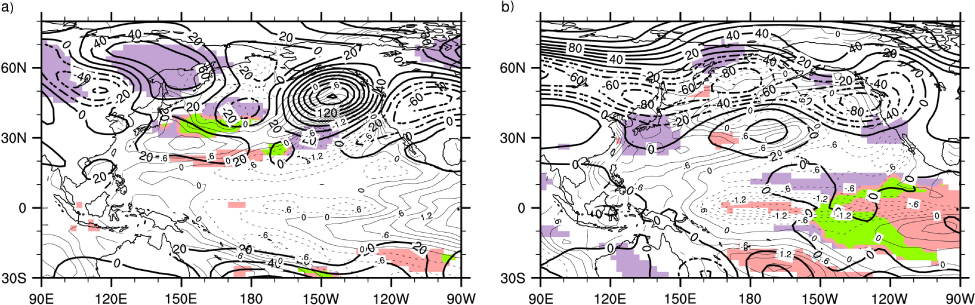
Fig. 7
As in Fig. 4, except for (a) June and (b) November 1998. The contour interval for the Z500A is 20 gpm and that for SSTA is 0.3 K.
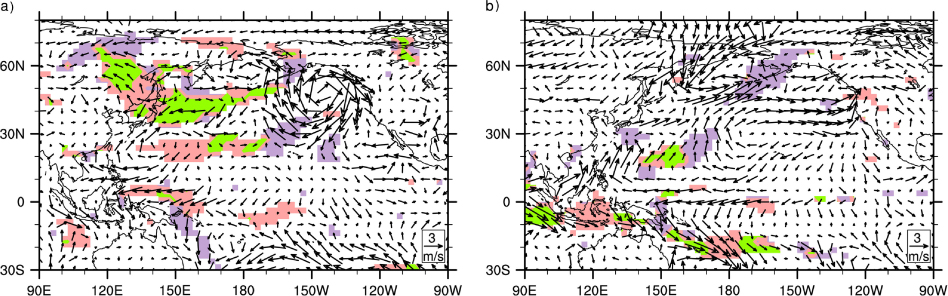
Fig. 8
As in Fig. 5 except for (a) June and (b) November 1998.
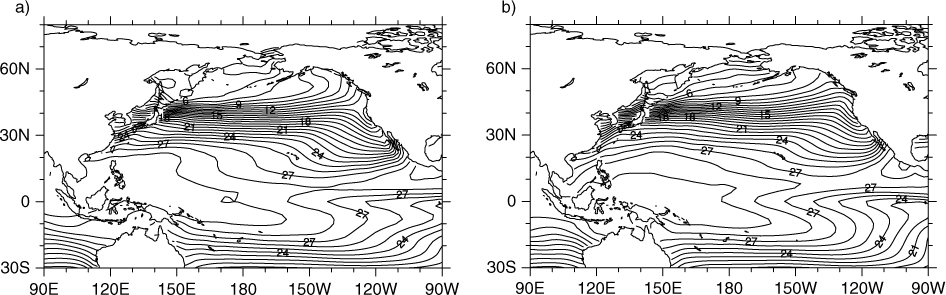
Fig. 9
The SSTs during (a) June, and (b) November averaged from 1963 to 2011. The contour interval is 1°C.
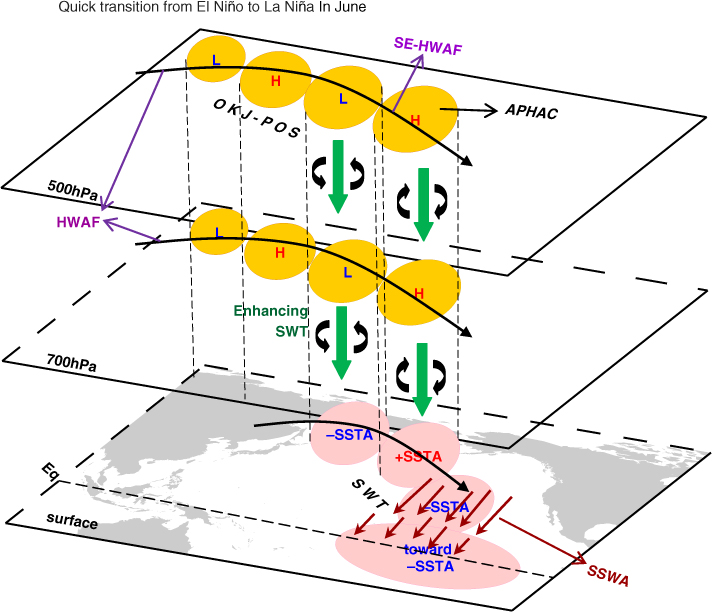
Fig. 10
The schematic of the quick transition from El Niño to La Niña: (1) The OKJ-POS dominates with barotropic structure in the middle and lower troposphere when El Niño has been decaying. The APHAC over about 30°N, 155°W with an anticyclonic rotation formed by propagation is shown. Upstream SE-HWAF further enhances all action-centres of the OKJ-POS teleconnection. (2) The SWT was generated in response to the propagation through the process of barotropic air–sea interaction, in which sea current has similar motion to the overlying flow. The SSWA forced out by the anticyclonic rotation on the east side of the APHAC can arrive into the EEP, which implies that the similar southward sea current could be generated in the southern SWT. This process plays a role in transporting cold water towards the EEP gradually. (3) The SWT can maintain itself for months without OKJ-like forcing or be enhanced by other types of SE-HWAF albeit with some phase shift southward. The transmission of the cold water from the SWT into the EEP keeps working and accelerates the decrease of the SST in the EEP with the reduction of the sea surface height in-situ so that La Niña matures completely in the following months.